Abstract
We demonstrate extreme superheating and single bubble nucleation in an electrolyte solution within a nanopore in a thin silicon nitride membrane. The high temperatures are achieved by Joule heating from a highly focused ionic current induced to flow through the pore by modest voltage biases. Conductance, nucleation, and bubble evolution are monitored electronically and optically. Temperatures near the thermodynamic limit of superheat are achieved just before bubble nucleation with the system at atmospheric pressure. Bubble nucleation is homogeneous and highly reproducible. This nanopore approach more generally suggests broad application to the excitation, detection, and characterization of highly metastable states of matter.
In the course of exploring the limits and consequences of extreme current densities in solid state nanopores [1], we have discovered that matter can be brought to highly localized, excited metastable thermal states in the pore. Moreover, these states can be probed and studied in a remarkably detailed and simple way and potentially used for practical purposes in many disciplines. We demonstrate this capability by bringing an aqueous electrolyte solution in a nanopore to extreme levels of superheat, culminating in homogeneous nucleation and growth of the vapor phase. This is achieved under highly repeatable conditions amenable to modern multiphysics based modeling.
The homogeneous nucleation and growth of vapor bubbles in liquids is a phenomenon whose thermal, kinetic and mechanical aspects have been experimentally explored and theoretically modeled to varying degrees of sophistication from the time of Gibbs to the present [2–4]. In classical nucleation theory (CNT), a superheated liquid must overcome a surface tension induced energy barrier to bubble formation by means of localized density fluctuations. The degree of superheat and rates of bubble nucleation have been characterized by kinetic models appealing to microscopic mechanisms involved in nucleation [5–10]. The superheat limit of liquids has been studied using a variety of experimental methods. Among the most successful are microcapillary boiling [11, 12], heating in a host liquid [13], pulse heating of a filament [14, 15]. Bubble nucleation and dynamics associated with the phenomena of cavitation [16], sonoluminescence [17, 18], laser induced heating of nanoparticles [19], and heterogeneous bubble formation in macroscopic pores [20] have also been areas of intense study recently.
Here, we present new methods for observing and studying superheating and homogeneous single bubble nucleation in the extreme environment created in a single nanopore. We begin by reporting electrical conductivity measurements on a nanopore immersed in an electrolyte; these indicate extreme Joule heating, followed by bubble nucleation, probed on nanosecond time scales. High frequency periodic bubble nucleation and growth phenomena are presented. Optical measurements are used to determine the bubble nucleation site and to estimate the initial bubble growth rate. Calculated results are then discussed, accounting for and expanding on the variety of phenomena revealed in the experiments.
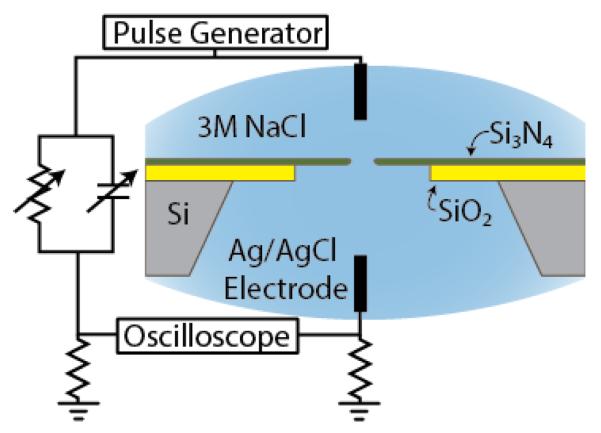
A schematic of the experiment is shown in Fig. 1. A single nanopore was fabricated with a focused ion beam machine in a free-standing silicon nitride membrane affixed to a silicon dioxide/silicon frame. Silicon nitride was chosen because it is highly wettable and has a higher thermal conductivity than the electrolyte, both of which are important for extreme superheating, minimizing heterogeneous nucleation (compare with [20]). It was mounted in a fluidic cell in which the membrane separated two fluid chambers connected electrically only through the pore. A 3 M NaCl solution prepared in deionized, degassed water was added to each chamber and contacted with Ag/AgCl electrodes. A pulse generator (HP 8110A), current sensing resistor, and high bandwidth (500 MHz) oscilloscope are connected to the fluidic cell with a compensation circuit to minimize the effect of capacitance between the two fluidic chambers.
FIG. 1.
(color). Cross sectional schematic of the experimental setup.
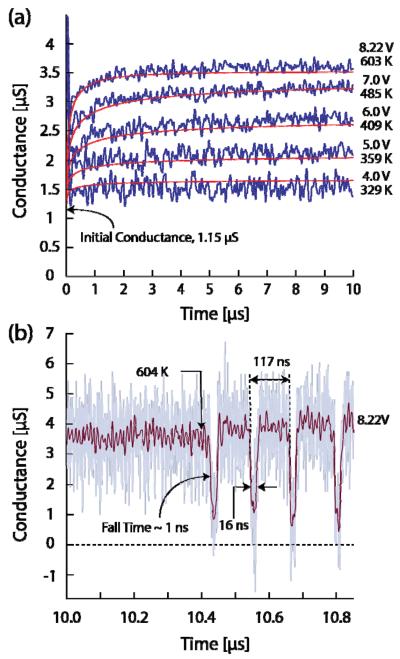
Figure 2a shows the time-dependent nanopore conductance observed when 11 μs voltage pulses, ranging from 4 V to 8.22 V, with 30 ns rise time were applied across a 53.5 nm radius, 71 nm thick nanopore. The initial nanopore conductance is 1.15 μS (aside from an initial capacitance spike due to imperfect compensation) and increases with time and applied voltage to a value of 3.5 μS and a current density of 3.3×10⁹ A/m2. The rise is expected due to time dependent Joule heating of the electrolyte in and near the pore and the positive temperature dependence of electrolyte conductivities, which are strongly influenced by the temperature dependence of the water viscosity [21]. The noise in the data belongs to the oscilloscope amplifiers.
FIG. 2.
(color). (a) The conductance of a 53.5 nm radius 71 nm thick nanopore at 4, 5, 6, 7 and 8.22 volts. The data are filtered at 13 MHz from 0 to 1 μs and 20 MHz from 1 μs to 10 μs by an 8-pole Bessel filter. Computed conductance curves for each voltage are shown along with the calculated maximum temperatures achieved in the pore. (b) Continuation of the 8.22 V conductance data after 10 μs. The data are filtered at 200 MHz; the faded line in the background is the unfiltered measured conductance data.
Figure 2b shows a bubble nucleation event at 10.4 μs in the continuation of the 8.22 V conductance data. It consists of a rapid drop in conductance when the bubble blocks the ionic conduction through the pore. After the bubble collapse, subsequent bubble events are seen to occur with quasi-regular periodicity. The duration of each bubble event is approximately 16 ns with 120 ns between events. The behavior is that of a relaxation oscillator whose time constant is determined by thermal dynamics discussed below.
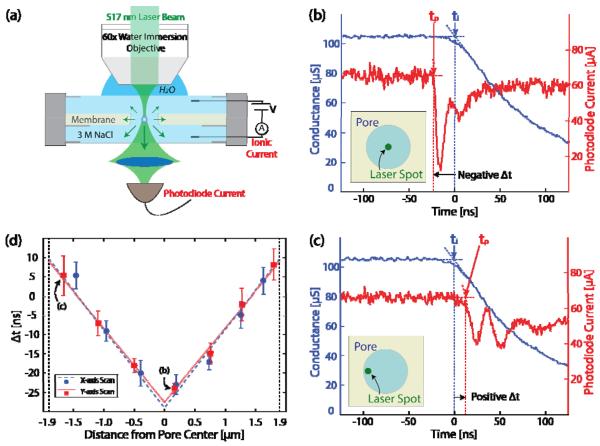
Figure 3a shows a second experimental setup, using a larger 1.9 μm radius, 2.5 μm thick pore, designed for optically probing the onset and location of the bubble nucleation in the pore. (Larger pores exhibit similar quasi-periodic bubble nucleation to that observed in the 53.5 nm radius pore albeit with lower frequencies at comparable voltage bias). Optical transmission of a focused 514 nm, 0.5 mW, CW laser through the pore is measured during the nucleation process. A 60x water immersion objective lens brings the laser to a beam waist diameter of 350 nm. The transmitted optical beam was captured and brought to a focus with f=0.62 optics onto a 1 ns response time silicon photodiode (Thorlabs DET10A). The photodiode current was monitored simultaneously with the time-dependent electrical signal from the ionic current passing through the pore. For this experiment, the response time for the ionic current measurement was determined by the capacitance of the pore membrane. The lateral x-y position of the beam waist could be accurately moved to different positions across the pore with beam steering optics.
FIG. 3.
(color). (a) Schematic of the optical experiment. (b), (c) Electrical conductance and photodiode current at the onset of a nucleation event with the focused laser at (b) the center and (c) the periphery of the pore. (d) Δt = tp − ti as a function of the laser position for x and y axis scan. Each point contains ten measurements; the error bars show the standard deviations from the mean. The measurements from the data shown in Figures 4(b) and 4(c) were used in the points labeled (b) and (c). Linear fitting is performed for the scans across each axis.
Figure 3b shows both the electrical conductance and photodiode current falling rapidly at the onset of a nucleation event, stimulated by the application of an 18 volt 22 μs pulse. At this voltage, the events consistently occur 14 μs after the pulse is applied. For these data, the laser beam waist was positioned near the pore center. We define an event onset time for both the optical and ionic current signal to be the intercept of the pre-bubble current level with the extrapolated linear region of the current drop. These are labeled in the figure as ti and tp for the ionic and photodiode current, respectively. Details of the optical signal beyond its initial rapid drop are not currently well understood but are unimportant for our current purposes.
When the laser beam waist is moved to the periphery of the pore, there is a clear increase in the delay in tp with respect to ti as seen in Fig. 3c. This suggests that the bubble was formed at the center of the pore, and as a result of its finite growth velocity there is a delay until it scatters the incident laser beam at the pore periphery.
Figure 3d confirms this view. It shows the offset Δt = tp − ti as a function of the laser position across the pore in two perpendicular directions. The points corresponding to the data in Figs. 3b and 3c are indicated. The symmetry of the data around the pore center confirms that the bubble nucleation events are homogeneous and occur at the center of the pore. The bubble radius growth velocity obtained from the slope of the data in the figure is 52.1±1.6 m/s for the y-axis scan and 49.2±1.7 m/s for the x-axis scan.
A straightforward interpretation of the data presented above involves rapid Joule heating of the electrolyte in and near the nanopore that ultimately results in nucleation of a vapor bubble at the pore center. The vapor bubble expands, cutting off the Joule heating when it reaches the pore periphery. It continues to grow due to fluid inertia and thermal energy stored in the superheated liquid. The bubble ultimately reaches a maximum size and then collapses after the vapor pressure in the bubble decreases below ambient pressure in the liquid sufficiently to overcome the inertial forces of liquid expansion.
We have calculated the coupled space- and time-dependent ionic current density and temperature fields in and near the pore prior to bubble formation. The time-dependent conductance of the pore was then modeled for comparison with the experimental results. The nonlinear, inhomogeneous heat equation with a Joule heating source term was solved for the nanopore geometry using the COMSOL MultiPhysics program (Comsol, Inc.) [22]. The temperature dependence of the heat capacity, thermal conductivity and density were taken to be those of superheated water at atmospheric pressure, given by the IAPWS-95 formulation [23–25]. The temperature dependence of the electrical conductivity of 3M NaCl solution at atmospheric pressure was chosen to fit the experimental results by extrapolating measured high temperature data taken at pressures above atmospheric [21, 26].
The resulting computed pore conductance curves are shown as the solid smooth curves in Fig. 2a. Excellent agreement has been achieved with the experimental data with reasonable temperature dependent properties of the solution. The predicted temperature attained at the pore center after 10 μs for each voltage pulse is indicated in the figure 2a for each conductance curve.
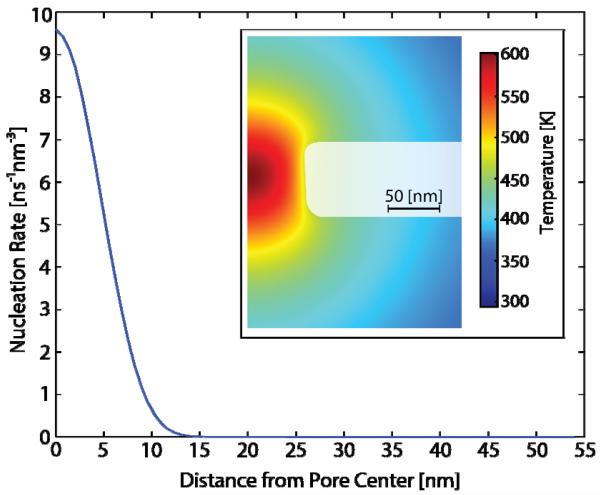
A contour plot of the temperature field within the nanopore at 10.4 μs is shown in the inset of Fig. 4 for 8.22 V applied across the 53.5 nm radius pore. The localization of the extreme superheating at the pore center is evident. The maximum temperature there is 600 K, and drops to 470 K at the pore wall. This maximum is about 5% greater than the experimentally measured limit of superheat of pure water [2]. The high concentration of NaCl in solution may contribute to this increase in a manner similar to boiling point elevation in electrolyte solutions [27]. The region of superheated liquid extends outward to 230 nm from the pore center. The thermally stored energy available for bubble formation and expansion in this superheated liquid immediately before nucleation is approximately 5 pJ, assuming a spherical temperature distribution. The upper limit for the radius of a spherical bubble corresponding to this energy is 620 nm, accounting for latent heat of vaporization and assuming no thermal losses due to diffusion. Similar results with regard to electrical conductance, temperature profile, and temperature at nucleation are obtained for the 1.9 μm radius pore.
FIG. 4.
(color). The nucleation rate as a function of distance from the center of the nanopore. This corresponds to the temperature computed for the 53.5 nm radius nanopore of Fig. 2 at 10.4 μs, just before bubble nucleation occurs. A contour plot of the temperature at this time is shown in the inset.
The magnitude of the localized temperature maximum calculated at the nanopore center dramatically increases the likelihood that a bubble will nucleate homogeneously there. This can be demonstrated using the nucleation rate, obtained from CNT [4], with surface tension of the liquid vapor interface taken to be that along the saturation curve [28]. In Fig. 4, we plot this nucleation rate within the 53.5 nm radius pore as a function of distance from the center. The rate is sharply peaked, supporting homogeneous single bubble nucleation at the pore center for this case.
The behavior of the relaxation oscillator (Fig. 2b) can be understood with a simple model of the heating and cooling dynamics. The initial 16 ns bubble event is taken to cut-off of the ionic current. During this event lifetime, the maximum temperature in the pore drops by about 200 K due to thermal diffusion. The time needed to reheat the pore center to 600 K once ionic current resumes is calculated to be approximately 120 ns. This corresponds well to the experimentally measured time to the second bubble of 117 ns. The dynamics of bubble growth in an unbounded, uniform temperature, superheated liquid have been well studied [29–31]. Inertial effects govern early growth driven by the high vapor pressure inside the bubble. We calculate an initial radial growth velocity of 126 m/s at 600 K, using the Rayleigh-Plesset theory [30], which applies to spherically symmetric, free expansion in an unconfined liquid. The presence of the pore walls will decrease the calculated growth speed. Nevertheless, the result corresponds reasonably well to the measured velocity (50m/sec) obtained from the optical probing data.
The inertial growth modeling does not include mass transfer at the boundary or heat transport effects. At high temperature, the surface tension is greatly diminished, decreasing its effect on early growth. The effects of heat transport are only manifest in later stages of bubble growth [29]. A comprehensive analysis of the bubble dynamics is as yet unavailable. The time evolution of heat transport and pressure in the bubble with a moving boundary are required to understand the dynamics of the bubble over its lifetime.
The preceding experimental and theoretical discussion provides strong evidence for extreme superheating, homogeneous nucleation, and growth of vapor bubbles consistent with the experimental conditions studied. Quantitative understanding of all the details is a challenge, in part because of lack of certain knowledge of many physical properties of strong electrolytes in superheated metastable states. The simple model we have used to explain the most elementary aspects of the phenomena must also be extended to more accurately and completely describe the electrical, optical and fluidic phenomena reported here. This will require more comprehensive multiphysics modeling. Given the potential electrical, chemical, optical, fluidic, and acoustic phenomena that may be excited and observed in the high field and extreme environment of a solid-state nanopore we believe that this new platform is certainly worth further attention.
Supplementary Material
Acknowledgments
G. Nagashima constructed and performed the experiments, and E. V. Levine provided the theoretical modeling as part of their PhD studies at Harvard University. Each contributed equally to the research reported in this letter. We thank R. D. Aubut and A. T. Kuan for technical assistance. This work was supported by the National Institutes of Health Award No. HG003703 to J. A.Golovchenko and D. Branton. E. V. Levine received support from the NSF-GRFP and the NDSEG fellowship programs.
REFERENCES
- [1].Li J, Stein D, McMullan C, Branton D, Aziz MJ, Golovchenko JA. Nature. 2001;412:166. doi: 10.1038/35084037. [DOI] [PubMed] [Google Scholar]
- [2].Caupin F, Herbert E. CR Phys. 2006;7:1000. [Google Scholar]
- [3].Avedisian CT. J. Phys. Chem. Ref. Data. 1985;14:695. [Google Scholar]
- [4].Blander M, Katz JL. AIChE J. 1975;21:833. [Google Scholar]
- [5].Debenedetti PG. Metastable Liquids: Concepts and Principles. Princeton University Press; Princeton: 1996. [Google Scholar]
- [6].Skripov VP. Metastable Liquids. Wiley; New York: 1974. [Google Scholar]
- [7].Oxtoby DW. J. Phys.- Condens. Mat. 1992;4:7627. [Google Scholar]
- [8].Shen VK, Debenedetti PG. J. Chem. Phys. 2003;118:768. [Google Scholar]
- [9].Talanquer V, Oxtoby DW. J. Chem. Phys. 2001;114:2793. [Google Scholar]
- [10].Wang Z-J, Valeriani C, Frenkel D. J. Phys. Chem. B. 2009;113:3776. doi: 10.1021/jp807727p. [DOI] [PubMed] [Google Scholar]
- [11].Li J, Cheng P. Int. J. Heat Mass Tran. 2004;47:2689. [Google Scholar]
- [12].Thome J. Int. J. Heat Fluid Fl. 2004;25:128. [Google Scholar]
- [13].Apfel RE. Nat. Phys. Sci. 1972;238:63. [Google Scholar]
- [14].Glod S, Poulikakos D, Zhao Z, Yadigaroglu G. Int. J. Heat Mass Tran. 2002;45:367. [Google Scholar]
- [15].Derewnicki K. Int. J. Heat Mass Tran. 1985;28:2085. [Google Scholar]
- [16].Ando K, Liu A, Ohl C. Phys. Rev. Lett. 2012;109:044501. doi: 10.1103/PhysRevLett.109.044501. [DOI] [PubMed] [Google Scholar]
- [17].Brenner MP, Hilgenfeldt S, Lohse D. Rev. Mod. Phys. 2002;74:425. [Google Scholar]
- [18].Putterman S, Weniger K. Annu. Rev. Fluid Mech. 2000;32:445. [Google Scholar]
- [19].Kotaidis A, Plech A. App. Phys. Lett. 2005;87:213102. [Google Scholar]
- [20].Medvedev RN, Chernov AA, Karpov DI. Int. J. Heat Mass Tran. 2013;64:743. [Google Scholar]
- [21].Quist AS, Marshall WL. J. Phys. Chem. 1968;72:684. [Google Scholar]
- [22].See Supplemental Material at [URL will be inserted by publisher] for calculation details.
- [23].Wagner W, Pruß A. J. Phys. Chem. Ref. Data. 2002;31:387. [Google Scholar]
- [24].Revised Release on the IAPWS Formulation 1995 for the Thermodynamic Properties of Ordinary Water Substance for General and Scientific Use. The International Association for the Properties of Water and Steam, Doorwerth; The Netherlands: Sep, 2009. http://www.iapws.org/relguide/IAPWS-95.html. [Google Scholar]
- [25].Release on the IAPWS Formulation 2011 for the Thermal Conductivity of Ordinary Water Substance. The International Association for the Properties of Water and Steam; Plzen, Czech Republic: Sep, 2011. pp. 1–15. http://www.iapws.org/relguide/ThCond.html. [Google Scholar]
- [26].Bannard J. J. Appl. Electrochem. 1975;5:43. [Google Scholar]
- [27].Driesner T, Heinrich CA. Geochim. Cosmochim. Acta. 2007;71:4880. [Google Scholar]
- [28].Lemmon EW, McLinden MO, Friend DG. In: NIST Chemistry WebBook, NIST Standard Reference Database Number 69. Linstrom PJ, Mallard WG, editors. National Institute of Standards and Technology; Gaithersburgh MD: retrieved March 2014, http://webbook.nist.gov. [Google Scholar]
- [29].Lee H, Merte H., Jr. Int. J. Heat Mass Tran. 1996;39:2427. [Google Scholar]
- [30].Prosperetti A, Plesset MS. J. Fluid Mech. 1978;85:349. [Google Scholar]
- [31].Brennen CE. Cavitation and Bubble Dynamics. Cambridge; New York: 2014. [Google Scholar]
Associated Data
This section collects any data citations, data availability statements, or supplementary materials included in this article.


