

Abstract
Objective
Direct neuronal loss or deafferentation of the putamen, a critical hub in corticostriatal circuits, may result in diverse and distinct cognitive and motoric dysfunction in neurodegenerative disease. Differential putaminal morphology, as a quantitative measure of corticostriatal integrity, may thus be evident in Huntington disease (HD), Alzheimer Disease (AD) and Frontotemporal Dementia (FTD), diseases with differential clinical dysfunction.
Method
HD (n=17), FTD (n=33) and AD (n=13) patients were diagnosed according to international consensus criteria, and with healthy controls (n=17), were scanned on the same MRI scanner. Patients underwent brief cognitive testing using the Neuropsychiatry unit cognitive assessment tool (NUCOG). Ten MRI scans from this dataset were manually segmented as a training set for the Adaboost algorithm, which automatically segmented all remaining scans for the putamen, yielding the following subset of the data: 9 left and 12 right putamen segmentations for AD; 25 left and 26 right putamina for FTD; 16 left and 15 right putamina for HD; 12 left and 12 right putamina for controls. Shape analysis was performed at each point on the surface of each structure using a multiple regression controlling for age and sex to compare radial distance across diagnostic groups.
Results
Age, but not sex and ICV, were significantly different in the segmentation subgroups by diagnosis. The AD group showed significantly poorer performance on cognitive testing than FTD. Mean putaminal volumes were HD<FTD<AD≤Controls, controlling for age and ICV. The greatest putaminal shape deflation was evident in HD, followed by FTD, in regions corresponding to the interconnections to motoric cortex.
Conclusions
Differential patterns of putaminal atrophy in HD, FTD and AD, with relevance to corticostriatal circuits, suggest the putamen may be a suitable clinical biomarker in neurodegenerative disease.
Keywords: neostriatum, putamen, dementia, MRI, morphometry
Introduction
There is burgeoning interest in neostriatal morphometry in neurodegenerative disease (Looi et al., 2012, Looi et al., 2008b, Looi et al., 2009a, Looi et al., 2010, Madsen et al., 2010, De Jong et al., 2011, Walterfang et al., 2011, Looi and Walterfang, 2012). The neostriatum comprises the caudate nucleus and putamen. Phylogenetically conserved, the neostriatum is a nexus in multiple parallel distributed neural circuits comprising fronto-striato-pallido-thalamo-cortical re-entrant loops, constituting a primary input region for information flow from the cortex (Alexander et al., 1986, Cummings, 1993, Bolam et al., 2000).
The neostriatum comprises 90-95% medium spiny projection neurons receiving afferents from cortical and mesencephalic regions, which function to transmit cortical inputs via direct and indirect pathways to output nuclei (Bolam et al., 2000). The likely effect of deafferentation from cortical neurons is reduction in size and/or number of interneurons, with consequent downstream effects on the efferent pathways and targets of the striatum via trans-synaptic neurodegeneration, which has been proposed as a mechanism of neurodegeneration in Alzheimer disease (AD) (Buren, 1963, Palop and Mucke, 2009). Trans-synaptic neurodegeneration is based on the premise that altered regulation of synaptic connections and activities, which may arise from deafferentation, results in the neuronal activity-dependent spread of neurodegenerative disease in vulnerable brain networks (Palop and Mucke, 2009), which may result in neuronal loss in the striatum. Altered dendritic morphology may also impact on striatal volume, and neuropathological studies have found deafferentation results in dendritic degeneration (Zaja-Milatovic et al., 2005, Zaja-Milatovic et al., 2006). The cortical projections to the neostriatum are highly specific and topographically organized (Haber, 2003, Draganski et al., 2008, Leh et al., 2007, Koziol and Budding, 2009). The putamen receives somatotopic projections from premotor, motor, somatosensory, supplementary motor cortex and frontal eye fields (Middleton and Strick, 2000, Haber, 2003, Utter and Basso, 2008, Draganski et al., 2008). Neurodegeneration of the putamen will therefore impact on motoric function.
We propose a typology of neostriatal morphologic change in neurodegenerative disease that corresponds to the clinical features of motoric dysfunction (Looi and Walterfang, 2012). The first category of disorders, with molecular neuropathology directly impacting upon the neostriatum, will demonstrate marked alterations in morphology and marked motoric dysfunction: Huntington disease (HD), choreacanthocytosis (ChAc) and progressive supranuclear palsy (PSP) (Douaud et al., 2006, Walterfang et al., 2011, Looi et al., 2011a). The intermediate category of disorders are those in which specific corticostriatal circuit dysfunction has been implicated, with intermediate motoric dysfunction, such as frontotemporal lobar degeneration (FTLD) (Looi et al., 2010, Looi et al., 2011c) and cerebrovascular disease (Looi et al., 2009b). In a third category of disorders, efferents to the neostriatum may be disconnected secondary to cortical atrophy as part of a generalized neurodegenerative disease with minimal motoric dysfunction, yet with evidence of neurodegeneration in the striatum, as in AD (Villemagne et al., 2009) and mild cognitive impairment (MCI) (Madsen et al., 2010, De Jong et al., 2011).
We sought to identify a gradient of neostriatal atrophy through automated morphometric mapping of putamen in persons with: HD, behavioral variant frontotemporal dementia (FTD), AD, and controls. We hypothesized there would be differential morphologic deformation, in accord with the putative involvement of the putamen in the neurodegenerative process, such that the degree of volume and shape change in HD > FTD > AD > Controls.
Methods
Subjects
All subjects and controls were recruited via the Neuropsychiatry Unit, Royal Melbourne Hospital, Melbourne, Australia. The Neuropsychiatry Unit is a tertiary referral diagnostic service to which patients suspected of a younger onset dementia are referred for diagnostic assessment. All patients receive a comprehensive clinical inpatient assessment, including a neuropsychiatric interview, neurological assessment, comprehensive file review, neuropsychological assessment, occupational therapy review and a psychosocial assessment. Patients underwent investigations depending on clinical need. Such investigations include biochemical, haematological, endocrine and autoimmune testing, with a proportion of patients undergoing a lumbar puncture. Patients diagnosed with a disease underwent clinical assessment with the Neuropsychiatry unit cognitive assessment tool (NUCOG), a brief cognitive screening tool for neuropsychiatric patients (Walterfang et al., 2006). All patients have an Magnetic Resonance Image (MRI) and Single-Photon Emission Computed Tomogram (SPECT) scan and the majority will have an electroencepehalogram (EEG). All patients diagnosed with HD have genetic verification of the diagnosis. The diagnostic criteria established by the National Institute of Neurological and Communicative Disorders and Stroke-Alzheimer's Disease and Related Disorders Association (NINCDS-ADRDA) (McKhann et al., 1984) and (McKhann et al., 2001) were used to diagnose Alzheimer's disease and FTD respectively. The MRI scans of control subjects were accessed through a database of control subjects within the Melbourne Neuropsychiatry Centre age-matched and from the same community as the patients. The project was approved by the local Research and Ethics Committee of the Royal Melbourne Hospital.
The cohort comprised 80 persons: 33 with FTD, 13 with AD, 17 with HD, and 17 healthy controls. All patients and controls were scanned on the same GE Signa 1.5T scanner (General Electric, Milwaukee WI, USA). A three-dimensional volumetric spoiled gradient recalled echo (SPGR) sequence generated 124 contiguous, 1.5 mm coronal slices. Imaging parameters were: time-to-echo, 3.3 msec; time-to-repetition, 14.3 msec; flip angle, 30°; matrix size, 256 × 256; field of view, 24 × 24 cm matrix; voxel dimensions, 0.938 × 0.938 × 1.5 mm. Head movement was minimised by foam padding and velcro straps across the forehead and chin. The scanner was calibrated fortnightly using a proprietary phantom to ensure that measurements were accurate and stable. Images were converted to isotropic voxel sizes for the manual segmentation.
Image analysis
Automated segmentation
We automatically extracted models of the putamen from each registered MRI scan, using an automated segmentation method based on adaptive boosting, which we developed and validated (Morra et al., 2008, Morra et al., 2009a, Morra et al., 2009b). Adaboost (Freund and Schapire, 1997) is a machine learning approach that learns to segment a structure automatically in new images based on a small training set of expertly delineated tracings. As in previous hippocampal studies (Morra et al., 2009a, Morra et al., 2009b), we created a small representative training set of 10 randomly selected MRI scans that were expertly manually-segmented for the putamen according to a validated protocol (Looi et al., 2008a, Looi et al., 2009a) using ANALYZE 10.0b running on a MacBook Pro (Apple Inc., Cupertino CA, USA). Intra and inter-rater reliability for the expert has been established at >0.90 in previous studies. These manual traces were then used to produce automated segmentations of the set of MRI scans from 17 HD, 33 FTD, 13 AD, and 17 healthy control subjects. Using image intensities and gradients in the training set scans, and statistical information on the likely position and geometry of the putamen, the algorithm learns a classification rule to designate each voxel as putamen or non-putamen. The automated segmentation incorporates ∼13,000 features including intensity, combinations of x, y, and z coordinates, and gray matter, white matter, and cerebrospinal fluid tissue classifications. Manually segmented images used in the training set (n=10) were included in subsequent analysis, in order to maximize power. We checked all segmentations manually to ensure correct classification and boundary delineation, excluding those that were of poor quality. We excluded segmentations that: truncated the structure; were poorly delineated, such as intruding into the ventricles; and which were fragmented. Left and right structures underwent quality assessment and analysis separately. Hence, the numbers analysed for right and left side are not exactly the same set of subjects.
Volumetric analysis
For each subject, we determined left and right putamen volumes from the automatically generated segmentations. From these, we calculated the mean volume and tested for group differences in putamen volume.
Statistical maps
Parametric surface models were created from all segmentations, which were then used to create statistical maps measuring local volumetric differences across the surface (Bansal et al., 2007, Csernansky et al., 1998, Styner et al., 2000, Thompson et al., 2004b, Wang et al., 2007). As shown in Figure 1, surface models were created from each subject's automatically generated binary segmentation (Thompson et al., 2004a). A central curve was calculated along the longitudinal axis of each model. The radial distance from each surface point to this medial line was used as a highly localized measure of atrophy. We have used the same radial distance mapping approach to map hippocampal, caudate and ventricular shape differences in over 30 papers (Thompson et al., 2004a, Morra et al., 2009a, Apostolova et al., 2010, Madsen et al., 2010).
Figure 1. Mapping Atrophy.
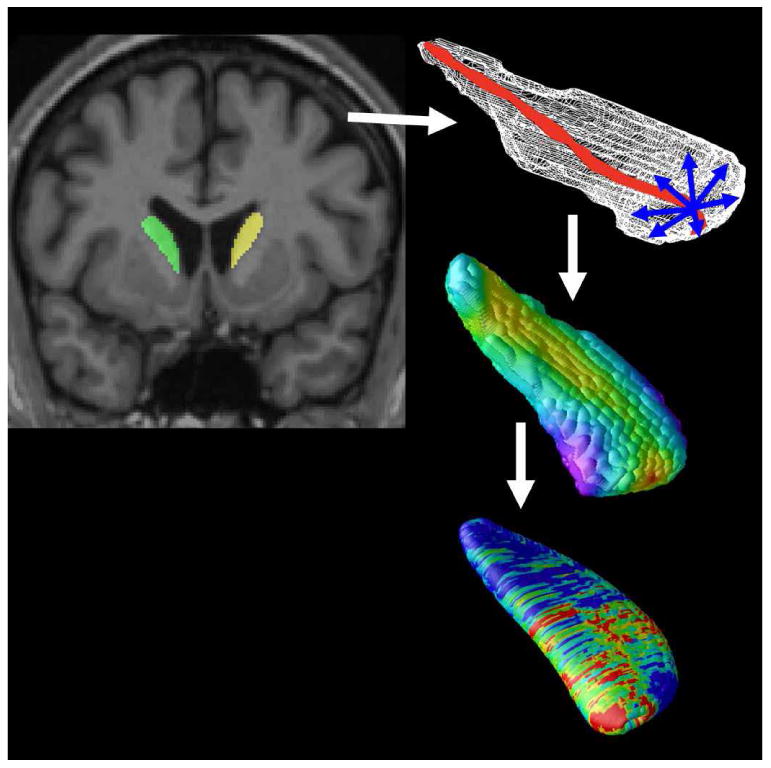
After image preprocessing, our Adaboost algorithm automatically segments the caudate nucleus and putamen bilaterally. A central curve (top right) was calculated through the longitudinal axis of each structure and the radial distance to each point in a 3D surface mesh was used as a highly localized measure of atrophy (middle right). P-values are calculated at each surface point (bottom right) showing the significance of differences in radial distances between diagnostic groups or their associations with clinical scores. These maps visualized the profile of local shape differences or their clinical correlates at a point-wise level.
Based on a computed point-wise correspondence of the structure surfaces across subjects, geometric surface averaging was performed across all subjects in each diagnostic group. At each surface point, age- and sex-adjusted (as covariates) multiple regressions were run to compare diagnostic groups as measured by differences in radial distance.
Color-coded P-values were mapped onto the average left and right putamen models. To correct for multiple comparisons across surface points, permutation tests provided an overall significance value for each statistical map. The supra-threshold area (points with P<0.05) in the map was compared to a null distribution for this same area, estimated from 10,000 random permutations of the covariates (Thompson et al., 2003).
Intracranial volume measurement
The intracranial volume (ICV) was determined in a semi-automated fashion using FSL software (FMRIB Group, Oxford) as a measure to control for brain size. First, brains were skull-stripped with the Brain Extraction Tool (BET) and were then linearly aligned to the MNI152 1mm T1-weighted template. The inverse of the determinant of the affine transformation matrix was multiplied by the ICV of the MNI152 template to produce a measure of ICV for use as a covariate (ENIGMA, 2011).
Statistical analysis
Statistical analysis was performed using SPSS 19.0 (IBM, New York, USA). Demographics were assessed using the Kruskal-Wallis test, and gender distribution assessed via a chi-squared analysis for the entire cohort, and each segmentation subgroup (putamen, right and left). Analysis of Variance (ANOVA) was used to compare disease groups (HD, FTD, AD) on illness duration and on the total and component subscales of the NUCOG (Walterfang et al., 2006). Analysis of co-variance (ANCOVA) was used to assess the significance of any differences in putamen volume. The volumetric analysis was performed using the volumes derived from the manual and automated segmentation, using the same groups as included in the shape analysis. We checked the assumptions of normality, linearity, homogeneity of variances/regression slopes and reliable measurements of covariates, prior to ANCOVA. Patient age and ICV were controlled for as covariates within these analyses. The significance level was set at <0.05.
Results
Automated segmentations (see Table 1)
Table 1. Demographics for automated segmentations by structure.
| Left putamen | ||||
|---|---|---|---|---|
| HD | FTD | AD | Controls | |
| N | 16 | 25 | 9 | 13 |
| Male: female | 11:5 | 13:12 | 3:6 | 10:3 |
| Age (SD) | 46.6 (4.7) | 51.8 (7.5) | 52.3 (7.1) | 46.6 (4.7) |
| ICV (SD) | 1490 (189) | 1478 (163) | 1410 (214) | 1512 (142) |
| Right putamen | ||||
|---|---|---|---|---|
| HD | FTD | AD | Controlss | |
| N | 15 | 26 | 12 | 12 |
| Male: female | 10:5 | 12:14 | 5:7 | 9:3 |
| Age (SD) | 45.0 (11.1) | 52.5 (8.4) | 52.5 (7.6) | 46.2 (4.7) |
| ICV (SD) | 1479 (195) | 1463 (176) | 1410 (214) | 1474 (157) |
Automated segmentation yielded lesser numbers of putamen volumes than for the whole cohort (Table 2) due to exclusion of some segmentations for truncation, displacement or fragmentation. Therefore, the numbers of segmentations for each analysis, by side, are displayed in Table 1.
Table 2. Demographics of entire cohort.
| Demographics of cohort | ||||
|---|---|---|---|---|
| HD | FTD | AD | Controls | |
| N | 17 | 33 | 13 | 17 |
| Male: female | 11:6 | 17:16 | 5:8 | 14:3 |
| Age (SD) | 46.8 (11.8) | 51.9 (8.2) | 52.5 (7.5) | 46.5 (4.8) |
| ICV (SD) | 1477 (190) | 1466 (187) | 1422 (186) | 1524 (158) |
N: number
Male: Female – gender ratio
SD: standard deviation
ICV: intracranial volume, mm3
Demographics (see Table 1-3)
Table 3. Clinical Characteristics of Disease Cohort.
| Diagnostic group | NUCOG_A | NUCOG_B | NUCOG_C | NUCOG_D | NUCOG_E | NUCOG_Total | Duration of illness (since first symptoms) | |
|---|---|---|---|---|---|---|---|---|
| FTD n= 33 | Mean | 14.3 | 16.7 | 12.5 | 10.7 | 17.8 | 71.8 | 29.5 |
| N | 26 | 26.0 | 26.0 | 26.0 | 26.0 | 26.0 | 35.0 | |
| Std. Deviation | 4.8 | 3.9 | 4.5 | 4.9 | 3.2 | 17.9 | 18.3 | |
| AD = 13 | Mean | 11.1 | 13.0 | 7.6 | 7.2 | 14.4 | 52.1 | 31.4 |
| N | 9 | 9.0 | 9.0 | 9.0 | 9.0 | 11.0 | 13.0 | |
| Std. Deviation | 5.7 | 5.3 | 3.9 | 5.7 | 4.5 | 21.1 | 13.9 | |
| HD = 17 | Mean | 14.6 | 16.2 | 12.1 | 12.3 | 17.2 | 72.2 | 40.8 |
| N | 9 | 9.0 | 9.0 | 9.0 | 9.0 | 9.0 | 18.0 | |
| Std. Deviation | 4.4 | 3.5 | 4.0 | 5.4 | 2.5 | 17.3 | 57.7 | |
FTD: Frontotemporal dementia
AD: Alzheimer's disease
HD: Huntington's disease
NUCOG: Brief cognitive screening tool for neuropsychiatric patients, A-E refer to subtests (Walterfang et al., 2006)
NUCOG_A: Attention
NUCOG_B: Visuoconstructional
NUCOG_C: Memory
NUCOG_D: Executive
NUCOG_E: Language
NUCOG_Total: Cognitive function – a measure of disease severity
Group differences were assessed with non-parametric tests. According to the Kruskal-Wallis test: age, but not ICV, was significantly different (P<0.05) across the entire cohort (Table 2), and in each subgroup of segmentation (Table 1). A chi-squared test for equal proportions of each sex in each diagnostic group revealed no significant differences (P<0.05) for all except the control group across the entire cohort (Table 2). However, the putamen subgroups (right and left) showed no significant differences for sex proportions (Table 1).
As the shape statistical analyses were already scaled to adjust for overall brain size we controlled for effects of age and sex. As the volumes of the striatum in disease groups were smaller than the controls, we have described most shape differences as shape deflation relative to controls. The subgroups for putamen segmentation represent subsets of the overall group, as in Table 1.
Clinical characteristics of disease groups (Table 3)
The characteristics were assessed via illness duration (since time of first symptoms) and the cognitive screening tool NUCOG (Walterfang et al., 2006). The NUCOG comprises subscales for cognitive domains and an overall total score (higher scores reflecting higher function), and was used as a measure of dementia severity for this study. Other than as below, there were no significant differences in NUCOG scores among the disease groups.
NUCOG total score
There was a statistically significant difference between groups as determined by one-way ANOVA (F(2,43) = 4.7, p = 0.014). Bonferroni post-hoc testing revealed AD patients scored lower than the FTD patients (P = 0.016).
NUCOG Memory (C)
There was a statistically significant difference between groups as determined by one-way ANOVA (F(3,53) = 4.5, P = 0.017). Bonferroni post-hoc testing revealed AD patients scored lower than the FTD patients (P=0.016)
NUCOG Language (E)
There was a statistically significant difference between groups as determined by one-way ANOVA (F(2,43) = 3.3, P = 0.047). Bonferroni post-hoc testing revealed AD patients scored lower than the FTD patients (P = 0.043).
Illness duration
There was no difference in illness duration (since first symptoms) between the dementia groups.
There was no difference in age, gender or duration of illness between the patients who underwent NUCOG testing and those who did not (comparisons made across all patients and within each diagnostic patient group). The table also indicates the numbers for which we had clinical data, and we acknowledge that some data is missing as a result of the limitation of collection of data, as some patients with such disease conditions may not complete testing.
Volumetry (See Table 4, and Figure 2)
Table 4. Volumetric analyses.
Estimated marginal means and post hoc pair-wise comparisons
| FTD | AD | HD | CTL | Pair-wise comparisons | |||||
|---|---|---|---|---|---|---|---|---|---|
|
| |||||||||
| n | Volume ± SD (mm3) | n | Volume ± SD (mm3) | n | Volume ± SD (mm3) | n | Volume ± SD (mm3) | ||
|
| |||||||||
| Left putamen | 25 | 3519 ± 511 | 9 | 3854 ± 525 | 16 | 2857 ± 578 | 12 | 3949 ± 524 | HD < CTL (p< 0.001) |
| HD < FTD (p< 0.001) | |||||||||
| HD < AD (p< 0.001) | |||||||||
| FTD < CTL (p= 0.026) | |||||||||
| FTD = AD (p=0.117) | |||||||||
| AD = CTL (p=0.692) | |||||||||
|
| |||||||||
| Right putamen | 26 | 2803 ± 768 | 12 | 2874 ± 753 | 15 | 2163 ± 493 | 12 | 3727 ± 720 | HD < CTL (p< 0.001) |
| HD < FTD (p= 0.011) | |||||||||
| HD < AD (p< 0.001) | |||||||||
| FTD < CTL (p= 0.001) | |||||||||
| FTD = AD (p=0.063) | |||||||||
| AD = CTL (p=0.133) | |||||||||
SD: Standard deviation, HD: Huntington's disease, CTL: Controls, FTD: Behavioral variant frontotemporal dementia, AD: Alzheimer's disease
Figure 2. Boxplots of putamen volume.

HD: Huntington's disease; FTD: Frontotemporal dementia; AD: Alzheimer's disease; CTL: Healthy controls. Outlier data points are referred to by case number, outliers defined if they extend more than 1.5 lengths from edge of box, extreme points indicated by an asterisk extend more than three box lengths from the edge of the box.
Statistical shape maps and plots
The numbers of segmentations for each analysis are displayed. For the segmented subset of the cohort (Table 1), a two-way ANOVA assessing the effect of sex revealed there were no significant sex differences in volumes, after controlling for ICV. We therefore controlled for age and ICV in the ANCOVA models.
Putamen by hemisphere
The left putamen was significantly smaller in the HD group, compared to FTD (P<0.001), AD (P<0.001), and controls (P<0.001). The FTD group was significantly smaller in left putamen (P=0.026) than controls and significantly larger (P<0.001) than in the HD group. The right putamen in HD was significantly smaller than FTD, AD and controls, all (P≤0.011). The right putamen in FTD was significantly smaller than in controls (P=0.001) and showed a trend toward being smaller than in AD (P=0.063). The boxplots show the relative differences in volume for putamen, such that HD < FTD < AD ≤ controls. These group differences are also reflected in the estimated marginal means for the lateralized volumes of putamen.
Statistical shape maps (Figures 3-6)
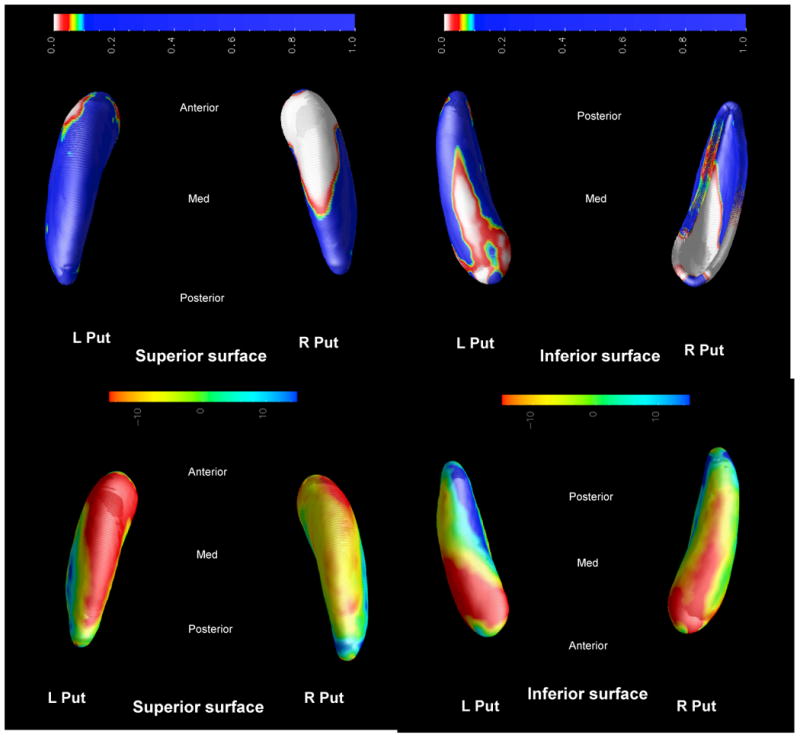
Figure 3. HD vs CTL.

Top: Group difference P-map
Bottom: Percentage difference map
Figure 6. FTD vs AD.

Top: Group difference P-map
Bottom: Percentage difference map
The statistical maps are displayed in two formats. Group difference P-maps show the surface of the object such that the color scale represents the P-value at each point on the surface. The Percentage maps display the degree of shape difference between groups as a percentage of the larger group's mean radial size. The color scale shows the percentage difference, with negative values representing atrophy.
In the maps displayed, the superior surface refers to the dorsal anatomical aspect, whilst the inferior surface refers to the ventral aspect. The medial aspect of right and left hemisphere models face each other, and the lateral aspect faces the outside of the image. For example, in Figure 3, the images are, clockwise from left: group difference P-map superior (dorsal) aspect of putamen, with the anterior (rostral) aspect towards the top of the image; group difference P-map inferior (ventral) aspect of putamen, with the rostral aspect towards the bottom of the image; percentage difference map ventral aspect of the putamen, with the rostral aspect towards the bottom of the image; percentage difference map dorsal aspect of the putamen, with the rostral aspect towards the top of the image.
HD: Huntington's disease; FTD: Frontotemporal dementia; AD: Alzheimer's disease; CTL: Healthy controls
R:right
L:left
Put: putamen
Anterior: anterior (rostral) end
Posterior: posterior (caudal) end
Med: medial aspect
Overall P-value significance per average structure (putamen) surface (superior or dorsal, inferior or ventral) is summarised in Table 5. We use permutation tests to correct for multiple comparisons across all the surface points for each statistical map (top and bottom surface of the putamen model). We measure the distribution of features in statistical maps that would be observed by accident if the subjects were randomly assigned to covariates 10,000 times. A ratio is computed describing what fraction of the time an effect of similar or greater magnitude to the real effect occurs in the random assignments. This fraction obtained is the chance of the observed pattern occurring by accident. Thus the P-value represents the overall significance P-value of the permutation tests corrected for multiple comparisons where a value < 0.05 represents a significant result. Detailed descriptions of the significant surface maps follow below.
Table 5. Overall radial distance P-values across surface.
| Surface P-Value | HDvCTL | FTDvCTL | ADvCTL | FTDvHD | FTDvAD |
|---|---|---|---|---|---|
| left putamen inferior | 0.0097* | 0.0262* | 0.8062 | 0.1245 | 0.5677 |
| left putamen superior | 0.0010* | 0.1606 | 0.7516 | 0.0148* | 0.3683 |
| right putamen inferior | 0.0019* | 0.0049* | 0.2180 | 0.1505 | 0.1701 |
| right putamen superior | 0.0016* | 0.0033* | 0.1982 | 0.1836 | 0.0193* |
Legend: Inferior or ventral surface of caudate; Superior or dorsal surface of caudate; Vs: versus; HD: Huntington's disease; FTD: frontotemporal dementia; AD: Alzheimer's disease; CTL: controls;
P<0.05
Disease group – control comparisons
For clarity in describing the putamen in these results – we will refer to the anterior and posterior of these structures rather than using the conventional terms rostral and caudal, while retaining superior/inferior and lateral/medial descriptors.
HD versus controls (Figure 3)
The putamina display more marked bilateral atrophy comprising most of the head and body and shape deflation is > 10%. The neostriatum is significantly atrophic in HD compared to controls. There is a general pattern of greater medial than lateral (medial-lateral), and greater anterior than posterior (anterior-posterior), atrophy.
FTD versus controls (Figure 4)
Figure 4. HD vs CTL.
Top: Group difference P-map
Bottom: Percentage difference map
Putamina in FTD display bilateral atrophy of the head and body. This shape deflation is >10% and the right is more affected than the left. There is a general pattern of medial-lateral and anterior-posterior atrophy.
Between disease group comparisons
HD versus FTD (Figure 5)
Figure 5. HD vs FTD.

Top: Group difference P-map
Bottom: Percentage difference map
The HD group displays mainly right putaminal atrophy in the superior aspect of the putamen, > 10% smaller than the FTD group along much of the body and tail.
FTD versus AD (Figure 6)
For FTD compared to AD, there is bilateral atrophy of the putaminal body and tail in the inferior aspect of the putamen, showing > 10% shape deflation of FTD.
Discussion
We have demonstrated there is differential atrophy in the putamen, such that HD displays the greatest, FTD intermediate, and AD, no atrophy, in comparison to controls. This atrophy occurs in a gradient consistent with the degree of motoric dysfunction in these diseases. These changes may arise from one of three mechanisms: deafferentation from cortical or subcortical inputs, direct neostriatal cell loss, and disconnection of outputs to distal regions.
Volumetry
Putaminal volumes were significantly different across the entire group, in the order of smallest to largest volume: HD < FTD < AD ≤ controls (Fig. 2). The estimated marginal means show that bilateral putamen in HD was 65% of control volume, FTD was 82% of control volume, and AD was 87% control volume [Table 4]. Post hoc between-group analyses revealed significant differences: HD<Controls; HD < FTD; HD < AD; and FTD < controls. Thus, volumetry was partially supportive of our hypotheses.
Shape analyses
HD
In HD, early and significant caudate and putaminal atrophy is evident in vivo, arising from specific neuropathology in these structures (Aylward et al., 2004, Douaud et al., 2006, Paulsen et al., 2010, Tabrizi et al., 2011). Marked striatal neuronal death has been observed, resulting in the loss of nearly all the medium spiny projection neurons (Bolam et al., 2000) with relative sparing of larger interneurons (Halliday et al., 1998, Vonsattel, 2008 , Ross and Tabrizi, 2011).
The extensive inward shape deformation of the head and body of the putamen, signifying atrophy, may result in, or reflect, deafferentation or disconnection of prefrontal, premotor, motor, somatosensory, posterior parietal cortex, and frontal eye fields. These changes are consistent with generalized dorsal to ventral patterns of atrophy in the caudate previously demonstrated in HD by (Douaud et al., 2006). The lateral-medial gradient of atrophy we observed previously in FTLD (Looi et al., 2011c, Looi et al., 2010), related to proximity to the subventricular neurogenic zone (Mazurova et al., 2006, Curtis et al., 2007), is reversed here. This may arise from deafferentation due to specific regional cortical atrophy and white matter disease in pre-manifest HD (Tabrizi et al., 2011). Others (van den Bogaard et al., 2011) have also demonstrated shape deformation of the striatum in HD using a fully-automated shape analysis method, and in their results we noted a lateral-medial pattern of atrophy, as well as an anterior-posterior pattern of atrophy in manifest HD, with mild changes in pre-manifest HD.
Compared to FTD, the HD group (Figure 5) showed marginally more putaminal shape deflation, primarily in the right putamen.
FTD
Deafferentation processes may predominate in the impact of FTD on the neostriatum, but there is also evidence of neuropathology in the striatum. In FTLD-related tauopathies and associated FTLD subtypes tau accumulation is prominent in striatal regions (Macedo et al., 2009, Neumann et al., 2009).
We have confirmed previous findings of putaminal atrophy in patients in FTD (Looi et al., 2010, Looi et al., 2011c). Other studies have also noted striatal atrophy in vivo in FTD (Rabinovici et al., 2007, Chow et al., 2008, Seeley et al., 2009, Garibotto et al., 2011). Whitwell et al. (Whitwell et al., 2009a, Whitwell et al., 2009b) studied “subtypes” of FTD using VBM, and classified subjects into four groups based on gross relative lobar atrophy: the “frontotemporal” subgroup of FTD displayed putaminal atrophy.
Atrophy of the head and body of the putamen in FTD (Figure 4) may reflect deafferentation of prefrontal cortex, premotor, motor cortex and frontal eye fields. These findings concur with our previous study of FTLD subtypes (Looi et al., 2011c).
Patients with FTD showed greater anterior-to-posterior atrophy of the putamen, similar to HD, possibly related to specific deafferentation. This contrasts with the posterior-anterior gradient of atrophy we had noted in our previous study (Looi et al., 2010) ascribed to relative distance from the neurogenic center in the nucleus accumbens shell (Heimer and Van Hoesen, 2006), that may partly be due to a different methodology, MRI scanner and population in this study.
Compared to AD, the FTD group shows bilateral atrophy of the putaminal body and tail with > 10% reduction in radial size (Figure 6). Thus striatal involvement may be more widespread in FTD than AD, and accords with our previous morphometric analysis for FTLD (Looi et al., 2011c, Looi et al., 2010). This pattern may be due to lateralized cortical deafferentation inherent in the clinical syndrome of FTD.
AD
In AD, temporal lobe and generalized cortical atrophy may result in deafferentation of the neostriatum. Cortical atrophy in AD comprises two spatio-temporal gradients, left hemisphere before right, and temporal-frontal-sensorimotor progression (Thompson et al., 2003). Amyloid deposition is prominent in the striatum (Braak and Braak, 1990) in sporadic (Nelissen et al., 2009) and, autosomal dominant AD (Villemagne et al., 2009). Although neostriatal atrophy from indirect deafferentation in AD was posited, we found no significant atrophy in the putamen compared to controls in shape or volume analysis, despite the AD group having greater dementia severity as measured by NUCOG. This contrasts with other studies (de Jong et al., 2008) which found putaminal atrophy in AD compared to controls. It may be that the small sample size in our study limited our ability to detect the relatively limited change in putaminal volume in AD.
Limitations
This study was based upon clinically diagnosed subjects and controls, apart from the HD group which had genetic confirmation of diagnosis, without neuropathological confirmation of diagnosis. As a clinical sample, there are considerable variations in demographic data such as age, sex and ICV, for which we have made adjustments in the analyses. Adjustment for NUCOG scores was not necessary, as the poorer performance of the AD group compared to FTD on the NUCOG indicates the AD group may have greater dementia severity, and since more advanced AD is likely to show greater striatal atrophy, this is likely to minimise differences in morphology between the groups. Patients with behavioural, psychiatric or cognitive issues may not complete all of cognitive testing or assessments such as the NUCOG and we acknowledge there is missing data. While clinicopathological-neuro-imaging correlations would be ideal, such studies are logistically difficult to conduct in sufficient numbers of well-characterized clinical samples. We used a combination of manual and machine-learning automated segmentation (based on the expert manual segmentation). The manual segmentation was performed by an experienced researcher with reliability above 0.90 (Looi et al., 2009a, Looi et al., 2011a). There are small numbers in some subset groups for which automated segmentation was not successful, due to the difficulties in automated segmentation of some of the MRI data; however, the radial distance mapping statistical methods are robust in studies this size. We have not specifically adjusted for multiple comparisons across all diagnostic pairings, on the basis that our study was intended to explore the hypotheses and a heavy adjustment may be overly conservative. We did not analyse the caudate using these methods due to difficulties experienced with its more complex shape, which significantly affected the efficiency of automated segmentation, thus we are using other methods to segment the caudate in a separate study. Such cross-sectional studies do not yet resolve the issue of causality in relation the role of the neostriatum as a biomarker, which will require longitudinal studies. Focusing on the typology of cortico-striatal neuroanatomical between-group comparisons, we have not attempted correlations with clinical data such as cognitive testing, disease duration, and neuropsychiatric measures, as we hope to do in future studies.
Clinical implications
These results support a putaminal structural basis for corticostriatal circuit disruption, through deafferentation and/or direct neuronal loss, in a gradient: greatest in HD, intermediate in FTD, and no difference in AD, compared to controls. The shape deflation of the putamina indicate that corticostriatal circuits involving the premotor, motor, somatosensory, supplementary motor and frontal eye fields may be affected, resulting in motor and sensory dysfunction. These clinical features manifest in a gradient similar to the pattern of neostriatal structural change, and may be based on corticostriatal circuit dysfunction, such that: HD is clinically characterized by cognitive, psychiatric and marked motoric dysfunction; FTD, cognitive and psychiatric disorders, with some motoric dysfunction; AD, cognitive, to a lesser extent, psychiatric disorders, and minimal motoric dysfunction. However, there is not a direct 1:1 correspondence between cortical atrophy and striatal atrophy, due to the marked convergence of cortical inputs to the striatum, and accordingly, these gradients may be less distinct, particularly in view of our small sample size.
Conclusions
Morphologic change in HD > FTD > AD ≥ controls, partially supports our proposed typology of neurodegenerative brain disease affecting the neostriatum. At the putaminal level, FTD more resembles HD than AD, suggesting commonality in the putative disconnection of frontostriatal circuitry and resultant clinical features. We found no evidence of putaminal atrophy in AD, despite putative deafferentation of parietal and temporal cortical regions, and previous evidence of neostriatal shape change (Looi et al., 2011b, De Jong et al., 2011). As our data are limited to behavioural variant frontotemporal dementia (FTD) and early AD, these results are specific to those syndromes, and require replication in broader FTLD and AD groups for further understanding of subtype differences. Radial distance statistical shape mapping of the regionally specific surface anatomy of the putamen is possible across HD, FTD and AD, with results generally corresponding to those of spherical harmonic shape analysis (Looi et al., 2010, Looi et al., 2011c). For the putamen, such mapping yields information about deafferentation-based etiopathology because of its role in corticostriatal circuits (Looi and Walterfang, 2012). In future studies we plan to correlate measurements of cortico-striatally-mediated cognitive (such as executive) and motor function with putaminal shape measures to further test these observations. As a palimpsest map to chart the depredations of disease, the shape and form of the putamen may be a navigable biomarker of neurodegenerative brain disease.
Footnotes
Author contributions: JCLL conceived/designed, coordinated, performed manual segmentation and statistical analysis, wrote the first draft of the paper, and is guarantor of the study. On the basis of their respective contributions, JCLL and PR assert they are equal-first co-authors. PR performed the automated segmentation and radial distance mapping with SKM and CC under supervision of PMT, the principal investigator from LONI, the UCLA School of Medicine. MW performed the automated ICV measurements, assessed and recruited participants. MM performed manual segmentation measurements. PC assessed and recruited participants. DV assessed and recruited participants; established and prepared the database of images; and is the principal investigator from Melbourne Neuropsychiatry Centre. All authors contributed intellectually to, and were involved in, the writing of the paper.
References
- Alexander GE, Delong MR, Strick PL. Parallel organisation of functionally segregated circuits linking basal ganglia and cortex. Ann Rev Neurosci. 1986;9:357–381. doi: 10.1146/annurev.ne.09.030186.002041. [DOI] [PubMed] [Google Scholar]
- Apostolova LG, Mosconi L, Thompson PM, Green AE, Hwang KS, Ramirez A, Mistur R, Tsui WH, de Leon MJ. Subregional hippocampal atrophy predicts Alzheimer's dementia in the cognitively normal. Neurobiology of Aging. 2010;31:1077–1088. doi: 10.1016/j.neurobiolaging.2008.08.008. [DOI] [PMC free article] [PubMed] [Google Scholar]
- Aylward E, Sparks BF, Field KM, Yallapragada V, Shpritz BD, Rosenblatt A, Brandt J, Gourley LM, Liang K, Zhou H, Margolis RL, Ross CA. Onset and rate of striatal atrophy in preclinical Huntington disease. Neurology. 2004;63:66–72. doi: 10.1212/01.wnl.0000132965.14653.d1. [DOI] [PubMed] [Google Scholar]
- Bansal R, Staib LH, Xu D, Zhu H, Peterson BS. Statistical analyses of brain surfaces using Gaussian random fields on 2-D manifolds. IEEE Trans Med Imaging. 2007;26:46–57. doi: 10.1109/TMI.2006.884187. [DOI] [PMC free article] [PubMed] [Google Scholar]
- Bolam JP, Hanley JJ, Booth PAC, Bevan MD. Synaptic organisation of the basal ganglia. Journal of Anatomy. 2000;196:527–542. doi: 10.1046/j.1469-7580.2000.19640527.x. [DOI] [PMC free article] [PubMed] [Google Scholar]
- Braak H, Braak E. Alzheimer's disease, striatal amyloid deposits and neurofibrillary tangles. Journal of Neuropatholology and Experimental Neurology. 1990;49:215–225. [PubMed] [Google Scholar]
- Buren JMV. Trans-synaptic retrograde degeneration in the visual system of primates. Journal of Neurology, Neurosurgery and Psychiatry. 1963;26:402–409. doi: 10.1136/jnnp.26.5.402. [DOI] [PMC free article] [PubMed] [Google Scholar]
- Chow TW, Izenberg A, Binns MA, Freedman M, Stuss DT, Scott CJM, Ramirez J, Black SE. Magnetic Resonance Imaging in Frontotemporal Dementia Shows Subcortical Atrophy. Dementia and Geriatric Cognitive Disorders. 2008;26:79–88. doi: 10.1159/000144028. [DOI] [PubMed] [Google Scholar]
- Csernansky JG, Joshi S, Wang L, Haller JW, Gado M, Miller JP, Grenander U, Miller MI. Hippocampal morphometry in schizophrenia by high dimensional brain mapping. Proc Natl Acad Sci U S A. 1998;95:11406–11411. doi: 10.1073/pnas.95.19.11406. [DOI] [PMC free article] [PubMed] [Google Scholar]
- Cummings JL. Frontal subcortical circuits and human behaviour. Archives of Neurology. 1993;5:873–880. doi: 10.1001/archneur.1993.00540080076020. [DOI] [PubMed] [Google Scholar]
- Curtis MA, Faull RLM, Eriksson PS. The effect of neurodegenerative diseases on the subventricular zone. Nature Reviews Neuroscience. 2007;8:712–723. doi: 10.1038/nrn2216. [DOI] [PubMed] [Google Scholar]
- De Jong LW, Ferrarini L, Van der Grond J, Milles J, Reiber JHC, Westendorp RGJ, Bollen ELEM, Middelkoop HAM, Van Buchem MA. Shape abnormalities of the striatum in Alzheimer's disease. Journal of Alzheimer's Disease. 2011;23:49–59. doi: 10.3233/JAD-2010-101026. [DOI] [PubMed] [Google Scholar]
- de Jong LW, van der Hiele K, Veer IM, Houwing JJ, Westendorp RGJ, Bollen ELEM, de Bruin PW, Middelkoop HAM, van Buchem MA, van der Grond J. Strongly reduced volumes of putamen and thalamus in Alzheimer's disease: an MRI study. Brain. 2008;131:3277–3285. doi: 10.1093/brain/awn278. [DOI] [PMC free article] [PubMed] [Google Scholar]
- Douaud G, Gaura V, Ribeiro MJ, Lethimonnier F, Maroy R, Verny C, Krystkowiak P, Damier P, Bachoud-Levi AC, Hantraye P, Remy P. Distribution of grey matter atrophy in Huntington's disease patients: A combined ROI-based and voxel-based morphometric study. Neuroimage. 2006;32:1562–1575. doi: 10.1016/j.neuroimage.2006.05.057. [DOI] [PubMed] [Google Scholar]
- Draganski B, Kherif F, Kloppel S, Cook PA, Alexander DC, Parker GJM, Deichmann R, Ashburner J, Frackowiak RSJ. Evidence for Segregated and Integrative Connectivity Patterns in the Human Basal Ganglia. Journal of Neuroscience. 2008;28:7143–7152. doi: 10.1523/JNEUROSCI.1486-08.2008. [DOI] [PMC free article] [PubMed] [Google Scholar]
- ENIGMA. Genome-Wide Association Meta-Analysis of Hippocampal Volume via the ENIGMA Consortium. Organisation for Human Brain Mapping Annual Meeting, Quebec City, Quebec 2011 [Google Scholar]
- Freund Y, Schapire RE. A decision-theoretic generalization of online-learning and an application to boosting. Journal of Computer Systems and Sciences. 1997;55:119–139. [Google Scholar]
- Garibotto V, Borroni B, Agosti C, Premi E, Alberici A, Eickhoff SB, Brambati SM, Bellelli G, Gasparotti R, Perani D, Padovani A. Subcortical and deep cortical atrophy in Frontotemporal Lobar Degeneration. Neurobiology of Aging. 2011;32:875–884. doi: 10.1016/j.neurobiolaging.2009.05.004. [DOI] [PubMed] [Google Scholar]
- Haber S. The primate basal ganglia: parallel and integrative networks. Journal of Chemical Neuroanatomy. 2003;26:317–330. doi: 10.1016/j.jchemneu.2003.10.003. [DOI] [PubMed] [Google Scholar]
- Halliday GM, McRitchie DA, Macdonald V, Double KL, Trent RJ, McKusker E. Regional specificity of brain atrophy in Huntington's disease. Experimental Neurology. 1998;154:663–672. doi: 10.1006/exnr.1998.6919. [DOI] [PubMed] [Google Scholar]
- Heimer L, Van Hoesen GW. The limbic lobe and its output channels: Implications for emotional functions and adaptive behavior. Neuroscience and Biobehavioral Reviews. 2006;30:126–147. doi: 10.1016/j.neubiorev.2005.06.006. [DOI] [PubMed] [Google Scholar]
- Koziol LF, Budding DE. Subcortical structures and cognition. New York, NY, USA: Springer; 2009. [Google Scholar]
- Leh S, Ptito A, Chakravarty M, Strafella A. Fronto-striatal connections in the human brain: A probabilistic diffusion tractography study. Neuroscience Letters. 2007;419:113–118. doi: 10.1016/j.neulet.2007.04.049. [DOI] [PMC free article] [PubMed] [Google Scholar]
- Looi J, Lindberg O, Liberg B, Tatham V, Kumar R, Maller J, Millard E, Sachdev P, Hogberg G, Pagani M. Volumetrics of the caudate nucleus: Reliability and validity of a new manual tracing protocol. Psychiatry Research: Neuroimaging. 2008a;163:279–288. doi: 10.1016/j.pscychresns.2007.07.005. [DOI] [PubMed] [Google Scholar]
- Looi JCL, Lindberg O, Zandbelt BB, Ostberg P, Andersen C, Botes L, Svensson L, Wahlund LO. Caudate Nucleus Volumes in Frontotemporal Lobar Degeneration: Differential Atrophy in Subtypes. American Journal of Neuroradiology. 2008b;29:1537–1543. doi: 10.3174/ajnr.A1168. [DOI] [PMC free article] [PubMed] [Google Scholar]
- Looi JCL, Macfarlane MD, Walterfang M, Styner M, Velakoulis D, Latt J, van Westen D, Nilssen C. Morphometric analysis of subcortical structures in progressive supranuclear palsy: in vivo evidence of neostriatal and mesencephalic atrophy. Psychiatry Research: Neuroimaging. 2011a;194:163–175. doi: 10.1016/j.pscychresns.2011.07.013. [DOI] [PMC free article] [PubMed] [Google Scholar]
- Looi JCL, Rajagopalan P, Walterfang M, Madsen SK, Thompson PM, Chua P, Velakoulis D. Altered striatal morphology in Huntington's disease, Frontotemporal dementia & Alzheimer's disease. 17th Annual Meeting of the Organization on Human Brain Mapping; Quebec City, Quebec, Canada. 2011b. [Google Scholar]
- Looi JCL, Svensson L, Lindberg O, Zandbelt BB, Ostberg P, Orndahl E, Wahlund LO. Putaminal Volume in Frontotemporal Lobar Degeneration and Alzheimer Disease: Differential Volumes in Dementia Subtypes and Controls. American Journal of Neuroradiology. 2009a;30:1552–1560. doi: 10.3174/ajnr.A1640. [DOI] [PMC free article] [PubMed] [Google Scholar]
- Looi JCL, Tatham V, Kumar R, Maller JJ, Millard E, Wen W, Chen X, Brodaty H, Sachdev P. Caudate nucleus volumes in stroke and vascular dementia. Psychiatry Research: Neuroimaging. 2009b;174:67–75. doi: 10.1016/j.pscychresns.2009.04.002. [DOI] [PubMed] [Google Scholar]
- Looi JCL, Walterfang M. Striatal morphology as a biomarker in neurodegenerative disease. Molecular Psychiatry. 2012 doi: 10.1038/mp.2012.54. [DOI] [PubMed] [Google Scholar]
- Looi JCL, Walterfang M, Styner M, Niethammer M, Svensson LA, Lindberg O, Östberg P, Botes L, Örndahl E, Chua P. Shape analysis of the neostriatum in subtypes of frontotemporal lobar degeneration: Neuroanatomically significant regional morphologic change. Psychiatry Research: Neuroimaging. 2011c;191:98–111. doi: 10.1016/j.pscychresns.2010.09.014. [DOI] [PubMed] [Google Scholar]
- Looi JCL, Walterfang M, Styner M, Svensson L, Lindberg O, Östberg P, Botes L, Örndahl E, Chua P, Kumar R, Velakoulis D, Wahlund LO. Shape analysis of the neostriatum in frontotemporal lobar degeneration, Alzheimer's disease, and controls. Neuroimage. 2010;51:970–986. doi: 10.1016/j.neuroimage.2010.02.017. [DOI] [PubMed] [Google Scholar]
- Looi JCL, Walterfang M, Velakoulis D, Macfarlane MD, Svensson L, Wahlund LO. Frontotemporal Dementia as a frontostriatal disorder: neostriatal morphology as a biomarker and structural basis for an endophenotype. Australian and New Zealand Journal of Psychiatry. 2012 doi: 10.1177/0004867411432076. [DOI] [PubMed] [Google Scholar]
- Macedo MN, Kim EJ, Seeley WW. Neuropathology of dementia. In: Miller BL, Boeve BF, editors. The behavioral neurology of dementia. Cambridge, UK: Cambridge University Press; 2009. pp. 142–160. [Google Scholar]
- Madsen SK, Ho AJ, Hua X, Saharan PS, Toga AW, Jack CR, Jr, Weiner MW, Thompson PM. 3D maps localize caudate nucleus atrophy in 400 Alzheimer's disease, mild cognitive impairment, and healthy elderly subjects. Neurobiology of Aging. 2010;31:1312–1325. doi: 10.1016/j.neurobiolaging.2010.05.002. [DOI] [PMC free article] [PubMed] [Google Scholar]
- Mazurova Y, Rudolf E, Latr I, Osterreicher J. Proliferation and differentiation of adult endogenous neural stem cells in response to neurodegenerative process within the striatum. Neurodegenerative Diseases. 2006;3:12–18. doi: 10.1159/000092087. [DOI] [PubMed] [Google Scholar]
- McKhann G, Drachman DA, Folstein M, Katzman R, Price DL, Stadlan EM. Clinical diagnosis of Alzheimer's disease—report of the NINCDS–ADRDA work group under the auspices of Department of Health and Human Services Task Force on Alzheimer's disease. Neurology. 1984;34:939–944. doi: 10.1212/wnl.34.7.939. [DOI] [PubMed] [Google Scholar]
- McKhann GM, Albert MS, Grossman M, Miller BL, Dickson DW, Trojanowski JQ. Clinical and pathological diagnosis of frontotemporal dementia. Archives of Neurology. 2001;53:1803–1809. doi: 10.1001/archneur.58.11.1803. [DOI] [PubMed] [Google Scholar]
- Middleton FA, Strick PL. Basal ganglia and cerebellar loops: motor and cognitive circuits. Brain Research Bulletin. 2000;31:236–250. doi: 10.1016/s0165-0173(99)00040-5. [DOI] [PubMed] [Google Scholar]
- Morra JH, Tu Z, Apostolova LG, Green AE, Avedissian C, Madsen SK, Parikshak N, Hua X, Toga AW, Jack CR, Schuff N, Weiner MW, Thompson PM. Automated 3D mapping of hippocampal atrophy and its clinical correlates in 400 subjects with Alzheimer's disease, mild cognitive impairment, and elderly controls. Human Brain Mapping. 2009a;30:2766–2788. doi: 10.1002/hbm.20708. [DOI] [PMC free article] [PubMed] [Google Scholar]
- Morra JH, Tu Z, Apostolova LG, Green AE, Avedissian C, Madsen SK, Parikshak N, Hua X, Toga AW, Jack CR, Weiner MW, Thompson PM. Validation of a fully automated 3D hippocampal segmentation method using subjects with Alzheimer's disease mild cognitive impairment, and elderly controls. Neuroimage. 2008;43:59–68. doi: 10.1016/j.neuroimage.2008.07.003. [DOI] [PMC free article] [PubMed] [Google Scholar]
- Morra JH, Tu Z, Apostolova LG, Green AE, Avedissian C, Madsen SK, Parikshak N, Toga AW, Jack CR, Schuff N, Weiner MW, Thompson PM. Automated mapping of hippocampal atrophy in 1-year repeat MRI data from 490 subjects with Alzheimer's disease, mild cognitive impairment, and elderly controls. Neuroimage. 2009b;45:S3–S15. doi: 10.1016/j.neuroimage.2008.10.043. [DOI] [PMC free article] [PubMed] [Google Scholar]
- Nelissen N, Van Laere K, Thurfjell L, Owenius R, Vandenbulcke M, Koole M, Bormans G, Brooks DJ, Vandenberghe R. Phase 1 Study of the Pittsburgh Compound B Derivative 18F-Flutemetamol in Healthy Volunteers and Patients with Probable Alzheimer Disease. Journal of Nuclear Medicine. 2009;50:1251–1259. doi: 10.2967/jnumed.109.063305. [DOI] [PubMed] [Google Scholar]
- Neumann M, Tolnay M, Mackenzie IRA. The molecular basis of frontotemporal dementia. Expert Reviews in Molecular Medicine. 2009;11 doi: 10.1017/S1462399409001136. [DOI] [PubMed] [Google Scholar]
- Palop JJ, Mucke L. Synaptic Depression and Aberrant Excitatory Network Activity in Alzheimer's Disease: Two Faces of the Same Coin? NeuroMolecular Medicine. 2009;12:48–55. doi: 10.1007/s12017-009-8097-7. [DOI] [PMC free article] [PubMed] [Google Scholar]
- Paulsen JS, Nopoulos PC, Aylward E, Ross CA, Johnson H, Magnotta VA, Juhl A, Pierson RK, Mills J, Langbehn D. Striatal and white matter predictors of estimated diagnosis for Huntington disease. Brain Research Bulletin. 2010;82:201–207. doi: 10.1016/j.brainresbull.2010.04.003. [DOI] [PMC free article] [PubMed] [Google Scholar]
- Rabinovici GD, Seeley WW, Kim EJ, Gorno-Tempini ML, Rascovsky K, Pagliaro TA, Allison SC, Halabi BS, Kramer JH, Johnson JK, Weiner MW, Forman MS, Trojanowski JQ, DeArmond SJ, Miller BL, Rosen HJ. Distinct MRI atrophy patterns in autopsy-proven Alzheimer's disease and frontotemporal lobar degeneration. American Journal of Alzheimer's Disease and other Dementias. 2007;22:474–478. doi: 10.1177/1533317507308779. [DOI] [PMC free article] [PubMed] [Google Scholar]
- Ross CA, Tabrizi SJ. Huntington's disease: from molecular pathogenesis to clinical treatment. The Lancet Neurology. 2011;10:83–98. doi: 10.1016/S1474-4422(10)70245-3. [DOI] [PubMed] [Google Scholar]
- Seeley WW, Crawford RK, Zhou J, Miller BL, Greicius MD. Neurodegenerative Diseases Target Large-Scale Human Brain Networks. Neuron. 2009;62:42–52. doi: 10.1016/j.neuron.2009.03.024. [DOI] [PMC free article] [PubMed] [Google Scholar]
- Styner M, Brechbuhler C, Szekely G, Gerig G. Parametric estimate of intensity inhomogeneities applied to MRI. IEEE Trans Med Imaging. 2000;19:153–165. doi: 10.1109/42.845174. [DOI] [PubMed] [Google Scholar]
- Tabrizi SJ, Scahill RI, Durr A, Roos RAC, Leavitt BR, Jones R, Landwehrmeyer GB, Fox NC, Johnson H, Hicks SL. Biological and clinical changes in premanifest and early stage Huntington's disease in the TRACK-HD study: the 12-month longitudinal analysis. The Lancet Neurology. 2011;10:31–42. doi: 10.1016/S1474-4422(10)70276-3. [DOI] [PubMed] [Google Scholar]
- Thompson PM, Hayashi KM, de Zubicaray G, Janke AL, Rose SE, Semple J, Herman D, Hong MS, Dittmer SS, Doddrell DM, Toga AW. Dynamics of gray matter loss in Alzheimer's disease. Journal of Neuroscience. 2003;23:994–1005. doi: 10.1523/JNEUROSCI.23-03-00994.2003. [DOI] [PMC free article] [PubMed] [Google Scholar]
- Thompson PM, Hayashi KM, de Zubicaray GI, Janke AL, Rose SE, Semple J, Hong MS, Herman DH, Gravano D, Doddrell DM, Toga AW. Mapping hippocampal and ventricular change in Alzheimer disease. Neuroimage. 2004a;22:1754–1766. doi: 10.1016/j.neuroimage.2004.03.040. [DOI] [PubMed] [Google Scholar]
- Thompson PM, Hayashi KM, De Zubicaray GI, Janke AL, Rose SE, Semple J, Hong MS, Herman DH, Gravano D, Doddrell DM, Toga AW. Mapping hippocampal and ventricular change in Alzheimer disease. Neuroimage. 2004b;22:1754–1766. doi: 10.1016/j.neuroimage.2004.03.040. [DOI] [PubMed] [Google Scholar]
- Utter AA, Basso MA. The basal ganglia: an overview of circuits and function. Neuroscience and Biobehavioral Reviews. 2008;32 doi: 10.1016/j.neubiorev.2006.11.003. [DOI] [PubMed] [Google Scholar]
- van den Bogaard SJA, Dumas EM, Ferrarini L, Milles J, van Buchem MA, van der Grond J, Roos RAC. Shape analysis of subcortical nuclei in Huntington's disease, global versus local atrophy — Results from the TRACK-HD study. Journal of the Neurological Sciences. 2011 doi: 10.1016/j.jns.2011.05.015. [DOI] [PubMed] [Google Scholar]
- Villemagne VL, Ataka S, Mizuno T, Brooks WS, Wada Y, Kondo M, Jones G, Watanabe Y, Mulligan R, Nakagawa M, Miki T, Shimada H, O'Keefe GJ, Masters CL, Mori H, Rowe CC. High Striatal Amyloid-Peptide Deposition Across Different Autosomal Alzheimer Disease Mutation Types. Archives of Neurology. 2009;66:1537–1544. doi: 10.1001/archneurol.2009.285. [DOI] [PubMed] [Google Scholar]
- Vonsattel JPG. Huntington disease models and human neuropathology: similarities and differences. Acta Neuropathologica. 2008;115:55–69. doi: 10.1007/s00401-007-0306-6. [DOI] [PMC free article] [PubMed] [Google Scholar]
- Walterfang M, Looi JCL, Styner M, Walker RH, Danek A, Niethammer M, Evans A, Kotschet K, Rodrigues GR, Hughes A, Velakoulis D. Shape alterations in the striatum in choreaacanthocytosis. Psychiatry Research: Neuroimaging. 2011;192:29–36. doi: 10.1016/j.pscychresns.2010.10.006. [DOI] [PMC free article] [PubMed] [Google Scholar]
- Walterfang M, Siu R, Velakoulis D. The NUCOG: the validity and reliability of a brief cognitive screening tool in neuropsychiatric patients. Australian and New Zealand Journal of Psychiatry. 2006;40:995–1002. doi: 10.1080/j.1440-1614.2006.01923.x. [DOI] [PubMed] [Google Scholar]
- Wang L, Beg F, Ratnanather T, Ceritoglu C, Younes L, Morris JC, Csernansky JG, Miller MI. Large deformation diffeomorphism and momentum based hippocampal shape discrimination in dementia of the Alzheimer type. IEEE Trans Med Imaging. 2007;26:462–470. doi: 10.1109/TMI.2005.853923. [DOI] [PMC free article] [PubMed] [Google Scholar]
- Whitwell JL, Jr, Jack CR, Boeve BF, Senjem ML, Baker M, Rademakers R, Ivnik RJ, Knopman DS, Wszolek ZK, Petersen RC, Josephs KA. Voxel-based morphometry patterns of atrophy in FTLD with mutations in MAPT or PGRN. Neurology. 2009a;72:813–820. doi: 10.1212/01.wnl.0000343851.46573.67. [DOI] [PMC free article] [PubMed] [Google Scholar]
- Whitwell JL, Przybelski SA, Weigand SD, Ivnik RJ, Vemuri P, Gunter JL, Senjem ML, Shiung MM, Boeve BF, Knopman DS, Parisi JE, Dickson DW, Petersen RC, Jack CR, Josephs KA. Distinct anatomical subtypes of the behavioural variant of frontotemporal dementia: a cluster analysis study. Brain. 2009b;132:2932–2946. doi: 10.1093/brain/awp232. [DOI] [PMC free article] [PubMed] [Google Scholar]
- Zaja-Milatovic S, Keene CD, Montine KS, Leverenz JB, Tsuang D, Montine TJ. Selective dendritic degeneration of medium spiny neurons in dementia with Lewy bodies. Neurology. 2006;66:1591–1593. doi: 10.1212/01.wnl.0000216137.09685.c1. [DOI] [PubMed] [Google Scholar]
- Zaja-Milatovic S, Milatovic D, Schantz AM, Zhang J, Montine KS, Samii A, Deutch AY, Montine TJ. Dendritic degeneration in neostriatal medium spiny neurons in Parkinson disease. Neurology. 2005:545–547. doi: 10.1212/01.WNL.0000150591.33787.A4. [DOI] [PubMed] [Google Scholar]