

Abstract
Context
Hippocampal shrinkage is commonly reported in schizophrenia, but its role in the illness is still poorly understood. In particular, it is unclear how clinical and psychosocial variables relate to hippocampal volumes.
Objectives
To address this, new methods for three-dimensional (3-D) computational image analysis may offer more detailed investigation of neuroanatomic differences than standard volumetric measures.
Design
We used high-resolution magnetic resonance imaging and surface-based modeling to map the 3D profile of hippocampal differences. 3D parametric mesh models of the hippocampus were created from manual tracings. Regression models were used to relate diagnostic measures to maps of radial distance. Color-coded maps were generated to show the profile of associations.
Participants
67 adults with schizophrenia (mean age= 39.40±12.08 years; 44 males/23 females) and 72 healthy controls (mean age= 39.28±11.03 years; 38 males/34 females).
Results
There were no detectable differences in hippocampal radial distance between schizophrenia patients and controls. In patients, however, bilateral shrinkage was associated with greater illness severity (i.e. length of illness, positive and negative symptoms), and with poorer social functioning (i.e. educational level, quality of life and health status), which survived Bonferroni correction.
Conclusions
Illness severity and poor social functioning may be associated with hippocampal shrinkage in schizophrenia. As a structural sign of poor outcome, imaging measures may help to identify a subgroup of patients who may need specific treatment to resist hippocampal decreased volumes, such as cognitive rehabilitation, or physical exercise.
Keywords: morphometry, quality of life, chronicity, MRI, social outcome
Introduction
Conventional volumetric magnetic resonance imaging (MRI) studies suggest that at least a proportion of patients with schizophrenia, particularly males 1 and first-episode patients 2, have lower hippocampal volumes than controls, as shown by systematic review and meta-analysis of regional morphometry 3; 4. Hippocampal decreased size may be accompanied by reductions in N-acetyl aspartate levels 5 and by hyperactivity of excitatory cortical pathways 6. One meta-analysis reported slightly lower hippocampal volumes in non-psychotic first-degree relatives of patients with schizophrenia. The effect size was small to moderate, and not consistently found – especially for the right hippocampus – making the results hard to interpret 7. Interestingly, a study including subjects at high risk for psychosis, first-episode patients, and individuals with chronic schizophrenia found hippocampal structural differences after the onset of the disease 8, as also confirmed by a meta-analysis of voxel based structural MRI studies 9. The same group showed that, counter-intuitively, larger rather than smaller hippocampal volumes in the high-risk cohort predicted subsequent development of acute psychosis, i.e., subjects who later developed a psychotic disorder had larger volumes than the high risk non-psychotic subgroup, with no differences from the normal group 10.
In addition, prior findings in schizophrenia have been inconsistent, reporting preserved volumes 11-14, as also shown by a voxelwise meta-analysis using anatomical likelihood estimation to identify consistently implicated brain areas across studies 15 or minimal volume reductions of about 4% 16. In this regard, in our prior ROI study we found no hippocampal volume abnormalities in schizophrenia 17. Some post mortem studies agree with imaging findings showing hippocampal atrophy in schizophrenia 18; 19, but others report no neuropathological abnormalities 20; 21.
From these findings, it is not yet fully understood whether the hippocampus is consistently altered in schizophrenia, but at least during the onset phase of the disease, dynamic processes in the brain may change its morphology. It is indeed a plastic structure sensitive to environmental, clinical and psychosocial phenomena. As such, it is of interest to further investigate whether potential hippocampal changes reflect neurodevelopmental anomalies, an aspect of disease progression, or structural sequelae of psychosocial changes that accompany the illness. The role of such dimensions in affecting, or associating with, hippocampus volumes in schizophrenia has been under-investigated. To this extent, schizophrenia is a heterogeneous syndrome including patients with a relatively positive course of illness and others with a far poorer long-term prognosis. One strategy for better understanding the pathophysiology of the disease would be to relate specific clinical and social variables to deviations from normal brain anatomy. In this context, different outcome measures have been used, such as duration and severity of positive symptoms, recovery from the first episode, psychopathological indicators of the Brief Psychiatric Rating Scale (BPRS) or functioning as detected with the Global Assessment of Functioning (GAF) scale (see 22 for a review).
We report results of the first study, to our knowledge, to use three-dimensional surface mesh models to evaluate statistical effects of clinical and psychosocial variables on the structural anatomy of the hippocampus in schizophrenia. This advanced computational imaging technique examines, at high spatial resolution, neuroanatomical hippocampal differences with more spatial detail than conventional manual tracing methods, allowing to calculate the local radial shrinkage 23. It can detect subtle or localized alterations in hippocampal structure, even when differences in overall hippocampal volumes are not detectable, as in our prior study 17.
Methods
Subjects
Sixty-seven patients with DSM-IV schizophrenia (mean age ±SD=39.40±12.08 years; 44 males and 23 females; all caucasians) and 72 healthy control subjects were studied (mean age ±SD=39.28±11. 03 years; 38 males and 34 females; all Caucasians; Table 1). Patients were recruited from the geographically defined catchment area of South Verona (around 100,000 inhabitants). They were being treated by the South Verona Community-based Mental Health Service (CMHS) and by other clinics reporting to the South-Verona Psychiatric Care Register (PCR). Diagnoses for schizophrenia were obtained using the Item Group Checklist of the Schedule for Clinical Assessment in Neuropsychiatry (IGC-SCAN) and confirmed by the clinical consensus of two staff psychiatrists. The IGC-SCAN was performed by two trained research clinical psychologists with extensive experience in the procedure; they had already administered at least 10 IGC-SCAN with a trained senior investigator. Moreover, the psychopathological item groups completed by the two raters were compared, to discuss any discrepancies in the assessment of major symptoms. We also ensured the reliability of the IGC-SCAN diagnoses by holding regular consensus meetings with the psychiatrists treating the patients and a senior investigator. The Italian version of the SCAN was edited by our group. Our investigators attended specific training courses held by official trainers, to learn how to administer the IGC-SCAN. Subsequently, diagnoses of schizophrenia were corroborated by the clinical consensus of two staff psychiatrists, according to the DSM-IV criteria. Patients with co-morbid psychiatric disorders, alcohol or substance abuse within the six months preceding the study, history of traumatic head injury with loss of consciousness, epilepsy or other neurological diseases were excluded. All but one patient were receiving antipsychotic medications at the time of scanning. Specifically, 25 were on typical antipsychotic drugs (19 on haloperidol, 4 on fluphenazine, 2 on zuclopenthixol) and 41 on atypical antipsychotic medication (22 olanzapine, 9 clozapine, 7 risperidone, 3 quetiapine). Five of these subjects were taking another antipsychotic at the time of imaging (2 clotiapine, 1 thioridazine, 1 quetiapine, 1 olanzapine). The chloropromazine equivalent dosages were calculated (Table 1). Patients' clinical information was retrieved from psychiatric interviews, the attending psychiatrist and medical charts. Clinical symptoms were characterized using the Brief Psychiatric Rating Scale (BPRS 24-item version), and psychosocial functioning with the SF-36, and the Manchester Short Assessment of Quality of Life (MANSA). These scales were administered by two trained clinical research psychologists. The reliability for BPRS was established and monitored, using procedures similar to the IGC-SCAN.
Table 1.
Sample demographics.
| Variables | Healthy participants (N=72) | Patients with schizophrenia (N=67) | Analysis | |
|---|---|---|---|---|
| Test | p | |||
| Age (years) | 39.3±11.0 | 39.4±12.1 | t=0.15 | 0.95 |
| Gender (men/women) | 38/34 | 44/23 | χ2=2.38 | 0.12 |
| Handedness (right/left) | 60/12 | 55/12 | χ2=0.04 | 0.85 |
| Educational level (years) | 13.2±4.3 | 9.5±3.2 | t=5.85 | <0.01 |
| Length of illness (years) | 13.3±10.6 | |||
| Antipsychotic lifetime treatment (years) | 11.6±10.5 | |||
| BPRS - total score | 45.4±18.3 | |||
| BPRS - negative symptoms | 11.8±4.7 | |||
| BPRS - positive symptoms | 11.7±6.3 | |||
| MANSA | 4.5±1.1 | |||
| SF-36 Physical Component | 49.2±7.9 | |||
| SF-36 Mental Component | 41.4±9.9 | |||
GAF=Global Assessment of Functioning; CPZ=chlorpromazine; BPRS=Brief Psychiatric Rating Scale; WHO-DAS=World Health Organization Disability Assessment Schedule; MANSA=Manchester Short Assessment of Quality of Life; SF-36=Short Form (36) Health Survey.
Healthy control subjects had no DSM-IV axis I disorders, as determined by a brief modified version of the SCID-NP (non-patient version), no history of psychiatric disorders among first-degree relatives, no history of alcohol or substance abuse and no current major medical illness.
All participants gave signed informed consent, after having understood all issues involved in participation in the research. The research was approved by the biomedical Ethics Committee of the Azienda Ospedaliera of Verona.
Psychosocial Scales
Manchester Short Assessment of Quality of Life (MANSA)
The MANSA is a clinical interview for the assessment of quality of life. It was developed as a brief and modified version of the Lancashire Quality of Life Profile. The scale encompasses three sections. The first section describes stable personal patient details, such as personal information and diagnosis. The second section records personal details that may change over time, such as education, employment, income, accommodation, family members living with the patients. The third section consists of 16 questions that must be asked every time the assessment is applied, i.e., four questions address objective items (having a close friend, number of contacts with friends per week, judicial proceedings and physical violence suffered) and require a “yes” or “no” answer; the remaining 12 questions address subjective domains (satisfaction with life, job-training condition, financial situation, quality of friendships, hobbies, satisfaction with accommodation, personal safety, sexual life, relationship with family, physical and mental health) and are rated on a 7-point scale, from extremely negative, “1”, to extremely positive, “7”.
SF-36 Health Survey
The SF-36 Health Survey is one of the most widely used generic health status measures. It is composed of 36 questions and standardized response choices, divided into eight multi-item scales: physical functioning, role limitations due to physical health problems, bodily pain, general health perceptions, vitality, social functioning, role limitation due to emotional problems, general mental health. It is applied to assess the previous 4 weeks.
MRI Acquisition
MRI scans were acquired with a 1.5T Siemens Magnetom Symphony Maestro Class scanner (Syngo MR, 2002B). A standard head coil was used for RF transmission and reception of the MR signal; restraining foam pads were used to minimize head motion. T1-weighted images were first obtained to verify each subject's head position and the image quality (with acquisition parameters: TR=450 ms, TE=14 ms, flip angle=90°, FOV=230×230 mm, 18 slices, slice thickness=5 mm, matrix size=384×512, NEX=2). PD/T2–weighted images were then acquired (TR=2500 ms, TE=24/121 ms, flip angle=180°, FOV=230×230 mm, 20 slices, slice thickness=5 mm, matrix size=410×512, NEX=2), according to an axial plane parallel to the anterior-posterior commissures (AC-PC), to exclude focal lesions. Subsequently, a coronal 3D MP-RAGE sequence was acquired (TR=2060 ms, TE=3.9 ms, flip angle=15°, FOV=176×235 mm, slice thickness=1.25 mm, matrix size=270×512, inversion time=1100 ms) to obtain 144 images covering the entire brain.
MRI Data Processing and Analysis
Anatomical imaging data was transferred to a PC workstation and analyzed using the BRAINS2 software developed at the University of Iowa (http://www.psychiatry.uiowa.edu/mhcrc/IPLpages/BRAINS.htm). The hippocampus was traced on the T1-weighted (MP-RAGE) images in the coronal plane according to prior methods from our group 24. Specifically, the corona radiata and then the ambient cistern were used as the superior border; the white matter served as the inferior border, and the inferior horn of the lateral ventricle as the lateral one. The parahippocampal gyrus and other surrounding areas, such as entorhinal and perirhinal regions, was not included in the tracing. Tracing was performed by a rater blind to subjects' identity, sociodemographic and clinical variables. Two raters achieved high reliability, as defined by intra-class correlation coefficients (ICCs) of 0.96 for both left and right hippocampal volumes. The volumes were obtained by summing the volumes of all relevant slices and were expressed in cm3. Raw measures were obtained. The hippocampus for this study was rigidly aligned and re-sliced for tracing, i.e. only a rigid body transform was used to align the brains for tracing, to avoid re-scaling the anatomy.
Statistical Maps
3D parametric surface maps were created from the automatically generated segmentations of each individual's hippocampus using anatomical surface modeling software 23. A 3-D medial curve was calculated from the hippocampal traces. The medial curve was computed separately for each individual. Local radial shrinkage was calculated by measuring the radial distances from each hippocampal surface point on the 3D surface mesh to the medial axis. Based on computed point-wise correspondences, surface models for all individuals in each diagnostic group were geometrically averaged. Statistical maps indicating local volumetric differences between groups were generated from the surface models. A regression was also run at each surface point to compare differences between diagnostic groups and determine the association of clinical (chronicity, illness severity, and medication) and psychosocial scores (quality of life and health status) with radial shrinkage. All statistical maps were directionally divided to indicate a positive or negative association; the maps shown are one-sided statistical maps in the hypothesized direction for each clinical measure (with lower volumes associated with poorer performance).
Color-coded p-values were assigned to the average surface models, and their overall (corrected) significance was assessed using a permutation test. The p-values describe the significance of differences in radial distances between diagnostic groups or their association with clinical values. We used permutation tests to provide an overall significance value, a corrected P-value, for the statistical whole maps. The primary threshold of p = 0.05 was established for all statistical maps and the suprathreshold area was compared with its (non-parametric) null distribution based on randomized data. Correlations with clinical variables (length of illness, positive symptoms, negative symptoms, antipsychotic lifetime treatment) and psychosocial factors (MANSA, SF-36 physical component, SF-36 mental component) were separately corrected by applying Bonferroni correction.
Results
Group Difference Maps
We created 3D maps showing the mean level of hippocampal shrinkage in schizophrenia patients vs. controls. Separate maps were created for the left and right hippocampus. The results indicated no significant difference in radial shrinkage among the two groups.
Socio-Demographical Variable Effects
Significant associations were found in the maps for sex (Left: p<0.001; Right: p<0.001) and handedness (Left: p<0.001), with, as expected, a smaller hippocampus in women than men and a bigger left hippocampus in right-handed individuals. Next we examined statistical effects of education level in the schizophrenia patients. Bilateral shrinkage was associated with lower levels of education in schizophrenia (Left: p=0.001; Right: p<0.001), but not in the control group (p>0.05) (Figure 1).
Figure 1.
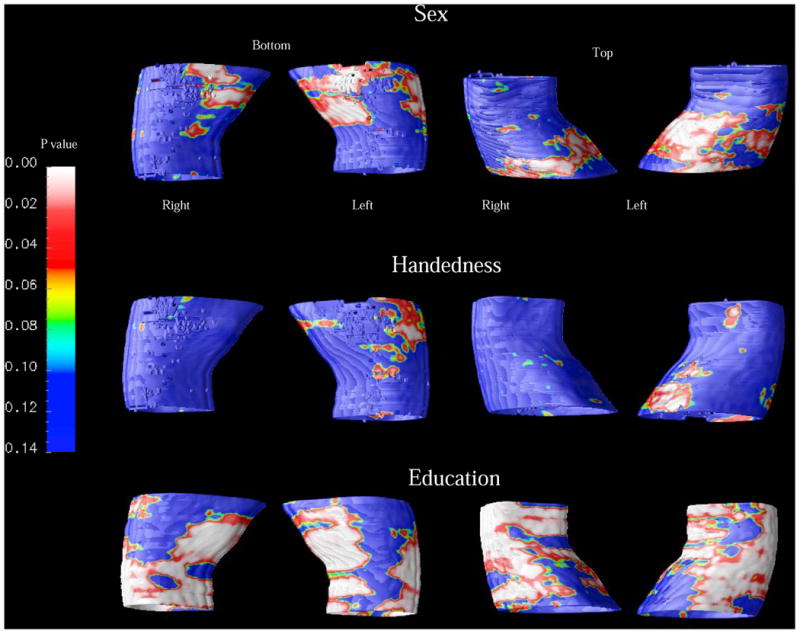
Maps of correlation between hippocampal shrinkage and socio-demographical variables.
White and red areas indicate where radial hippocampal shrinkage was significantly associated (p < 0.05) with the socio-demographical measures; yellow to blue areas are weakly or not associated. Smaller hippocampus was found in women than in men bilaterally (p<0.001) and in left-handers versus right-handers in the left side (p<0.001). Also, lower levels of education associated with bilateral hippocampal shrinkage in patients with schizophrenia (p<0.001), but not in control subjects (p>0.05).
Clinical Variable Effects
Next we created maps of associations between regional shrinkage and clinical scores. Bilateral hippocampal shrinkage was associated with greater duration of illness (Left: p=0.01; Right: p=0.003; after Bonferroni correction: Left: p=0.04; Right: p=0.012, respectively) and higher levels of positive (Left: p=0.05; Right: p=0.005; after Bonferroni correction: Left: p=0.20; Right: p=0.02, respectively) and negative symptoms (Left: p=0.01; Right: p=0.008; after Bonferroni correction: Left: p=0.04; Right: p=0.032, respectively) (Figure 2). Finally, the effect of antipsychotic medication on the hippocampus of the patient group was examined, showing that more years of antipsychotic drug intake associated with greater right hippocampal shrinkage (Right: p=0.04), which did not survive Bonferroni correction (p=0.16). No significant correlations were observed between bilateral hippocampal ROI volumes and clinical measures (Partial correlations analyses controlled for age, p>0.05, Bonferroni corrected).
Figure 2.
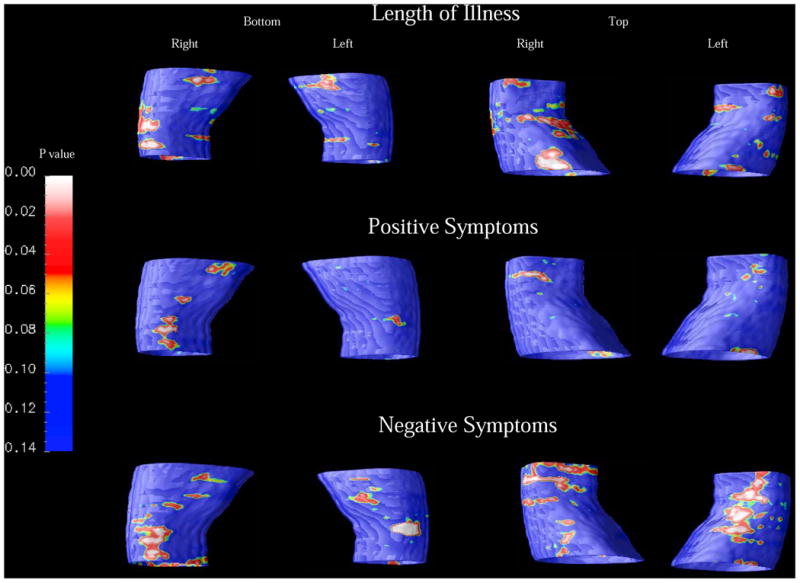
Maps of correlation between hippocampal shrinkage and clinical variables. Hippocampal shrinkage correlated with duration of illness and with negative symptoms, bilaterally, and with positive symptoms in the right side (p<0.05 Bonferroni corrected).
Psycho-Social Variable Effects
Examining generic health status with the SF-36 Health Survey, we showed that lower levels of both physical health (Left: p=0.01; Right: p=0.01; after Bonferroni correction: Left: p=0.03; Right: p=0.03, respectively) and mental health (Left: p=0.007; Right: p=0.01; after Bonferroni correction: Left: p=0.021; Right: p=0.03, respectively) significantly correlated with bilateral shrinkage of the hippocampus. A similar association was found between a lower MANSA score (Manchester Short Assessment of Quality of Life) and decreased hippocampal size (Left: p=0.002; Right: p<0.001; after Bonferroni correction: Left: p=0.006; Right: p<0.003, respectively) (Figure 3). SF-36 and MANSA scores did not significantly associated with right and left hippocampal ROI volumes (Partial correlations analyses controlled for age, p>0.05, Bonferroni corrected).
Figure 3.
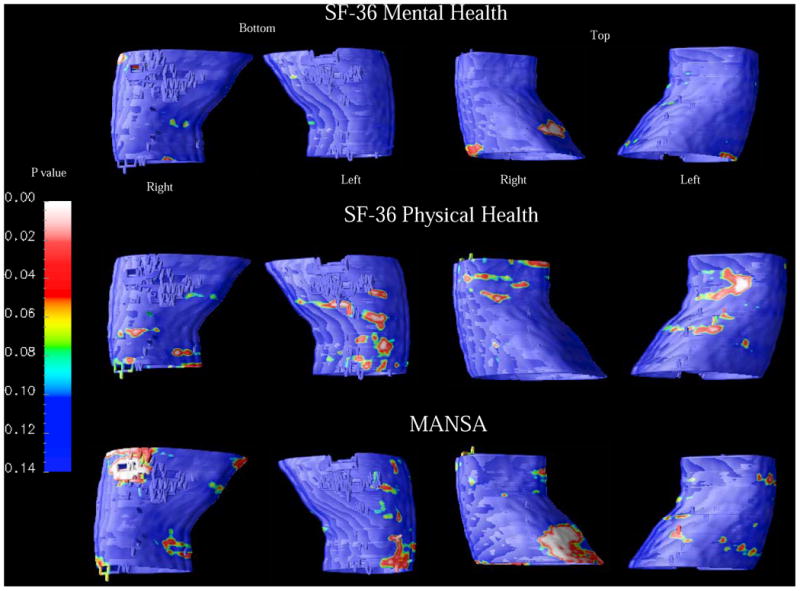
Maps of correlation between hippocampal shrinkage and psycho-social variables.
Bilateral shrinkage of the hippocampus associated with lower scores at the SF-36 Health Survey and at the MANSA (p<0.05 Bonferroni corrected).
Comment
Using relatively novel methods for three-dimensional (3D) mapping of the hippocampus, we did not detect significant hippocampal differences, at the group level, in schizophrenia relative to age-matched controls. This confirms our prior ROI study (Baiano et al. 2008) and is in line with the somewhat controversial structural MRI literature summarized in the introduction, with some studies reporting hippocampal volume shrinkage and others showing no abnormalities. Notably, a preserved number and size of hippocampal neurons have been reported in schizophrenia 21. In addition, PET/SPECT studies yielded a small effect size for hippocampal metabolism in differentiating schizophrenia and control groups, with an almost complete overlap (>92%) between the two distributions 25. This suggests that hippocampal differences in schizophrenia, if present, may relate to local disturbances in cytoarchitectural organization 26, with only partial or minimal overall effects on hippocampal morphology and metabolism. Even so, we investigated mainly chronic patients with long-term antipsychotic maintenance, which may have preserved or normalized the size of the hippocampus. As such, hippocampal decreased volumes may be present in drug-naïve first-episode patients 27. Indeed, several human and animal studies suggest that some antipsychotic drugs may have neuroprotective effects on the hippocampus 28; 29.
Interestingly, with surface-based anatomical maps, we found that greater hippocampal shrinkage was correlated with disease severity (e.g. duration of illness, positive and negative symptoms), and with poor social outcome identified in terms of lower levels of education, quality of life (MANSA), and health status (SF-36). Consistent with this, prior imaging studies in schizophrenia found that smaller hippocampal volumes were associated with poorer pre-morbid adjustment 13 and longer duration of illness 3; 30. Greater positive symptoms have also been related to poorer hippocampal functioning 31. Furthermore, it has clearly been demonstrated that lower educational levels is associated with lower gray matter volumes, particularly in the temporal lobes, in healthy subjects 32 which may therefore have a greater negative impact on subjects with mental illnesses, such as in schizophrenia, as suggested by our findings. Our findings are also supported by a recent study in first episode psychotic patients, where smaller right hippocampus volume associated with poor clinical outcome at three-year follow-up 33.
Clinical outcomes may fluctuate during the first 10-15 years of the illness and may not consistently relate to specific structural brain differences 34. Therefore it is extremely useful to investigate outcome measures in a chronic cohort with a long duration of illness, as in our study. Prior imaging studies have explored structural markers of poor outcome in schizophrenia, differently defined based on admission rate, time spent in hospital, response to treatment, symptoms, self-care ability, and general functioning. In particular, greater ventricular and lower cerebral (frontal) volumes have been reported, even with progressive changes over time in both chronic and first-episode patients (see for a review, 22). Reduced volumes for the putamen and corpus callosum have also recently been reported by Mitelman and colleagues 35; 36 in very poor outcome patients identified as “Kraepelinian”. These patients had, for the previous five years, to be continuously hospitalized or needed continuous assistance, were unemployed and had no remission of symptoms. However, to the best of our knowledge, no prior report investigated specifically how hippocampal structure relates to specific psychosocial scales used to measure social functioning, as in our report. Therefore, it should be kept in mind that an impaired neuronal network, including in particular frontal cortex, putamen, corpus callosum, and hippocampus may be associated with poor outcome schizophrenia.
Our results suggest that illness severity and poor social outcome may reflect or promote poorer hippocampal neural plasticity in schizophrenia, with particular regional effect on the body surface of the hippocampus localized predominantly on the right side although there was a scattered bilateral distributed impact (see Figure 2 and 3). It should be considered that decreased of environmental stimuli and chronic stress, which reduce the quality of life and the general health status in patients with schizophrenia, are crucial factors that may contribute in affecting hippocampal plasticity 37; 38. It is interesting to note that no significant correlations were found between clinical measures and hippocampal size considering the raw total volumes obtained by ROI tracing 17, which we were able to observe by using this 3D technique. This support the strength of using advanced imaging and post-processing technique in analysing hippocampal morphology.
It is not yet fully understood whether hippocampal structural abnormalities partly reflect neurodegeneration in schizophrenia, but the hippocampus is one of the brain regions most vulnerable to neuronal loss. Diverse remodeling processes may change the morphology of hippocampus, such as retraction of dendrites, decreased neurogenesis and/or loss of glial cells 39, possibly in part due to altered glutamatergic neurotransmission. Also, oxidative DNA damage of the hippocampus has been found in elderly patients with schizophrenia and poor outcome 40. As such, hippocampal neurodegeneration may be an index of poor social outcome in chronic patients with schizophrenia, particularly in a subset with neurodegenerative features.
Some major limitations of this study should be kept in mind. First, this was a cross-sectional study. To further characterize hippocampal volume based on social outcome, patients with schizophrenia should be studied longitudinally, ideally including drug-free individuals at the first outbreak. Second, neuropsychological and genetic assessments should be performed to determine how cognition and genes influence the statistical relationship between hippocampal volume and social functioning. Poor social functioning may in part be sustained by impaired cognitive abilities such as performance memory, learning, and abstraction which relate to the hippocampus. Therefore, it would be intriguing to see whether cognitive decline or particular genetic polymorphisms (e.g., BDNF, NRG1) promote changes in hippocampal morphology and associate with social outcome. Also, from 1.5T MR imaging was not possible to reliably resolve details of the anatomical subfields of the hippocampus, therefore we cannot surely argue which specific sub-region consistently correlates with different clinical or psychosocial measures. Future 3D studies should therefore obtain anatomical fine definition of hippocampal sub-regions, ultimately trying to delineate whether regional shrinkage specifically links, for instance, with symptoms or poor social functioning. Last, the ventricle system was not reconstructed in this study, therefore we cannot completely exclude that potential enlargement of the temporal horns of the lateral ventricles may relates to distortions in surrounding anatomy, including the hippocampus. However, considering that no significant differences for hippocampal volumes were found between patients and controls we assume that possible effects of ventricular enlargement have not taken place in this case.
In conclusion, hippocampal shrinkage may be a structural sign of poor clinical outcome and social functioning in schizophrenia, helping to identify a subgroup of patients who may need specific treatment. Classification of patients with hippocampal abnormalities and clinical and social impairment should however be based on specific criteria of illness severity and poor functioning, which may then be of clinical relevance. This may indeed assist in determining patients who may need treatment for adequate therapeutic management, such as psychosocial stimulation, cognitive rehabilitation, or physical exercise. Such therapeutic strategies may potentially preserve or normalize hippocampal size, which may also be monitored to study the effects of clinical interventions, ultimately leading to better clinical and social outcomes.
Acknowledgments
PB was partly supported by grants from the American Psychiatric Institute for Research and Education (APIRE), the Italian Ministry for University and Research, and the Italian Ministry of Health (IRCCS “E. Medea”). PR, PS, and PT were supported by NIH grants R01 EB008281, P41 RR013642, R01 AG020098 and R01 HD050735.
Footnotes
Declaration of interest from all authors: None.
References
- 1.Sim K, DeWitt I, Ditman T, Zalesak M, Greenhouse I, Goff D, et al. Hippocampal and parahippocampal volumes in schizophrenia: a structural MRI study. Schizophr Bull. 2006;32:332–340. doi: 10.1093/schbul/sbj030. [DOI] [PMC free article] [PubMed] [Google Scholar]
- 2.Lieberman J, Chakos M, Wu H, Alvir J, Hoffman E, Robinson D, et al. Longitudinal study of brain morphology in first episode schizophrenia. Biol Psychiatry. 2001;49:487–499. doi: 10.1016/s0006-3223(01)01067-8. [DOI] [PubMed] [Google Scholar]
- 3.Chakos MH, Schobel SA, Gu H, Gerig G, Bradford D, Charles C, et al. Duration of illness and treatment effects on hippocampal volume in male patients with schizophrenia. Br J Psychiatry. 2005;186:26–31. doi: 10.1192/bjp.186.1.26. [DOI] [PubMed] [Google Scholar]
- 4.Steen RG, Mull C, McClure R, Hamer RM, Lieberman JA. Brain volume in first-episode schizophrenia: systematic review and meta-analysis of magnetic resonance imaging studies. Br J Psychiatry. 2006;188:510–518. doi: 10.1192/bjp.188.6.510. [DOI] [PubMed] [Google Scholar]
- 5.Steen RG, Hamer RM, Lieberman JA. Measurement of brain metabolites by 1H magnetic resonance spectroscopy in patients with schizophrenia: a systematic review and meta-analysis. Neuropsychopharmacology. 2005;30:1949–1962. doi: 10.1038/sj.npp.1300850. [DOI] [PubMed] [Google Scholar]
- 6.Wang L, Mamah D, Harms MP, Karnik M, Price JL, Gado MH, et al. Progressive deformation of deep brain nuclei and hippocampal-amygdala formation in schizophrenia. Biol Psychiatry. 2008;64:1060–1068. doi: 10.1016/j.biopsych.2008.08.007. [DOI] [PMC free article] [PubMed] [Google Scholar]
- 7.Boos HB, Aleman A, Cahn W, Hulshoff Pol H, Kahn RS. Brain volumes in relatives of patients with schizophrenia: a meta-analysis. Arch Gen Psychiatry. 2007;64:297–304. doi: 10.1001/archpsyc.64.3.297. [DOI] [PubMed] [Google Scholar]
- 8.Velakoulis D, Wood SJ, Wong MT, McGorry PD, Yung A, Phillips L, et al. Hippocampal and amygdala volumes according to psychosis stage and diagnosis: a magnetic resonance imaging study of chronic schizophrenia, first-episode psychosis, and ultra-high-risk individuals. Arch Gen Psychiatry. 2006;63:139–149. doi: 10.1001/archpsyc.63.2.139. [DOI] [PubMed] [Google Scholar]
- 9.Ellison-Wright I, Glahn DC, Laird AR, Thelen SM, Bullmore E. The anatomy of first-episode and chronic schizophrenia: an anatomical likelihood estimation meta-analysis. Am J Psychiatry. 2008;165:1015–1023. doi: 10.1176/appi.ajp.2008.07101562. [DOI] [PMC free article] [PubMed] [Google Scholar]
- 10.Phillips LJ, Yung AR, Yuen HP, Pantelis C, McGorry PD. Prediction and prevention of transition to psychosis in young people at incipient risk for schizophrenia. Am J Med Genet. 2002;114:929–937. doi: 10.1002/ajmg.b.10790. [DOI] [PubMed] [Google Scholar]
- 11.Staal WG, Hulshoff Pol HE, Schnack HG, Hoogendoorn ML, Jellema K, Kahn RS. Structural brain abnormalities in patients with schizophrenia and their healthy siblings. Am J Psychiatry. 2000;157:416–421. doi: 10.1176/appi.ajp.157.3.416. [DOI] [PubMed] [Google Scholar]
- 12.Sanfilipo M, Lafargue T, Rusinek H, Arena L, Loneragan C, Lautin A, et al. Cognitive performance in schizophrenia: relationship to regional brain volumes and psychiatric symptoms. Psychiatry Res. 2002;116:1–23. doi: 10.1016/s0925-4927(02)00046-x. [DOI] [PubMed] [Google Scholar]
- 13.Smith GN, Lang DJ, Kopala LC, Lapointe JS, Falkai P, Honer WG. Developmental abnormalities of the hippocampus in first-episode schizophrenia. Biol Psychiatry. 2003;53:555–561. doi: 10.1016/s0006-3223(02)01977-7. [DOI] [PubMed] [Google Scholar]
- 14.Frazier JA, Hodge SM, Breeze JL, Giuliano AJ, Terry JE, Moore CM, et al. Diagnostic and sex effects on limbic volumes in early-onset bipolar disorder and schizophrenia. Schizophr Bull. 2008;34:37–46. doi: 10.1093/schbul/sbm120. [DOI] [PMC free article] [PubMed] [Google Scholar]
- 15.Glahn DC, Laird AR, Ellison-Wright I, Thelen SM, Robinson JL, Lancaster JL, et al. Meta-analysis of gray matter anomalies in schizophrenia: application of anatomic likelihood estimation and network analysis. Biol Psychiatry. 2008;64:774–781. doi: 10.1016/j.biopsych.2008.03.031. [DOI] [PMC free article] [PubMed] [Google Scholar]
- 16.Nelson MD, Saykin AJ, Flashman LA, Riordan HJ. Hippocampal volume reduction in schizophrenia as assessed by magnetic resonance imaging: a meta-analytic study. Arch Gen Psychiatry. 1998;55:433–440. doi: 10.1001/archpsyc.55.5.433. [DOI] [PubMed] [Google Scholar]
- 17.Baiano M, Perlini C, Rambaldelli G, Cerini R, Dusi N, Bellani M, et al. Decreased entorhinal cortex volumes in schizophrenia. Schizophr Res. 2008;102:171–180. doi: 10.1016/j.schres.2007.11.035. [DOI] [PubMed] [Google Scholar]
- 18.Jeste DV, Lohr JB. Hippocampal pathologic findings in schizophrenia. A morphometric study Arch Gen Psychiatry. 1989;46:1019–1024. doi: 10.1001/archpsyc.1989.01810110061009. [DOI] [PubMed] [Google Scholar]
- 19.Heckers S, Stone D, Walsh J, Shick J, Koul P, Benes FM. Differential hippocampal expression of glutamic acid decarboxylase 65 and 67 messenger RNA in bipolar disorder and schizophrenia. Arch Gen Psychiatry. 2002;59:521–529. doi: 10.1001/archpsyc.59.6.521. [DOI] [PubMed] [Google Scholar]
- 20.Hurlemann R, Tepest R, Maier W, Falkai P, Vogeley K. Intact hippocampal gray matter in schizophrenia as revealed by automatized image analysis postmortem. Anat Embryol (Berl) 2005;210:513–517. doi: 10.1007/s00429-005-0035-3. [DOI] [PubMed] [Google Scholar]
- 21.Walker MA, Highley JR, Esiri MM, McDonald B, Roberts HC, Evans SP, et al. Estimated neuronal populations and volumes of the hippocampus and its subfields in schizophrenia. Am J Psychiatry. 2002;159:821–828. doi: 10.1176/appi.ajp.159.5.821. [DOI] [PubMed] [Google Scholar]
- 22.Bellani M, Dusi N, Brambilla P. Longitudinal imaging studies in schizophrenia: the relationship between brain morphology and outcome measures. Epidemiologia e Psichiatria Sociale. 2010;19:207–210. [PubMed] [Google Scholar]
- 23.Thompson PM, Hayashi KM, De Zubicaray GI, Janke AL, Rose SE, Semple J, et al. Mapping hippocampal and ventricular change in Alzheimer disease. Neuroimage. 2004;22:1754–1766. doi: 10.1016/j.neuroimage.2004.03.040. [DOI] [PubMed] [Google Scholar]
- 24.Brambilla P, Harenski K, Nicoletti M, Sassi RB, Mallinger AG, Frank E, et al. MRI investigation of temporal lobe structures in bipolar patients. J Psychiatr Res. 2003;37:287–295. doi: 10.1016/s0022-3956(03)00024-4. [DOI] [PubMed] [Google Scholar]
- 25.Davidson LL, Heinrichs RW. Quantification of frontal and temporal lobe brain-imaging findings in schizophrenia: a meta-analysis. Psychiatry Res. 2003;122:69–87. doi: 10.1016/s0925-4927(02)00118-x. [DOI] [PubMed] [Google Scholar]
- 26.Heckers S, Konradi C. Hippocampal neurons in schizophrenia. J Neural Transm. 2002;109:891–905. doi: 10.1007/s007020200073. [DOI] [PMC free article] [PubMed] [Google Scholar]
- 27.Vita A, De Peri L, Silenzi C, Dieci M. Brain morphology in first-episode schizophrenia: a meta-analysis of quantitative magnetic resonance imaging studies. Schizophr Res. 2006;82:75–88. doi: 10.1016/j.schres.2005.11.004. [DOI] [PubMed] [Google Scholar]
- 28.Pillai A, Mahadik SP. Differential effects of haloperidol and olanzapine on levels of vascular endothelial growth factor and angiogenesis in rat hippocampus. Schizophr Res. 2006;87:48–59. doi: 10.1016/j.schres.2006.06.017. [DOI] [PubMed] [Google Scholar]
- 29.Vita A, De Peri L. The effects of antipsychotic treatment on cerebral structure and function in schizophrenia. Int Rev Psychiatry. 2007;19:429–436. doi: 10.1080/09540260701486332. [DOI] [PubMed] [Google Scholar]
- 30.Velakoulis D, Pantelis C, McGorry PD, Dudgeon P, Brewer W, Cook M, et al. Hippocampal volume in first-episode psychoses and chronic schizophrenia: a high-resolution magnetic resonance imaging study. Arch Gen Psychiatry. 1999;56:133–141. doi: 10.1001/archpsyc.56.2.133. [DOI] [PubMed] [Google Scholar]
- 31.Goghari VM, Sponheim SR, MacDonald AW., 3rd The functional neuroanatomy of symptom dimensions in schizophrenia: a qualitative and quantitative review of a persistent question. Neurosci Biobehav Rev. 2010;34:468–486. doi: 10.1016/j.neubiorev.2009.09.004. [DOI] [PMC free article] [PubMed] [Google Scholar]
- 32.Ho AJ, Raji CA, Becker JT, Lopez OL, Kuller LH, Hua X, et al. The effects of physical activity, education, and body mass index on the aging brain. Hum Brain Mapp. doi: 10.1002/hbm.21113. [DOI] [PMC free article] [PubMed] [Google Scholar]
- 33.de Castro-Manglano P, Mechelli A, Soutullo C, Landecho I, Gimenez-Amaya JM, Ortuno F, et al. Structural brain abnormalities in first-episode psychosis: differences between affective psychoses and schizophrenia and relationship to clinical outcome. Bipolar Disord. 2011;13:545–555. doi: 10.1111/j.1399-5618.2011.00953.x. [DOI] [PubMed] [Google Scholar]
- 34.Staal WG, Hulshoff Pol HE, Kahn RS. Outcome of schizophrenia in relation to brain abnormalities. Schizophr Bull. 1999;25:337–348. doi: 10.1093/oxfordjournals.schbul.a033382. [DOI] [PubMed] [Google Scholar]
- 35.Mitelman SA, Canfield EL, Chu KW, Brickman AM, Shihabuddin L, Hazlett EA, et al. Poor outcome in chronic schizophrenia is associated with progressive loss of volume of the putamen. Schizophr Res. 2009;113:241–245. doi: 10.1016/j.schres.2009.06.022. [DOI] [PMC free article] [PubMed] [Google Scholar]
- 36.Mitelman SA, Nikiforova YK, Canfield EL, Hazlett EA, Brickman AM, Shihabuddin L, et al. A longitudinal study of the corpus callosum in chronic schizophrenia. Schizophr Res. 2009;114:144–153. doi: 10.1016/j.schres.2009.07.021. [DOI] [PMC free article] [PubMed] [Google Scholar]
- 37.Zhang L, Zhang J, Sun H, Liu H, Yang Y, Yao Z. Exposure to enriched environment restores the mRNA expression of mineralocorticoid and glucocorticoid receptors in the hippocampus and ameliorates depressive-like symptoms in chronically stressed rats. Curr Neurovasc Res. 2011 doi: 10.2174/156720211798121025. [DOI] [PubMed] [Google Scholar]
- 38.Hu XL, Bergstrom SA, Brink M, Ronnback A, Dahlqvist P. Enriched environment increases spinophilin mRNA expression and spinophilin immunoreactive dendritic spines in hippocampus and cortex. Neurosci Lett. 2011;476:79–83. doi: 10.1016/j.neulet.2010.04.007. [DOI] [PubMed] [Google Scholar]
- 39.Martinez-Tellez RI, Hernandez-Torres E, Gamboa C, Flores G. Prenatal stress alters spine density and dendritic length of nucleus accumbens and hippocampus neurons in rat offspring. Synapse. 2009;63:794–804. doi: 10.1002/syn.20664. [DOI] [PubMed] [Google Scholar]
- 40.Nishioka N, Arnold SE. Evidence for oxidative DNA damage in the hippocampus of elderly patients with chronic schizophrenia. Am J Geriatr Psychiatry. 2004;12:167–175. [PubMed] [Google Scholar]