Abstract
This article addresses the two key challenges in computer-assisted percutaneous tumor ablation: planning multiple overlapping ablations for large tumors while avoiding critical structures, and executing the prescribed plan. Towards semi-automatic treatment planning for image-guided surgical interventions, we develop a systematic approach to the needle-based ablation placement task, ranging from pre-operative planning algorithms to an intra-operative execution platform. The planning system incorporates clinical constraints on ablations and trajectories using a multiple objective optimization formulation, which consists of optimal path selection and ablation coverage optimization based on integer programming. The system implementation is presented and validated in phantom studies and on an animal model. The presented system can potentially be further extended for other ablation techniques such as cryotherapy.
Index Terms: Radiofrequency Ablation, Image Guidance, Treatment Planning, Optimization, Open Source
I. Introduction
The latest statistics from the World Health Organization indicates that lung and liver cancer are among the top 5 most frequent cancer related deaths world-wide [1]. Percutaneous radiofrequency ablation (RFA) has emerged as a commonly used technique for the minimally invasive treatment of numerous organ cancers [2], including lung and liver. Though surgical resection provides the best way to treat cancer, it is estimated that only 10–15% of patients with lung or liver neoplasms are surgical candidates [3] [4], due to the extent of the disease or concurrent medical conditions. Approximately 80% of unresectable tumors may be amenable to image-guided ablative techniques, which have been established as primary ablative procedures at most institutions.
The current tumor ablation techniques use needle-like probes which deliver “thermo-therapy” to kill the cancerous tissue. These probes either increase tissue temperature by techniques such as focused ultrasound, laser, radiofrequency, and microwave, or decrease tissue temperature by cryotherapy [5].
Two important clinical considerations are tumor size and accessibility to the lesion. Multiple overlapping ablations need to be planned to cover irregular and oversize tumors through a series of single probe ablations. In addition, the planned ablations should be accessible by the needle-based probe, should avoid critical structures and minimize damage to healthy tissue.
Manual treatment planning and execution is dependent on the operator’s experience and relies on a trial and error approach, which is error-prone and time-consuming without the assistance of semiautomatic planning and navigation. To address the aforementioned key challenges, this article focuses on a semiautomatic approach for radiofrequency ablation of liver tumors. The primary contribution in this article is the systematic approach that incorporates practical clinical constraints in planning and navigation.
The rest of this paper is organized as follows. Section II summarizes the challenges, significance and related work in radiofrequency ablation procedures. Section III presents the proposed system approach, which is validated in Section IV. Finally Section V concludes the paper.
II. Significance And Related Work
A. Clinical Concerns and Challenges
The current procedure of radiofrequency ablation has two clinical concerns as described below.
1) Adequate ablation coverage of the tumor
Despite the availability of larger electrodes, many procedures require multiple ablations to obtain the desired ablation margin. Multiple ablations are difficult to execute as there is no good way to visualize the overlapping areas or to distinguish ablated areas from non-ablated ones. Due to the lack of real-time image guidance, repeated insertions and positioning of the electrode may be required to hit the target lesion. Unablated tissue containing residual tumor may result in tumor recurrence. Residual tumor tissue often grows in scattered, nodular or eccentric patterns [6], making it difficult to treat after an initial ablation. Some studies have shown that complete necrosis of the tumor was achieved in only 29%-47.6% of lesions with diameters of 3.1 cm or greater [7].
2) Accurate real-time targeting
RFA typically relies on image guidance to manually place the radiofrequency needle within the tumor, such as ultrasound for guiding liver tumor ablation [8], and CT for guiding lung tumor ablation. However, ultrasound imaging can be problematic for monitoring the ablation region due to hyperechogenicity [7] and imaging artifacts [9], especially in the presence of a metallic RFA probe. In comparison, CT offers better imaging quality but increases the radiation exposure to the patient and potentially the operator. To avoid radiation, one solution is to employ a tracking system to obtain the relative position between ablation probe and target, by landmark registration to a pre-operative CT image [10]. This approach assumes the target organ deformation is acceptable for treatment purposes by using preoperative images for intra-operative treatment.
B. Prior art on computerized treatment planning for overlapping ablations
Planning of ablation procedures has been previously addressed by several groups. Baegert [11] employed a visibility graph method to optimize the entry point and avoid the critical structures, but did not address overlapping ablation issues. Overlapping spherical ablations have been studied by Dodd and Chen [12, 13]. Dodd [13] developed geometrical models to cover spherical tumors including a margin. Chen [12] explores an alternative approach by inscribing a regular polyhedron in the target sphere and circumscribing each face of the polyhedron with an ablation sphere. Yang et al [14] focused on robotic ablation system development and suggested a Voxel Growing algorithm for large tumor treatment. Villard et al. [11] used a local search optimization technique to place a single ablation.
Butz et al [15] addressed several key issues in cryotherapy: finding a feasible trajectory, ablating all cancerous cells, and minimizing the damage to healthy tissue. A treatment measure was proposed to guide the plan optimization procedures. However, the optimization of multiple overlapping ablations was not addressed.
We further extended the problem in this article to develop a clinically robust treatment planning system by incorporating realistic constraints that are encountered in clinical practice but were not fully addressed before, including: 1) relaxation of the assumption of spherical tumors, i.e., no pre-selected geometric models of particular arrangements on tumors and 2) minimize the number of probe insertions and ablations while covering all tumor regions. Most tumors are not spherical and it is often not practical to regularly space overlapping ablations due to other nearby anatomical structures that should be avoided. Also, the number of probe insertions that can be performed in practice is limited by time considerations and the risk of complications with each insertion.
Earlier investigations were also done by our group [10, 16] and two approaches were proposed for treatment planning. Powell’s method and simulated annealing algorithms [16] were used to find the solution for synthetic tumor data based on pre-computed mask volumes and Euclidean Distance Transform. In that work we were only concerned with tumor coverage and did not limit the number of probe insertions nor attempt to minimize damage to healthy tissue. Furthermore, the open source image-guided surgery toolkit (IGSTK) [10] was developed to provide guidance capability for needle-based interventions including vertebroplasty, lung biopsy, and lung radiofrequency ablation. In that work we performed an animal survival study for lung RFA and two navigation measures were evaluated in [10] including the execution time to reach target and distance from target. The mathematical model used for planning was similar to the current one, but we only provided the physician with a single “optimal” plan based on the problem formulation. We now build upon this prior work to develop a comprehensive planning, evaluation, and execution system. Instead of providing a single plan we present the physician with a number of feasible plans from which they select one based on their preference with regard to the importance of the quantitative evaluation measures.
III. Methods
A. System Overview
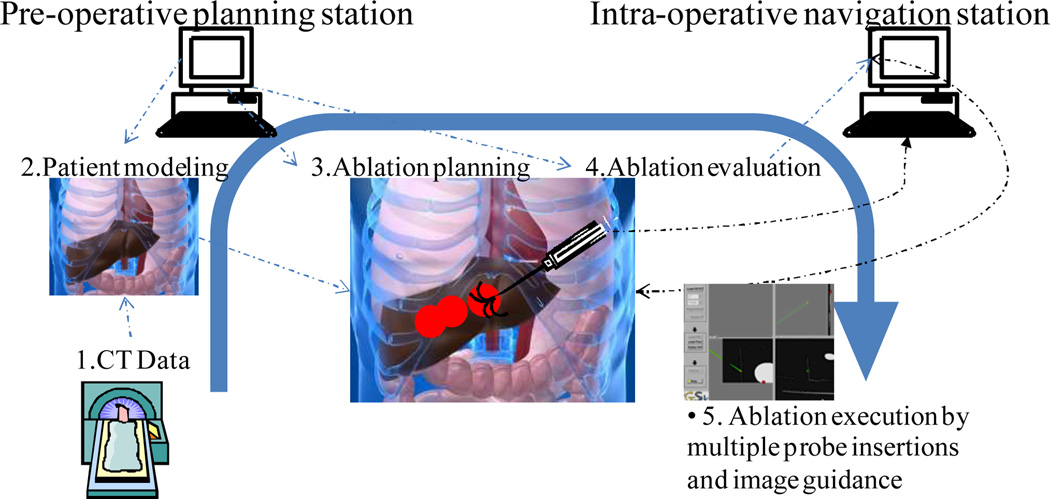
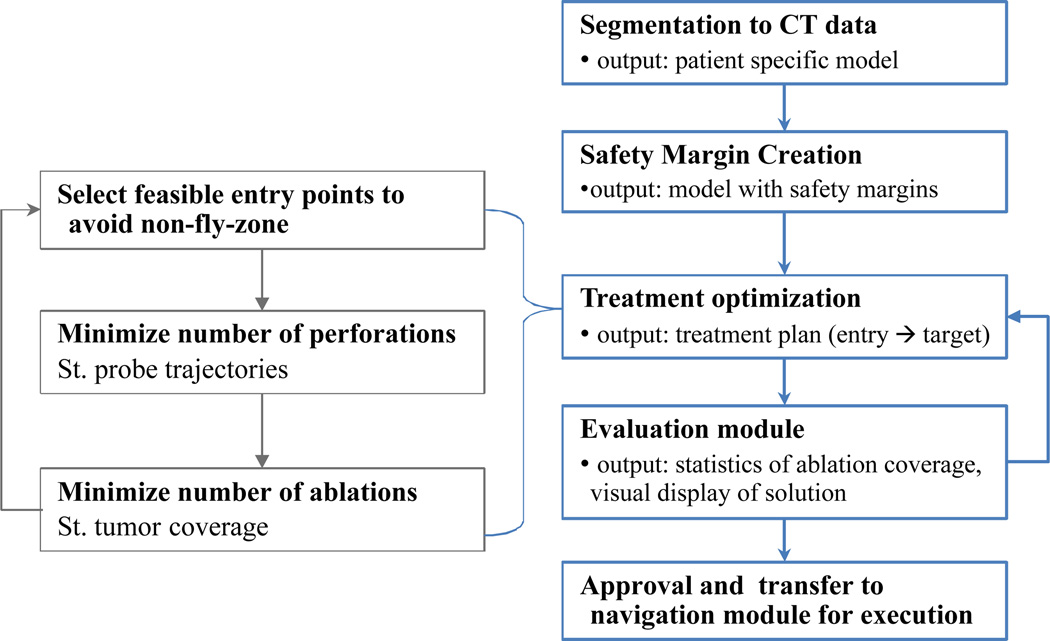
The overall system concept is shown in Fig. 1, which depicts two workstations, one for planning and one for navigation. Three key components are implemented including treatment optimization, treatment evaluation, and surgical navigation. Specifically, the planning workstation implements patient-specific modeling through segmentation, margin addition, optimization, and plan evaluation as illustrated in Fig. 2.
Fig. 1.
The overall system schematic of a planning and image-based navigation system for tumor ablation: First in (block 1) the CT data is acquired for diagnosis and for patient specific modeling (block 2), which is done using a semi-automatic segmentation approach. Given identified entry points, critical structures, and tumor regions, the ablation planning (block 3) is performed by the pre-operative planning station and the planned ablation spheres are overlaid in the scene with evaluation (block 4) on the coverage of the whole tumor while avoiding critical zone. Then, the surgical navigation (block 5) is performed using an image-guided surgery navigation platform (IGSTK, www.igstk.org) with fiducial marker registration to the preoperative CT scans.
Fig. 2.
Treatment planning flowchart.
Semi-automatic segmentation is used to identify the key structures including: the tumor; structures that should not be traversed such as the ribs, liver vasculature, and adjacent critical anatomical structures, collectively referred to as a no-fly-zone; and surgeon preferred entry points. The segmentation is performed using the ITK-SNAP program’s geodesic active contour method [17].
Additional margins are created for tumor tissue, ablation margin, and critical tissue, which includes safety margins that should be avoided. This is realized by applying a binary image morphological operator, dilation, to the segmented tumor and critical structures. The margin creation process can be described by the following morphological dilation operation.
Following the flowchart given in Fig. 2 we next describe the optimization based planning and the evaluation modules.
B. Treatment planning including path planning & overlapping optimization
As illustrated in Fig. 2, a semiautomatic treatment planning module for optimized probe placement is developed to guide the RFA ablation probe to treat the tumor segmented from CT data. For a given irregular liver tumor, the solution of a mathematical optimization problem provides 1) optimized probe trajectories, 2) location of multiple overlapping ablations in order to cover the tumor, and 3) a tumor-free margin, while avoiding the no-fly zone. Hence, the treatment planning is a multiple-objective optimization problem guided by these five clinical considerations:
Minimize the number of ablations. Fewer ablations mean shorter treatment times and less chance for complications.
Limit the number of probe insertions. This reduces the perforations to the liver capsule decreasing the chances of intraperitoneal haemorrhage.
Probe trajectory constraints. The model includes physical constraints imposed by ribs, vessels, and other organs which restrict possible trajectories.
Irregular shaped tumor coverage. The optimization uses segmented tumor data from patients and does not pre-suppose a particular tumor shape. This makes this planning method more general.
Minimize unnecessary damage to healthy tissue. The ablated volume from the overlapping probes is evaluated in the model with the goal of keeping healthy tissue damage as small as possible while fully covering the tumor and margin.
The optimization module uses integer programming techniques to model and solve the planning problem. Considering a voxelized tumor region, the possible choices for trajectories and ablations are represented by binary decision variables and the clinical constraints are modeled algebraically using linear inequalities [18]. This methodology has also been applied for radiotherapy treatment planning problems involving brachytherapy [19, 20].
Aiming at optimizing multiple measures of RFA planning performance simultaneously, we present a decomposition approach that solves this decision problem by repeatedly solving two integer programming models. Initially, a set of entry points is specified by the clinician and each entry point is tested for feasibility in avoiding direct puncture of critical structures to the tumor. Then, for each feasible entry point we define the following two optimization models: the Minimal Trajectories Integer Program (MTIP) to find a minimal number of trajectories necessary to cover the tumor, and the Minimal Ablations Integer Program (MAIP) to find a minimal number of ablations along the selected trajectories necessary to cover the tumor. In each of these integer programs we employ a weighted formulation to reduce healthy tissue damage, while keeping as main objective the minimization of the number of trajectories and ablations that are needed to guarantee coverage of the tumor and safety margin.
1) The Minimal Trajectories Integer Program (MTIP) is formulated as,
| (1) |
where xt is the binary decision variable indicating if a candidate trajectory is used or not, TR is the set of candidate trajectories, T is the set of tumor points, and M the set of margin points. Since individual trajectories may cover a partial tumor volume; the weight wt is used to indicate the penalty associated to each trajectory. By default, their values can all be set equal to 1 (or to any other constant). In this case, the objective function looks for a smallest set of directions that can cover the target region. Alternatively, a trajectory can be given additional weight if it covers a volume of healthy tissue. For example, we can choose wt = 1 + 0.01 pt, where pt is the proportion of healthy cells among the cells ablated if trajectory t were chosen. The portion of the weight associated with healthy tissue damage (0.01 pt) is orders of magnitude smaller than the unit weight assigned to using the direction t. This preserves the main goal of minimizing the total number of trajectories needed while penalizing the use of trajectories that ablate more healthy tissue. The constraints in the model assure that each tumor or margin point is covered by at least one suitable trajectory. The function K(t,c) = 1 if trajectory t can cover cell c, indicates the coverage provided by trajectory t. We model the region that a probe trajectory can ablate as a cylinder with axis along the trajectory and radius smaller than the radius of a single ablation.
2) The Minimal Ablations Integer Program (MAIP) is formulated as,
| (2) |
where A is the set of proposed ablation centers. The points in the set A are generated along the set of trajectories obtained from solving MTIP. As before, T is the set of tumor points, and M the set of margin points. The constraints in the model require that each tumor or margin point be covered at least once by an ablation. The weights wa can be chosen to minimize the number of ablations as main goal and, simultaneously, reduce healthy tissue damage by giving more weight to an ablation if it covers a larger volume of healthy tissue. Similar to the weights in MTIP, we can choose wa = 1 + 0.01 pa, where pa is the proportion of healthy cells among the cells ablated if an ablation centered at point a is selected. By using the condition ||a–c|| < R, we are assuming that ablations are spherical. We did this because spheres are commonly used to model ablations in the literature and it also simplified the software implementation for our computational experiments. However, ablations that vary arbitrarily in shape at each possible placement point can just as well be represented in the MAIP model. Finally, we note that finding an optimal solution to an integer program can be computationally very challenging. To solve our integer programming models, we used Gurobi version 4.0.2, a commercial optimization software package with a state-of-the-art implementation of the branch and bound algorithm [18]. Since the original decision problem was decomposed into two sub-problems, the solutions that we obtain are not guaranteed to be globally optimal. Our computational experiments, discussed below, show that the solutions obtained are of good quality and useful in a clinical setting.
C. Evaluation Measures
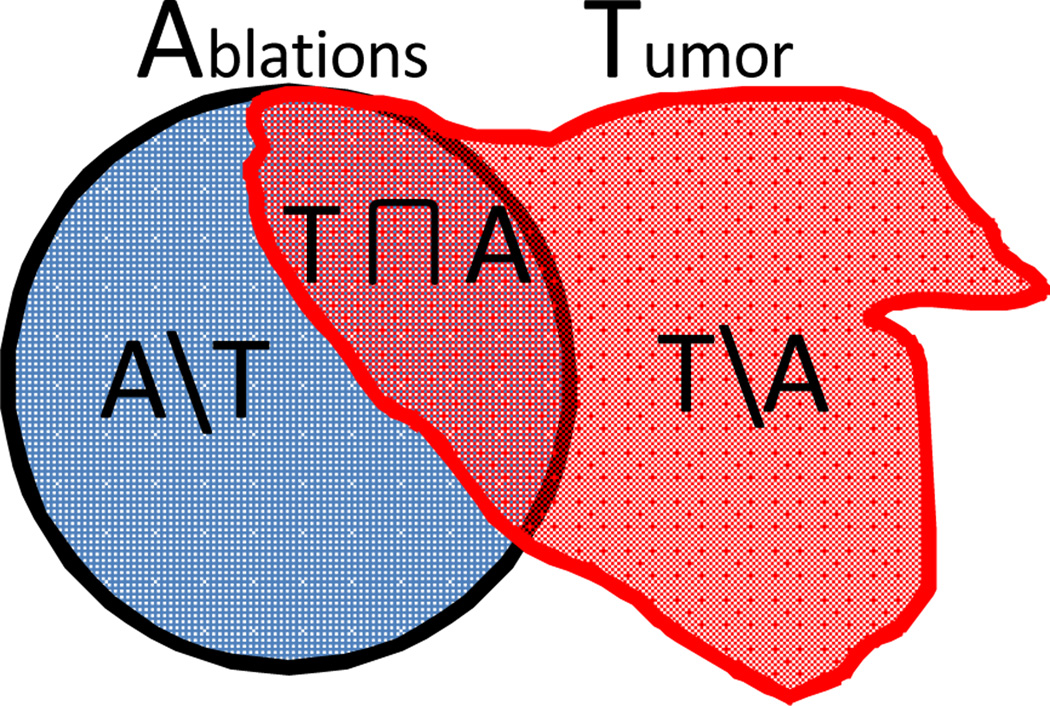
After the candidate plans are generated by the optimizer, statistical evaluation on the quality of the plans is further developed. Given the multiple spherical planned ablations and tumor model as illustrated in Fig. 3, the evaluation measures are defined by
Ablation Coverage (AC): AC = A∩T/T;
Unablated Percentage (UP): UP = (T\A)/T;
-
Over-Ablation (OA) Volume:
OA = (Ablation Volume)* (A\T)/A, in mm3;
NA: Number of Ablations;
NT: Number of Trajectories.
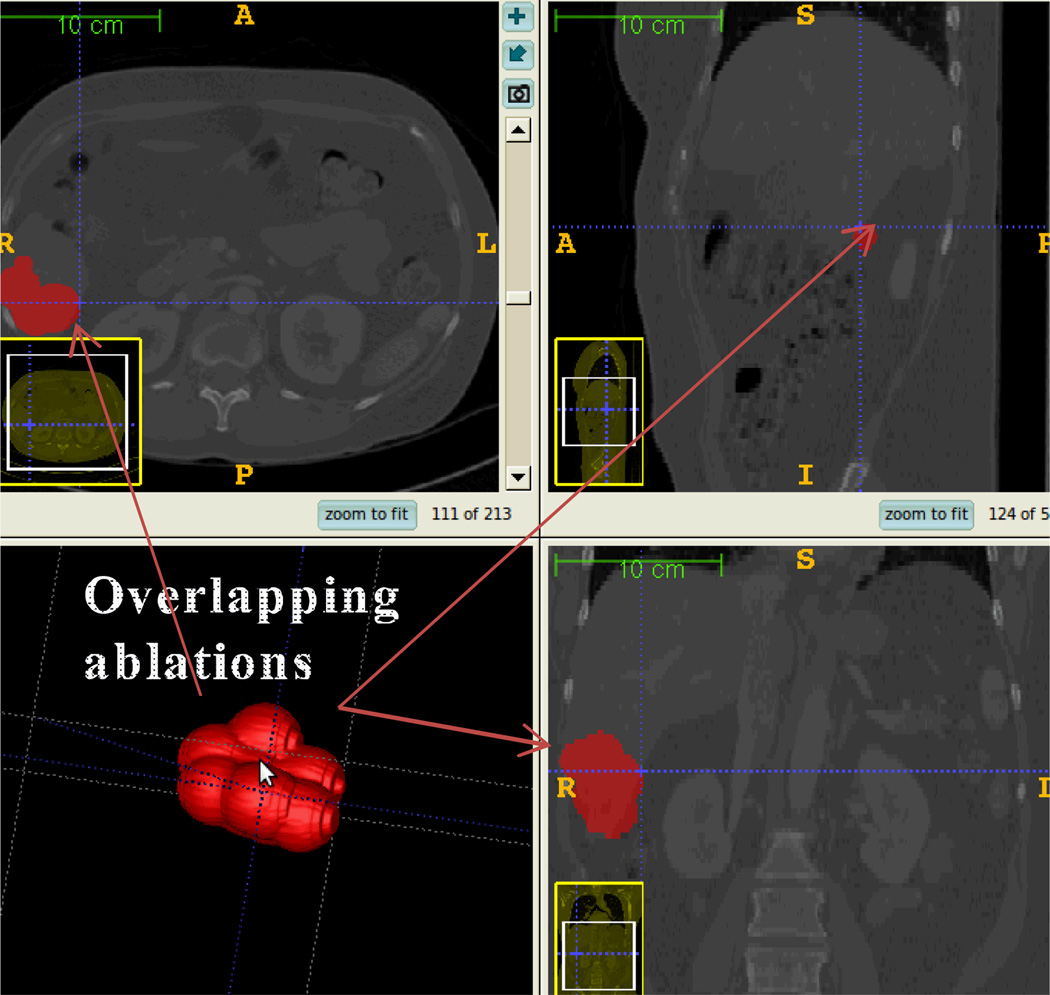
Assuming each ablation covers a spherical region, the model with multiple ablations can be generated from the treatment plan as illustrated in Fig. 4.
Fig. 3.
Venn diagram illustrating the evaluation measures by regional overlapping of Ablations (A) and Tumor (T).
Fig. 4.
Model of multiple overlapping ablations generated from treatment plan
IV. Experimental Evaluation
A. Phantom study
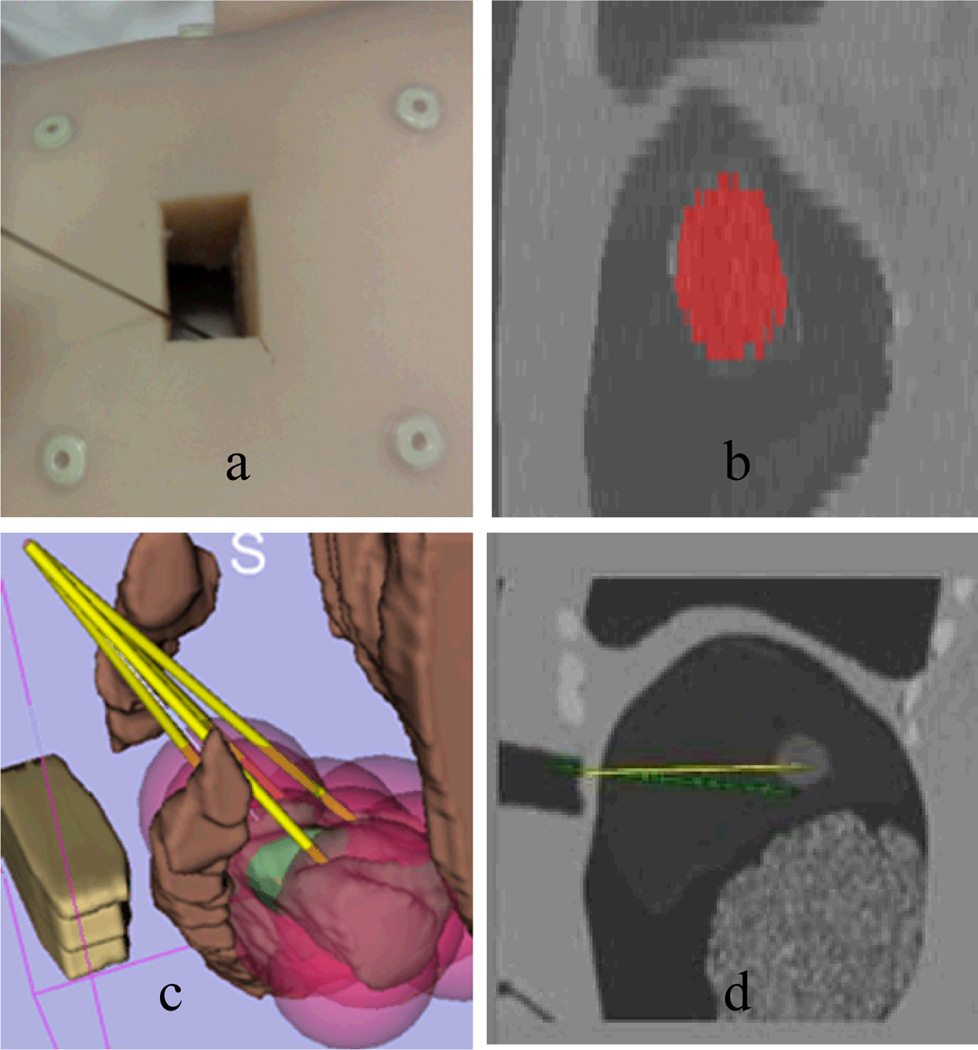
An abdominal CT of a torso phantom (Fig 5. a) was obtained in the Radiology Department. Then a semiautomatic segmentation (Fig. 5.b) was done to obtain an anatomical model, particularly, the structures of tumor, ribs, entry points and no-fly-zone. Given identified structures, the planning algorithm generates needle trajectories and ablation locations represented by pink spheres (see electronic version) to show the coverage on the whole tumor. Finally, the intervention is carried out using a navigation guidance program based on the open source Image-Guided Surgical Toolkit (IGSTK), with electromagnetic tracking of the probes using the NDI Aurora tracking system.
Fig. 5.
Illustration of the ablation planning and navigation procedures. a). Phantom preparation with markers; b). Chest CT scan and tumor segmentation in red; c). Treatment planning (yellow line: RFA probe; green: tumor; pink sphere: ablations; brown: non-fly-zone; green: tumor to be ablated) d). navigation screenshot in IGSTK
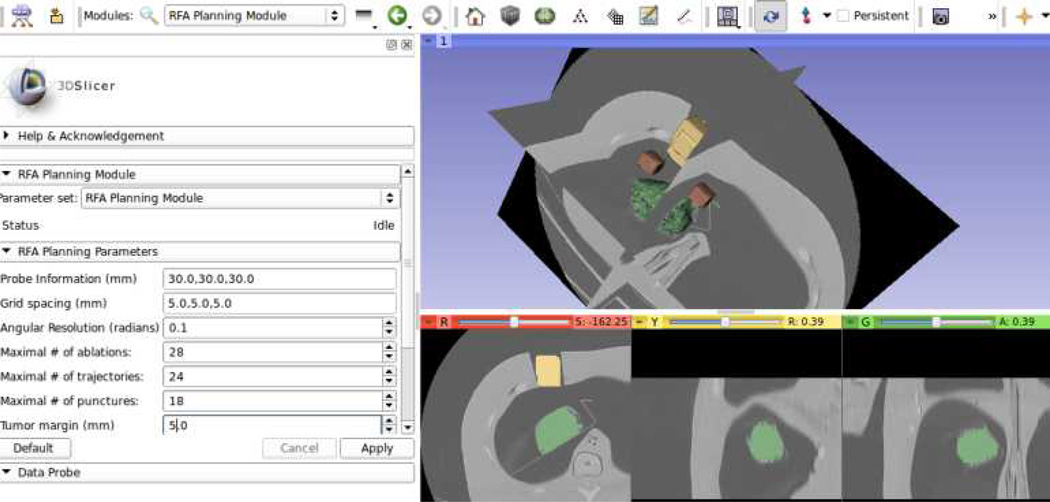
The planning system allows the user to fix the values of key decision variables in the model prior to executing the optimization algorithm, as shown in Fig. 6. Prior to the execution of the optimization algorithm, it allows the user to manually input criteria that must be satisfied by the solutions, such as probe information, patient sample data spacing, maximal number of ablations, maximal number of trajectories, maximal number of punctures, and tumor margin. This feature is also used to iteratively update the treatment plan after each actual insertion and ablation is realized.
Fig. 6.
Open source RFA planning module implemented in 3D Slicer (www.slicer.org)
For simulation purposes, two types of simulated tumors were used, including a spherical one and a cylindrical one, which do not represent real pathological examples but demonstrate algorithmic feasibility. The ablation probe used in this experiment has an ablation sphere of 30 mm in diameter.
1) Numerical evaluation of phantom study
For a simulated spherical tumor with 35 mm diameter, the planning system generated 4 candidate treatment plans with an average ablation coverage rate of 99% and over-ablation rate of 40% as shown in TABLE II. For a simulated cylindrical shape tumor with 65 mm long and 45 mm diameter, 10 treatment plans were generated with an average ablation coverage rate of 98% and over-ablation rate of 44%.
TABLE II.
Statistical Measures for the Candidate Plans for Tumor Size of 35 Mm Diameter
| Plan ID | AC | OA (mm3) | NA | NT |
|---|---|---|---|---|
| 1 | 0. 991 | 46580 | 6 | 3 |
| 2 | 0.984 | 39838 | 6 | 3 |
| 3 | 0.988 | 47131 | 7 | 3 |
| 4 | 0.987 | 44899 | 7 | 3 |
2) Remarks
The phantom experiments demonstrate that the planning approach is able to generate feasible treatment plans which can cover the whole tumor plus the margin effectively. Multiple ablations can be constrained along the same trajectory to reduce the number of punctures to the liver capsule. Note that while these experiments demonstrate the feasibility of the proposed approach for large tumors, such a large number of ablations would not be practical in current clinical practice.
B. Animal study
A swine study was completed to validate the system concept and evaluate the feasibility of using the system in the clinical environment.
1) Preoperative experiment setup
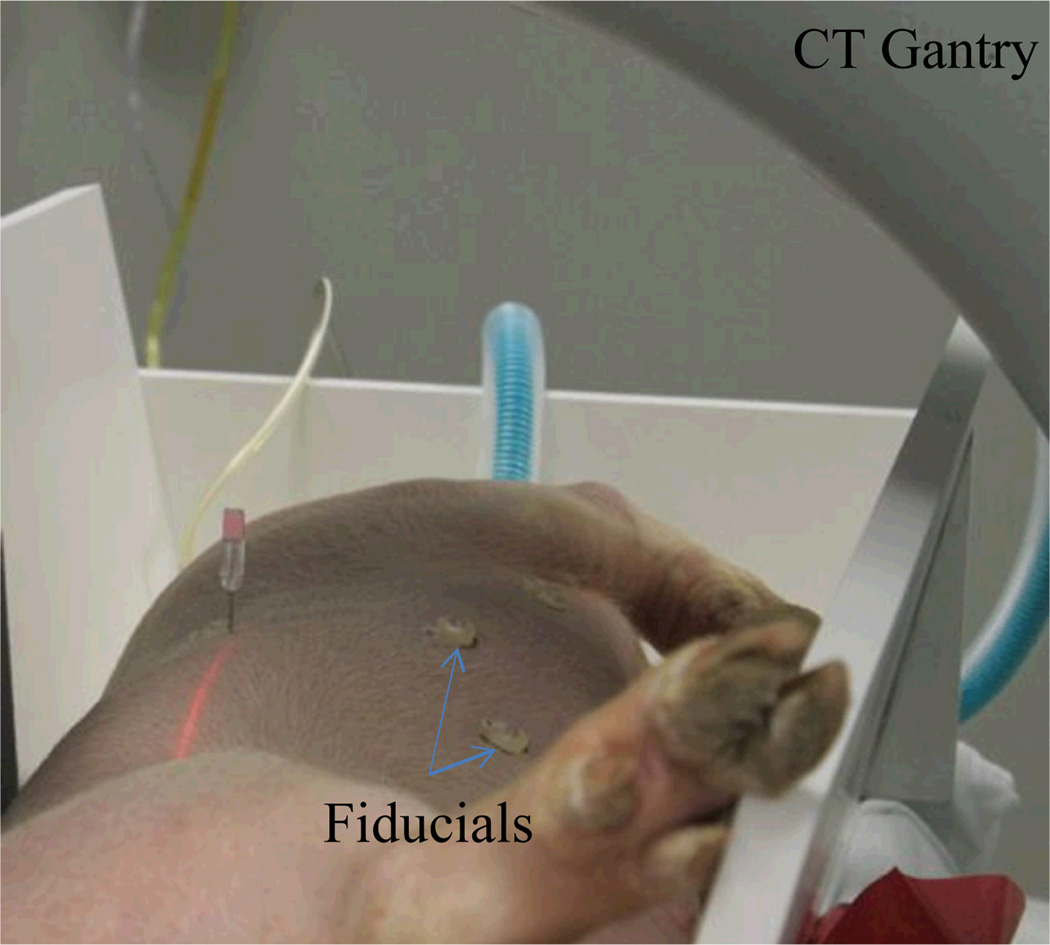
For this feasibility study, a 40 kg swine was used under an approved animal protocol in accordance with the Guide for the Care and Use of Laboratory Animals recommended by the US National Institutes of Health. The in vivo tumor-mimicing model was prepared using a mixture of agarose, cellulose, glycerol, and methylene blue as described in [21]. Under general anesthesia, an artificial tumor was created by injecting the prepared agar in the liver percutaneously under CT guidance. Six surface fiducial markers were placed on the abdomen for later use in paired-point registration. A volumetric CT scan was then performed using a Siemens Somatom Emotion 16 CT Scanner system to obtain the pre-operative images for planning and navigation. The pre-operative experiment setup is shown in Fig. 7. The planning computer was equipped with an Intel quad-core CPU and 8 GB memory without GPU acceleration.
Fig. 7.
Preoperative experiment setup including animal placed in V-trough under general anaesthesia, fiducial marker placement and CT scan.
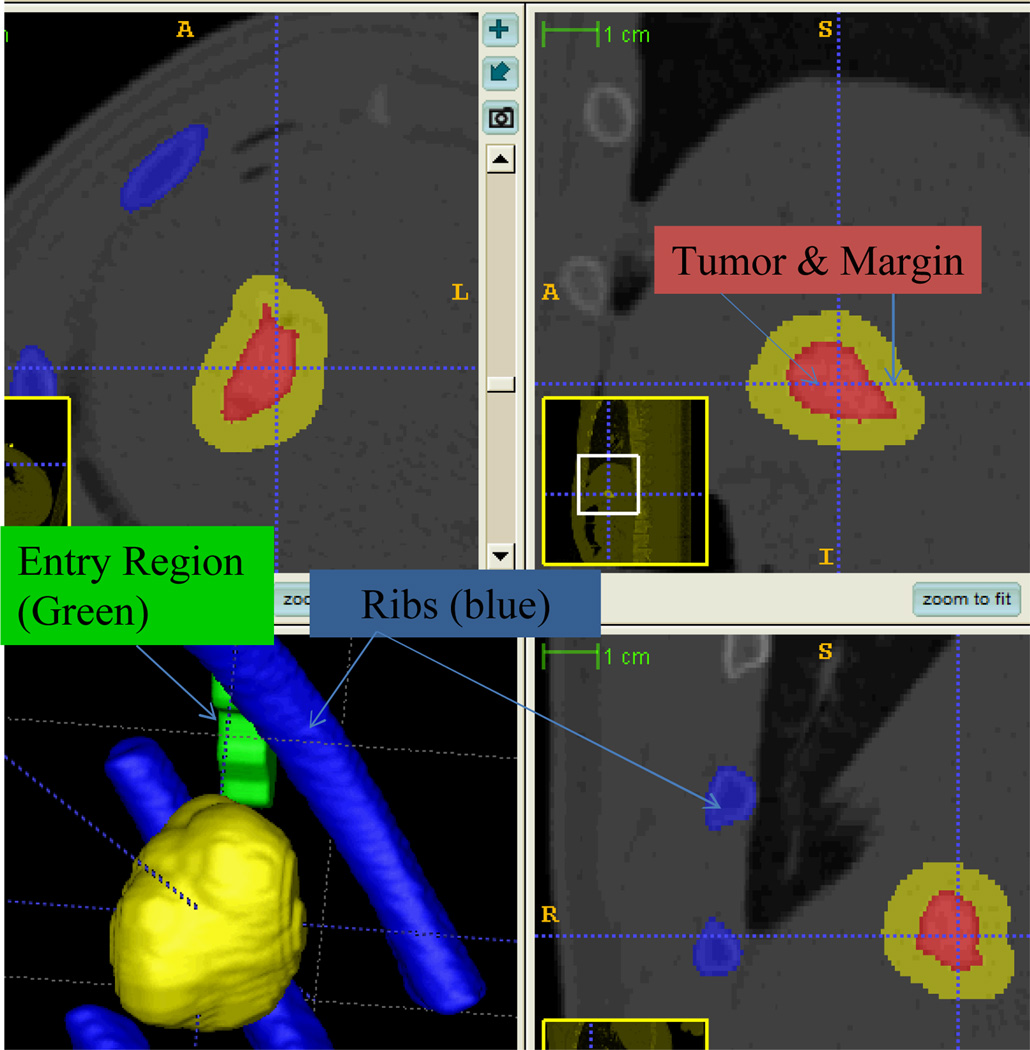
Similar to the workflow of the phantom study described earlier, the CT data with dimension of 512×512×301 and spacing of 0.58×0.58×1 mm were then transferred to the planning workstation, where the segmentation and ablation planning were performed. The semi-automatic segmentation took 6 minutes to generate the models of tumor, rib, and entry points (in Fig. 8) as validated by the radiologists. An ablation margin of 5 mm [22] was created around the tumor. This results in an ablation region whose long-axis is approximately 35mm, which requires multiple ablations for complete coverage.
Fig. 8.
Preoperative CT scan overlaid by segmentation of tumor region, ribs, preferred ablation probe entry region and safety margin. The region with red colour denotes the created tumor within swine liver. Green colour represents the entry region and blue for no-fly-zone.
2) Treatment planning experiment results
Interventional planning was then applied to the preoperative model of key anatomical structures, such as tumor, safety margin, ribs, and entry regions. Together with visualization and ablation coverage evaluation, the whole planning procedure took 3 minutes and generated 15 candidate plans as shown in TABLE III.
TABLE III.
Statistical Measures For The Candidate Plans For Simulated Tumor Size Of 25 Mm Diameter
| Plan ID | AC | OA (mm3) | NA | NT |
|---|---|---|---|---|
| 1 | 0.980 | 8067 | 3 | 2 |
| 2 | 0.989 | 6710 | 2 | 2 |
| 3 | 0.989 | 6710 | 2 | 2 |
| 4 | 0.981 | 7497 | 2 | 2 |
| 5 | 1 | 8337 | 2 | 2 |
| 6 | 0.999 | 8452 | 2 | 2 |
| 7 | 0.999 | 8416 | 2 | 2 |
| 8 | 0.999 | 8598 | 2 | 2 |
| 9 | 0.986 | 8403 | 2 | 2 |
| 10 | 0.992 | 6910 | 2 | 2 |
| 11 | 0.992 | 6910 | 2 | 2 |
| 12 | 0.996 | 8653 | 2 | 2 |
| 13 | 0.995 | 8368 | 2 | 2 |
| 14 | 0.991 | 6630 | 2 | 2 |
| 15 | 0.980 | 8067 | 2 | 2 |
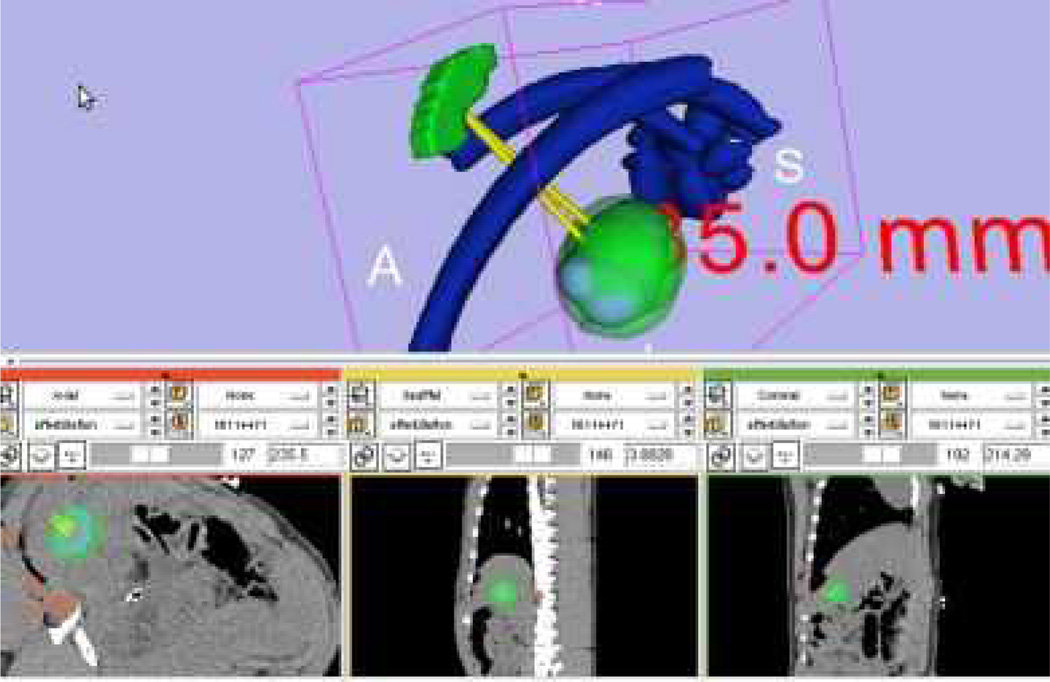
The ablation coverage on the tumor is 100%, average coverage on the tumor with margin is 99.05%, average over-ablation rate is 45.99%, and 2 ablations were required. This validated the proposed planning algorithm and was confirmed by the radiologist. Fig. 9 visualizes the planned ablation coverage in 3D Slicer [23] using our implemented multiple plan visualization module, which can load in multiple plans for visual comparison. The visibility of individual candidate plans can be toggled on or off in 3D view and slice view for comparison. Within the same spatial coordinate system, the raw CT DICOM series, the multiple treatment plans, the segmented structures and measurements can be overlaid in the same workspace, which is preferred by the radiologists.
Fig. 9.
Treatment plan visualization module for surgeons to evaluate the plan before execution. The long axis is approximately 35 mm calculated by Slicer’s measurement module (www.slicer.org). The planned ablation spheres were overlaid onto the pre-operative CT images as shown in the three lower slice views, which ,makes it easy for the Radiologist to examine slice-by-slice performance.
3) Ablation under image guidance
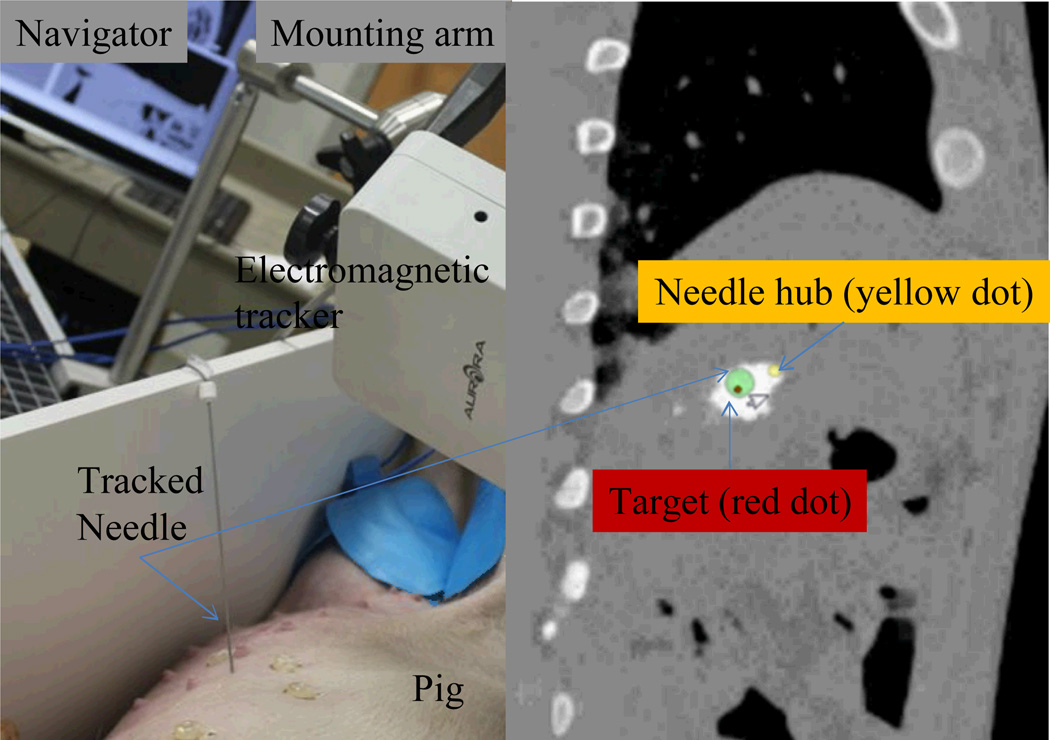
The ablation plan with highest tumor coverage rate was selected for execution under image guidance. The navigation experiment setup is shown in Fig. 10, which shows that electromagnetic tracking system is used in image guidance. The tracked needle was registered to pre-operative image space via paired-point registration with a fiducial registration error of 3.8 mm. The navigation module was implemented based on IGSTK and the needle pose (position and orientation) relative to image space was presented in the navigator. A projected view is shown in Fig. 10, which denotes the relative orientation of needle hub, needle tip and target point in image space. The 16-gauge tracked trocar and needle was then navigated to the target lesion. The ablation probe (Boston Scientific, Natick, MA) was inserted along the trocar to the target, and then the radiofrequency ablation was applied by turning on the radiofrequency generator.
Fig. 10.
The navigation experiment setup (left) and the navigator projected view (right)
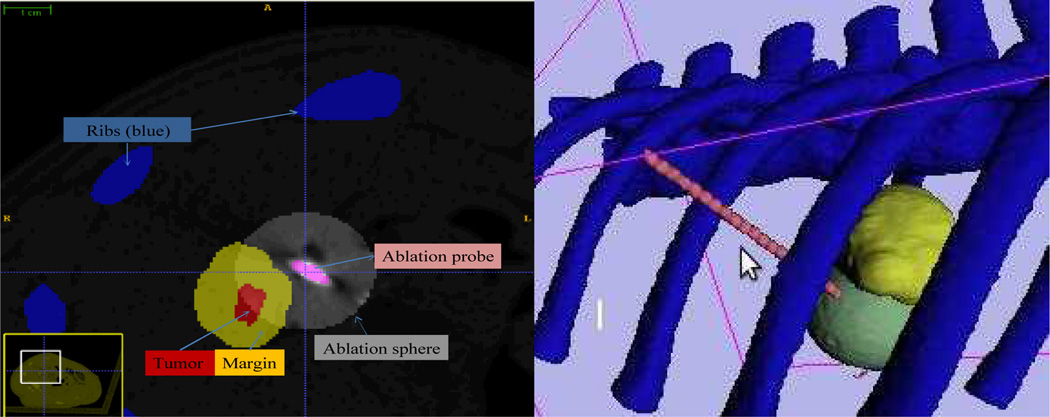
After the second ablation was completed, the probe was left in place and the swine was moved back to the CT scanner for a post-operative evaluation. The scan has an image dimension of 512 by 512 by 155 slices and spatial spacing of 0.67 by 0.67 by 1 mm. Due to the pig position and acquisition parameters had been changed, the postoperative scan could not be directly overlaid to preoperative scan or treatment plans for computation. Alternatively, we segmented the tumor and applied a safety margin again. Meanwhile, we manually identified the ablation sphere with a radius of 15 mm as shown in Fig. 12 (left), which shows overlapping region between the tumor margin and actual ablations. The target ablation coverage by the second ablation is 34% by calculation of the ratio of overlapping ablation over the total tumor and margin volume. Fig. 12 (right) demonstrates that the second needle insertion avoids the ribs and reaches the target tumor.
Fig. 12.
(Left) Postoperative CT scan to check the spatial relationship between the ablation probe with the region of tumor and safety margin. The virtual ablation sphere is generated via image processing cantered at the probe tip and then overlaid onto the postoperative CT scan. The distance of delivered probe to tumor surface is approximately 5 mm. (Right) Postoperative evaluation on the second accomplished radiofrequency ablation. Yellow colour represents the tumor surrounded by safety margin and the sphere denotes the virtual ablation.
C. Discussions
The planning module yielded 100% coverage over the large tumor using multiple ablations and can generate multiple feasible plans (e.g., TABLE III for animal study) with evaluation parameters for physicians to choose. Both numerical evaluation and visual evaluation (e.g., Fig. 9) can be performed to determine the execution plan from those candidates. The number of trajectories and ablations are reduced to a minimum at the same time. In our previous approach for planning ablations for lung tumors [10], we only generated an "optimal" solution, which removed the specific perspective of the interventionalist. We now provide the physician with multiple feasible plans which satisfy to some degree the optimization requirements. This is a cooperative approach to planning in which the computational burden is automated, and the clinician selects from a small set of plans which satisfy the clinical criteria such as maximum number of trajectories, maximum number of ablations, and diameter ablation spheres etc.
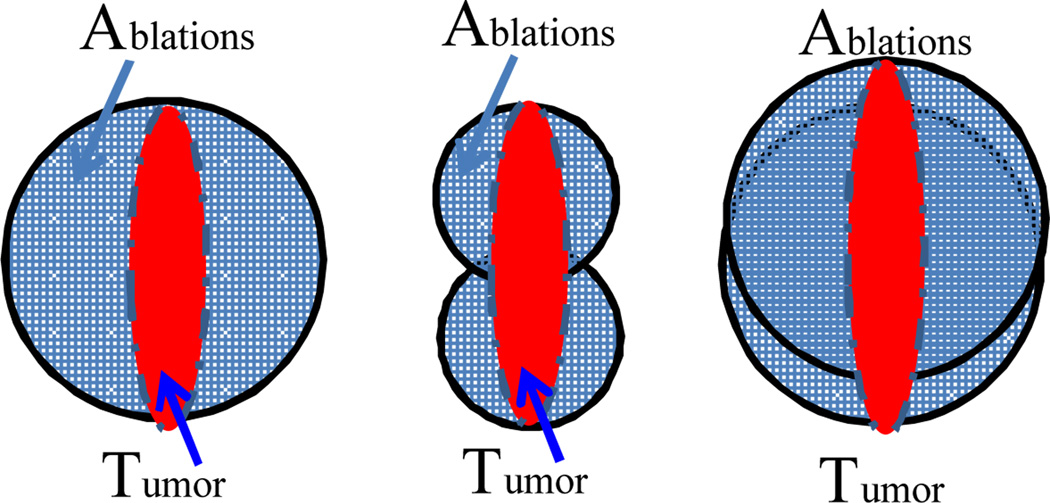
This approach yields comprehensive and clinically feasible planning results. Given the requirement of 100% coverage on the tumor, the over-ablation rate is found relevant to the size and shape of the tumor, the size of ablation probe and the maximum number of ablations. As illustrated in Fig. 13, even one ablation can result in a high over-ablation rate if the tumor is far smaller than the spherical coverage. Similarly in the animal study, the long-axis of the ellipsoidal tumor is slightly bigger than probe diameter and the short axis is much shorter than the probe diameter, which can result in the two ablations covering more healthy tissue. The over-ablation rate can be decreased using a smaller probe size and a larger number of ablations. Hence, physicians can consider the trade-off between over-ablation and the allowable number of ablations.
Fig. 13.
Illustration of the factors effecting over-ablation including tumor shape and size, choices of ablation probe sizes, and maximum number of ablations. Left figure shows the bigger probe used only 1 ablation to cover the tumor, resulting in over-ablation of more than 60%. Middle figure achieves less over-ablation rate but uses more ablations. Right figures demonstrate the similar case as animal study where the balance of probe size and number of ablations needs to be determined.
The navigation module based on electromagnetic tracking system is susceptible to interference from the CT scanner. In earlier phantom studies on the CT table directly, the fiducial registration error was up to 10 mm, which is too large for accurate targeting. Once we moved the phantom to a metal-free environment the fiducial registration error could be decreased to 1 mm and yield accurate targeting performance. For this reason, in our animal study the swine was moved to a table in the CT room away from the CT gantry, where we were able to obtain a registration error from 3.6 to 3.9 mm for several trials. This makes the postoperative CT evaluation difficult for each ablation, as the animal cannot be moved back to CT and moved out for performing the subsequent planned ablations without potentially changing its position relative to the V-trough. The final targeting error is difficult to evaluate as the planned trajectory cannot be mapped to the postoperative image coordinate system. Instead, we measure the distance from the probe to the tumor margin region surface in 3D-Slicer and found the distance from the probe to the closest tumor surface was approximately 5 mm. For the future study, a pre-operative image to post-operative image registration method can be developed to overcome this limit in ablation evaluation.
According to the planning results and evaluation results on the second ablation, we show the feasibility of semiautomatic planning and navigation procedures overseen by the radiologist. The planning results yield highly reliable and feasible plans which can avoid critical zones and cover both tumor and margin effectively. In the clinical practice of our Interventional Radiologist, RFA probe placement is performed under CT-fluoroscopy in a freehand manner. The probe repositioning is likewise performed by the mental triangulation of the Interventional Radiologist. After the initial ablation, the tissue imaging characteristics around the tumor change in real time due to physiologic phenomena such as hyperemia, nitrogen gas release during ablation, etc. The tumor margins almost always become obscured. Therefore it almost impossible for the Interventional Radiologist to plan overlapping ablations by hand, which motivated the integrated system development described here.
The presented ablation planning and navigation approach provides a comprehensive solution for treating large tumors using RFA, while keeping the physician in the loop. The planning system uses a patient specific model and an optimization approach to produce potential plans which satisfy multiple clinical criteria to certain degrees. The clinicians then select the plan which they judge to be most appropriate. The navigation system provides the precise guidance required to carry out the plan, which currently is all but impossible to do using the standard free hand technique.
V. Conclusion
A new treatment planning and navigation system was developed for liver tumor ablations, particularly for multiple overlapping radiofrequency ablations. The treatment planning is composed of needle-like probe trajectory planning and overlapping ablation planning. Multiple-objective optimization for probe insertions incorporates both clinical and technical constraints. Additional validation is required prior to introducing our system into a clinical trial. Systematic evaluations were presented to check the candidate plans by both statistical measures and visualization. The presented semiautomatic planning and guidance method can be applied to tumor ablation in other organs (e.g., lung tumor) using the proposed techniques. In its current form the system in combination with a phantom can also be used as a training aid for interventional radiologists.
Fig. 11.
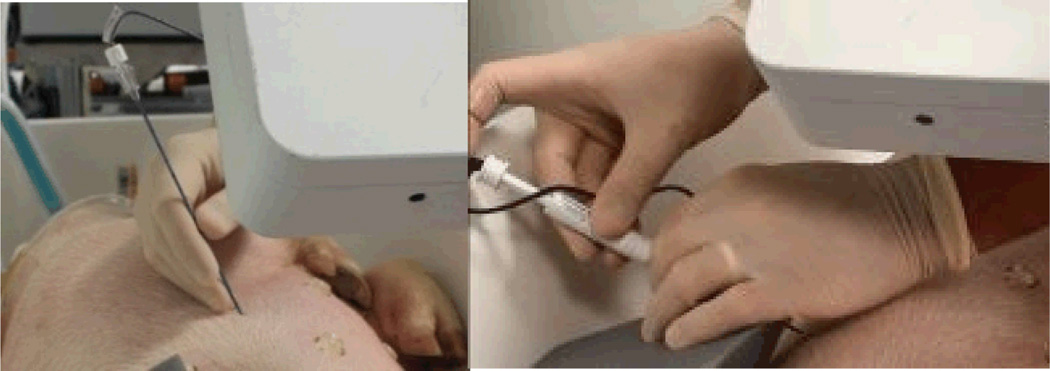
Procedure of ablation probe deployment: tracked needle insertion on the left picture, and probe deployment on the right picture.
TABLE I.
Nomenclature
| Symbol | Quantity | Notes |
|---|---|---|
| R | RFA probe radius | in millimeter, 15 mm in this article |
| T | Set of tumor points | denoted by a set of spatial voxels |
| TR | Set of trajectories, t | |
| M | Set of ablation margin points | denoted by a set of spatial voxels |
| K(t,c) | =1 if trajectory t can cover cell c | indicates the coverage provided by trajectory t |
| c | Cell to be ablated | denoted by a spatial voxel |
| ya | Binary variable corresponding to an ablation centered at a | ya = 1, if ablation centered at a; ya = 0, otherwise |
| xt | Binary decision variable corresponding to trajectory t | xt =1, if trajectory t is selected; xt =0, otherwise |
| A | Set of candidate points for ablation centers |
Acknowledgment
This work was supported in part by the U.S.A. National Institutes of Health (NIH) under Grant 7R01CA124377-05.
The authors gratefully acknowledge the assistance of Laurent Chauvin, Atsushi Yamada and Steve Piper from Brigham Women's Hospital and Harvard Medical School in using 3D-Slicer; for the useful discussions with colleagues Patrick Cheng, Renhui Gong and Ozgur Guler in the IGSTK implementation: and from Jan Gnadt and Robin Tucker in the Georgetown University animal care facility.
Contributor Information
Hongliang Ren, Email: hren@cnmc.org, ren@nus.edu.sg.
Enrique Campos-Nanez, Email: ecamposn@gmail.com.
Ziv Yaniv, Email: zyaniv@cnmc.org.
Filip Banovac, Email: banovac@isis.georgetown.edu.
Hernan Abeledo, Email: abeledo@gwu.edu.
Nobuhiko Hata, Email: hata@bwh.harvard.edu.
Kevin Cleary, Email: kcleary@cnmc.org.
References
- 1.Siegel R, Naishadham D, Jemal A. Cancer statistics, 2012. CA: a cancer journal for clinicians. 2012;62(1):10–29. doi: 10.3322/caac.20138. [DOI] [PubMed] [Google Scholar]
- 2.Howenstein M, Sato K. Complications of radiofrequency ablation of hepatic, pulmonary, and renal neoplasms. Seminars in interventional radiology. 2010;27(03. Thieme):285–295. doi: 10.1055/s-0030-1261787. [DOI] [PMC free article] [PubMed] [Google Scholar]
- 3.Abdalla E, Vauthey J, Ellis L, Ellis V, Pollock R, Broglio K, Hess K, Curley S. Recurrence and outcomes following hepatic resection, radiofrequency ablation, and combined resection/ablation for colorectal liver metastases. Annals of surgery. 2004;239(6):818. doi: 10.1097/01.sla.0000128305.90650.71. [DOI] [PMC free article] [PubMed] [Google Scholar]
- 4.Simon TG, Dupuy DE. Radiofrequency ablation, microwave ablation, and cryoablation for lung tumors. In: Mueller P, Adam A, editors. Interventional Oncology. New York: Springer; 2012. pp. 149–159. [Google Scholar]
- 5.McWilliams JP, Yamamoto S, Raman SS, Loh CT, Lee EW, Liu DM, Kee ST. Percutaneous ablation of hepatocellular carcinoma: current status. Journal of vascular and interventional radiology: JVIR. 2010;21(8 Suppl):S204. doi: 10.1016/j.jvir.2009.11.025. [DOI] [PubMed] [Google Scholar]
- 6.Goldberg S, Grassi C, Cardella J, Charboneau J, Dodd G, II, Dupuy D, Gervais D, Gillams A, Kane R, Lee F, Jr, et al. Image-guided tumor ablation: Standardization of terminology and reporting criteria1. Radiology. 2005;235(3):728–739. doi: 10.1148/radiol.2353042205. [DOI] [PMC free article] [PubMed] [Google Scholar]
- 7.Livraghi T, Goldberg S, Lazzaroni S, Meloni F, Ierace T, Solbiati L, Gazelle G. Hepatocellular carcinoma: Radio-frequency ablation of medium and large lesions1. Radiology. 2000;214(3):761–768. doi: 10.1148/radiology.214.3.r00mr02761. [DOI] [PubMed] [Google Scholar]
- 8.Nesher N, Ben Haim M, Pevni D, Kessler A, Paz Y. Ultrasound-guided, video-assisted transdiaphragmatic radiofrequency ablation for primary liver malignancy or metastatic nodules. Innovations: Technology and Techniques in Cardiothoracic and Vascular Surgery. 2011;6(5):337. doi: 10.1097/IMI.0b013e3182362738. [DOI] [PubMed] [Google Scholar]
- 9.Stoll J, Ren H, Dupont PE. Passive markers for tracking surgical instruments in real-time 3D ultrasound imaging. IEEE Transactions on Medical Imaging. 2012 doi: 10.1109/TMI.2011.2173586. in press. [DOI] [PMC free article] [PubMed] [Google Scholar]
- 10.Yaniv Z, Cheng P, Wilson E, Popa T, Lindisch D, Campos-Nanez E, Abeledo H, Watson V, Cleary K, Banovac F. Needle-based interventions with the image-guided surgery toolkit (igstk): From phantoms to clinical trials. Biomedical Engineering, IEEE Transactions on. 2010;57(4):922–933. doi: 10.1109/TBME.2009.2035688. [DOI] [PubMed] [Google Scholar]
- 11.Baegert C, Villard C, Schreck P, Soler L, Gangi A. Trajectory optimization for the planning of percutaneous radiofrequency ablation of hepatic tumors. Computer Aided Surgery. 2007;12(2):82–90. doi: 10.3109/10929080701312000. [DOI] [PubMed] [Google Scholar]
- 12.Chen M, Yang W, Yan K, Zou M, Solbiati L, Liu J, Dai Y. Large liver tumors: Protocol for radiofrequency ablation and its clinical application in 110 patients mathematic model, overlapping mode, and electrode placement process. Radiology. 2004;232(1):260–271. doi: 10.1148/radiol.2321030821. [DOI] [PubMed] [Google Scholar]
- 13.Dodd G, Frank M, Aribandi M, Chopra S, Chintapalli K. Radiofrequency thermal ablation. American Journal of Roentgenology. 2001;177(4):777–782. doi: 10.2214/ajr.177.4.1770777. [DOI] [PubMed] [Google Scholar]
- 14.Yang L, Wen R, Qin J, Chui C, Lim K, Chang S. A robotic system for overlapping radiofrequency ablation in large tumor treatment. IEEE/ASME Transactions on Mechatronics. 2010;15(6):887–897. [Google Scholar]
- 15.Butz T, Warfield S, Tuncali K, Silverman S, van Sonnenberg E, Jolesz F, Kikinis R. Pre- and intra-operative planning and simulation of percutaneous tumor ablation. 3:317–326. 10 2000. [Google Scholar]
- 16.Zhang H, Banovac F, Munuo S, Campos-Nanez E, Abeledo H, Cleary K. Treatment planning and image guidance for radiofrequency ablation of liver tumors. Proceedings of SPIE. 2007;6509:650922. [Google Scholar]
- 17.Yushkevich P, Piven J, Hazlett H, Smith R, Ho S, Gee J, Gerig G. User-guided 3D active contour segmentation of anatomical structures: significantly improved efficiency and reliability. Neuroimage. 2006;31(3):1116–1128. doi: 10.1016/j.neuroimage.2006.01.015. [DOI] [PubMed] [Google Scholar]
- 18.Wolsey L. Integer programming. New York: Wiley; 1998. [Google Scholar]
- 19.Lee E, Gallagher R, Silvern D, Wuu C, Zaider M. Treatment planning for brachytherapy: an integer programming model, two computational approaches and experiments with permanent prostate implant planning. Physics in Medicine and Biology. 1999;44:145. doi: 10.1088/0031-9155/44/1/012. [DOI] [PubMed] [Google Scholar]
- 20.D’Souza W, Meyer R, Thomadsen B, Ferris M. An iterative sequential mixed-integer approach to automated prostate brachytherapy treatment plan optimization. Physics in medicine and biology. 2001;46:297. doi: 10.1088/0031-9155/46/2/303. [DOI] [PubMed] [Google Scholar]
- 21.Scott D, Young W, Watumull L, Lindberg G, Fleming J, Rege R, Brawn R, Jones D. Development of an in vivo tumor-mimic model for learning radiofrequency ablation. Journal of Gastrointestinal Surgery. 2000;4(6):620–625. doi: 10.1016/s1091-255x(00)80112-2. [DOI] [PubMed] [Google Scholar]
- 22.Yamakado K, Nakatsuka A, Ohmori S, Shiraki K, Nakano T, Ikoma J, Adachi Y, Takeda K. Radiofrequency ablation combined with chemoembolization in hepatocellular carcinoma: treatment response based on tumor size and morphology. Journal of vascular and interventional radiology. 2002;13(12):1225–1232. doi: 10.1016/s1051-0443(07)61969-1. [DOI] [PubMed] [Google Scholar]
- 23.Pieper S, Halle M, Kikinis R. IEEE International Symposium on Biomedical Imaging: Nano to Macro, 2004. IEEE; 2004. 3D slicer; pp. 632–635. [Google Scholar]


