Abstract
A deregulated epigenome contributes to the transformed phenotype of Mantle Cell Lymphoma (MCL). This involves activity of the PRC (polycomb repressive complex) 2, containing three core proteins EZH2, SUZ12 and EED, in which the SET domain of EZH2 mediates the histone methyltransferase activity. This induces trimethylation (3Me) of lysine (K)-27 on histone H3 (3MeK27H3), regulates the expression of HOX genes and promotes cell proliferation and aggressiveness of the transformed cells. Here, we demonstrate that treatment with the S-adenosylhomocysteine hydrolase inhibitor 3-Deazaneplanocin A (DZNep) depletes EZH2, SUZ12 and 3MeK27H3 in the cultured human MCL cells. Treatment with DZNep increased the expression of p21, p27 and FBXO32, while depleting Cyclin D1 and Cyclin E1 levels in MCL cells. Additionally, DZNep treatment induced cell cycle arrest and apoptosis in cultured and primary MCL cells. Further, as compared to treatment with each agent alone, co-treatment with DZNep and the pan-histone deacetylase inhibitor panobinostat (PS) caused greater depletion of EZH2, SUZ12, 3MeK27H3 and Cyclin D1 levels, while inducing greater expression of FBXO32, p16, p21 and p27. Combined treatment with DZNep and PS also synergistically induced apoptosis of cultured and primary MCL cells while relatively sparing normal CD34+ cells. Co-treatment with DZNep and PS also caused significantly greater inhibition of tumor growth of JeKo-1 xenografts in NOD/SCID mice. These preclinical in vitro and in vivo findings demonstrate that the co-treatment with DZNep and PS is an active combined epigenetic therapy worthy of further in vivo testing against MCL.
Keywords: EZH2, polycomb, mantle cell lymphoma, HDAC inhibitor
Introduction
Mantle cell lymphoma (MCL) is an aggressive and distinct type of B-cell malignancy that comprises up to 10% of non-Hodgkin lymphomas. (1). A characteristic feature of MCL is the chromosomal rearrangement caused by the translocation t(11;14)(q13;q32), which results in overexpression of Cyclin D1 (2,3). Copy number variations and associated gene expression changes involving CDKN2A (p16) and CDKN2B (p15), as well as altered expression of CDK4, and p27 has also been noted and may play a role in the pathogenesis of MCL (3–5). Additionally, increased expression of MYC, Cyclin D1 and EZH2 has been associated with poor prognosis and correlate with poorer clinical outcome in MCL (3,6–8). EZH2 is a core member and the catalytic subunit of the polycomb protein complex, PRC (polycomb repressive complex) 2, that also contains SUZ12 and EED, in which the SET domain of EZH2 mediates the histone lysine (K) methyltransferase (KMTase) activity of PRC2 (9). EZH2 is a KMTase that mediates epigenetic silencing of PRC2 target genes by inducing tri-methylation (3Me) of K27 on histone H3 (3MeK27H3) in the chromatin (9,10). EZH2 overexpression in transformed cells promotes cell proliferation and aggressiveness (11–13). In hematologic malignancies, PRC2 regulates the expression of HOX genes and epigenetically represses genes including tumor suppressor genes p16 (CDKN2A) and p14 (ARF) (14). EZH2 was shown to be preferentially overexpressed in proliferating but not resting MCL cells (15). Recently, in lymphomagenesis, EZH2 mediated gene silencing in germinal center B cells was demonstrated to contributes to cell proliferation (16). Somatic gain of function mutations in tyrosine 641 (Y641C) in EZH2 have also been noted to selectively alter PRC2 catalytic activity and drive hyper-trimethylation of H3K27 in germinal center B cell lymphoma, thereby identifying EZH2 as a potentially attractive therapeutic target (17–20). PRC2 mediated trimethylation of H3K27 also recruits the muti-protein PRC1 complex, consisting among others of BMI, as well as RING1 and RING2 proteins, which mediate ubiquitylation of histone H2A on K119 associated with gene repression (9,14). BMI represses CDKN2A and INK4A/ARF and cooperates with MYC in lymphomagenesis (14). Additionally, BMI locus has been shown to be amplified in MCL cells (21). EZH2 has also been reported to directly control DNA methylation through its association with and regulation of the activity of the DNA methyltransferases DNMT1, DNMT3a and DNMT3b (22,23). However, genes silenced in cancer by 3MeK27H3 have been shown to be independent of promoter DNA methylation indicating that PRC2-mediated silencing could be an independent mechanism for suppression of TSGs (24). Consistent with this, both DNA methylation and transcriptional silencing of PRC2 target genes persists when EZH2 expression is depleted (25,26).
3-deazaneplanocin A (DZNep) is the cyclopentanyl analog of 3-deazaadenosine that inhibits the activity of S-adenosyl-L-homocysteine (AdoHcy) hydrolase, the enzyme responsible for the reversible hydrolysis of AdoHcy to adenosine and homocysteine (27). DZNep has also been shown to deplete the expression levels of EZH2 and SUZ12, with concomitant loss of trimethylation of K27 on histone H3 and re-expression of epigenetically silenced targets such as the F-box protein FBXO32- a component of the SCF ubiquitin protein E3 ligase complex, associated with apoptosis of cancer cells (28). However, the effects of depletion of EZH2 and the activity of DZNep had not been determined in MCL cells. In contrast, treatment with hydroxamate pan-histone deacetylase (HDAC) inhibitors, including vorinostat and panobinostat (PS, LBH589, Novartis Pharmaceutical Inc.), has been shown to be active against MCL cells (29–31). In AML cells, treatment with PS was shown to deplete the levels of EZH2 and SUZ12, as well as reduce the 3MeK27H3 mark on the chromatin (32). PS treatment also depleted the levels of DNMT1 and disrupted its binding to EZH2 in AML cells (33,34). Additionally, co-treatment with DZNep and PS was shown to be more effective against the epigenetic targets and synergistically induced apoptosis of AML cells (34). In the present studies, we determined that treatment with DZNep depletes PRC2 complex proteins and induces cell cycle arrest and apoptosis of cultured and primary MCL cells. Our findings also demonstrate that the combined treatment of DZNep and PS causes more depletion of PRC2 complex proteins and induces synergistic apoptosis of cultured and primary MCL cells but not normal CD34 + bone marrow progenitor cells. Additionally, co-treatment with DZNep and PS was more effective than each agent alone in inhibiting the in vivo tumor growth of JeKo-1 xenografts in NOD/SCID mice.
Materials and Methods
Reagents
Panobinostat (PS) was kindly provided by Novartis Pharmaceuticals, Inc. (East Hanover, NJ). 3-Deazaneplanocin A (DZNep) was acquired from the National Cancer Institute (Rockville, MD). Monoclonal BMI1, polyclonal anti-trimethylated K9 Histone H3, polyclonal anti-trimethylated K79 Histone H3, acetylated K16 Histone H4, acetyl K56 Histone H3 and polyclonal trimethylated K4 Histone H3 were purchased from Millipore (Billerica, MA). All other validated antibodies were purchased from vendors, as previously described (29,30,33,34).
Cell lines and cell culture
Mantle cell lymphoma cell lines MO2058 were obtained and maintained as previously described (29,30). JeKo-1 and Z-138 cells were obtained from ATCC (Manassas, VA). Both cell lines were banked after receipt, and passaged for less than 6 months before use in these studies. The American Type Culture Collection characterizes cell lines using short tandem repeat polymorphism analysis. MCL cells were maintained in culture, as previously described (29,30). Logarithmically growing cells were exposed to the designated concentrations of DZNep and/or panobinostat. Following these treatments, cells were washed free of the drug(s) prior to the performance of the studies.
Primary MCL cells
Primary mantle cell lymphoma (MCL) samples and normal CD34 + mononuclear cells were obtained with informed consent as part of a clinical protocol approved by the Institutional Review Board of University of Kansas. Peripheral blood or bone marrow aspirate samples were collected and separated for mononuclear cells, as previously described (29,30,33,34).
Cell cycle analysis, assessment of apoptosis of MCL cells, assessment of percentage non-viable cells, RNA interference, RNA isolation and Reverse Transcription-Polymerase Chain Reaction, detection and analysis of hsa-miR-101, and chromatin immunoprecipitation and Polymerase Chain Reaction
Methods for these studies were followed as previously described (29, 30, 32–37). Complete methods can be found in Supplemental Methods.
Cell lysis, histone isolation and protein quantitation
Untreated or drug-treated cells were centrifuged and the cell pellets were resuspended in 200 µL of lysis buffer as previously described (33,34). Histones were extracted from untreated and treated cells as previously described (32).
SDS-PAGE and immunoblot analyses
Seventy five micrograms of total cell lysate was used for SDS-PAGE. Western blot analyses of DNMT1, EZH2, SUZ12, EED, 3MeK27H3, Acetyl K27H3, PARP, FBXO32, Cyclin E, p16, p21, and p27 were performed on total cell lysates using specific antisera or monoclonal antibodies as previously described (29,30,34). Immunoblot analyses were performed at least twice and representative blots were subjected to densitometric analysis. Densitometry was performed using ImageQuant 5.2 (GE Healthcare, Piscataway, NJ).
Mantle Cell Lymphoma Xenograft
JeKo-1 cells (10 million) were subcutaneously implanted into the flank of NOD/SCID mice. When the average tumor volume reached approximately 150 mm3, the following treatments were administered in cohorts of 5 mice for each treatment: vehicle alone (5% DMSO), 1 mg/kg DZNep, 10 mg/kg PS, and DZNep plus PS. DZNep was administered twice per week intraperitoneally (IP) for 2 weeks. PS was administered 3 times per week for 2 weeks. Tumor growth was monitored every other day by calipers and tumor volume was calculated using the equation ½ (length × width2). We selected the dose of DZNep that had been determined to be safe in previously reported studies and combined it with a dose of PS that we had previously reported to be safe and biologically effective (29,38)
Statistical Analysis
Significant differences between values obtained in a population of mantle cell lymphoma cells treated with different experimental conditions were determined using the Student’s t-test. P values of < 0.05 were assigned significance.
Results
Treatment with DZNep depletes PRC2 proteins EZH2 and SUZ12 levels and disrupts the PRC2 complex in MCL cells
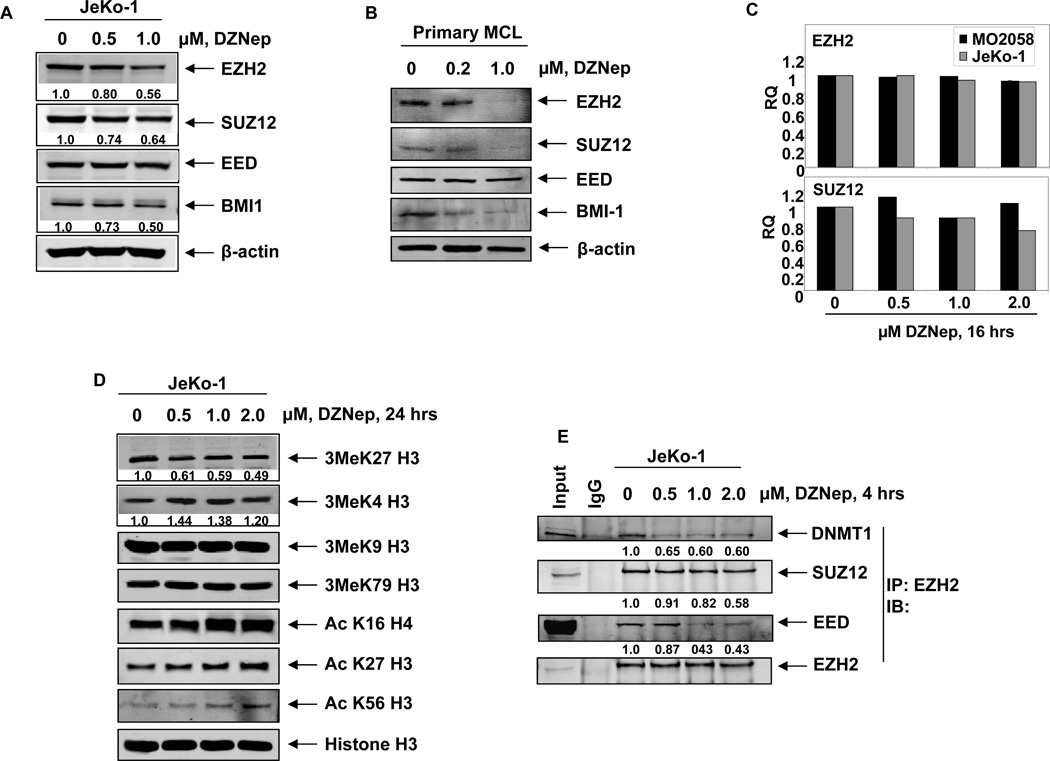
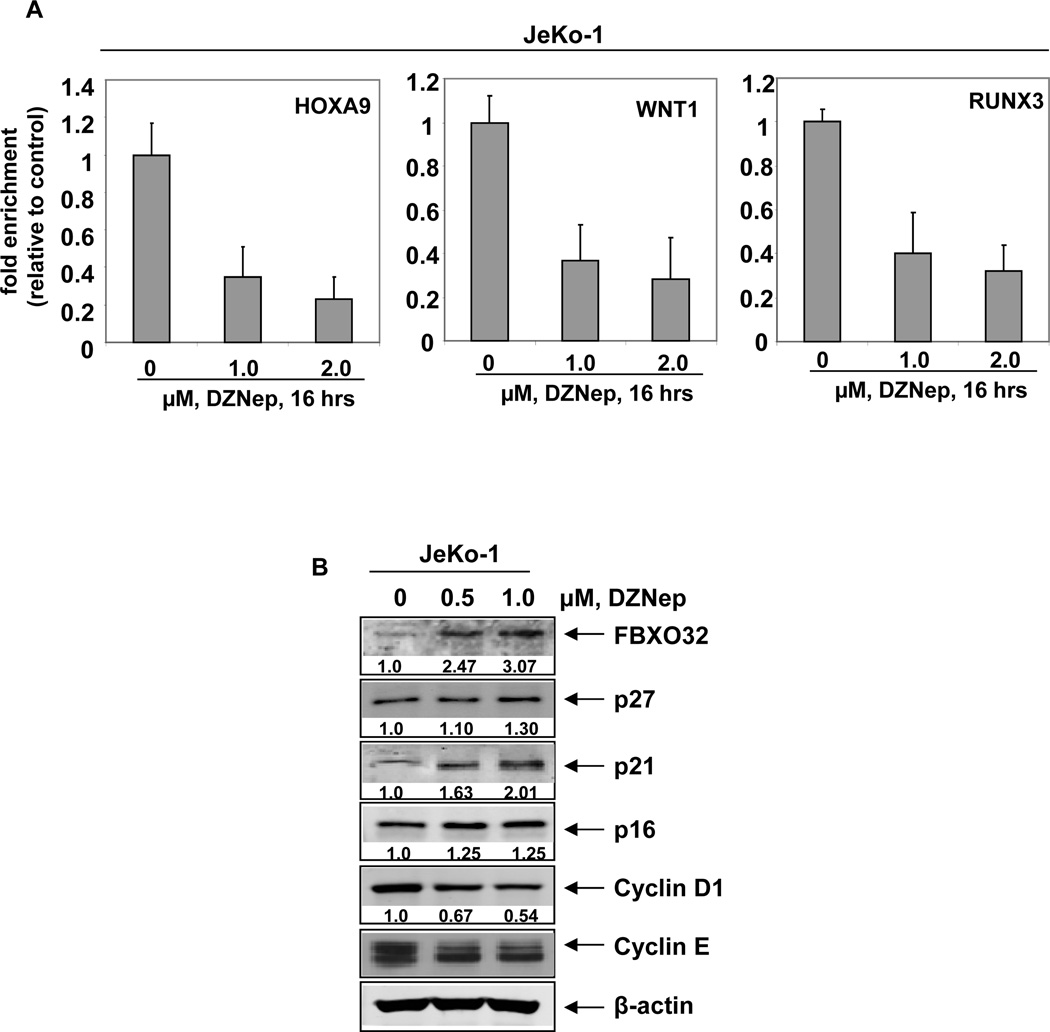
Treatment with DZNep has been previously demonstrated to deplete EZH2 and SUZ12 levels in breast cancer, colon cancer and leukemia cells (28,34,37). Here, we determined the effect of DZNep on PRC2 proteins in the cultured MCL JeKo-1, MO2058 and Z-138 and primary MCL cells. Exposure to DZNep for 24 hours dose-dependently reduced the protein expression of EZH2, SUZ12 and BMI1 in cultured and primary MCL cells (Figures 1A–B and Supplemental Figure S1A). Similar to our previous findings in AML cells, exposure to DZNep up to 1.0 µM, did not significantly affect the mRNA expression of EZH2 and SUZ12, as determined by quantitative RT-PCR (Figure 1C). As demonstrated in Supplemental Figure 1B, co-treatment with the proteasome inhibitor bortezomib (BZ) restored the DZNep-mediated depletion of EZH2 and SUZ12 levels, indicating that depletion of the PRC2 proteins by DZNep was mediated by proteasomal degradation. In MCL cells, depletion of the PRC2 complex proteins by DZNep was associated with attenuation of the repressive histone mark 3MeK27H3 and up-regulation of 3MeK4H3 (Figure1D and data not shown). DZNep treatment did not alter the expression levels of 3MeK9H3 and 3MeK79H3, but induced acetylation of H3K27, H3K56 and H4K16 (Figure 1D). Treatment with DZNep for as short as 4 hours markedly depleted the binding of EZH2 with other PRC2 proteins, SUZ12 and EED, as well as diminished binding of EZH2 to DNMT1 in MCL cells (Figure 1E). DZNep-mediated alterations in the levels of PRC2 proteins and in the chromatin marks led to decline in the binding of EZH2 to its known target promoters, e.g., HOXA9, WNT1 and RUNX3, as discerned by chromatin immunoprecipitation (ChIP) analysis of the promoters of these genes (Figure 2A) (28,34,37). Both in cultured and primary MCL cells, treatment with DZNep also reduced the levels of the PRC1 protein BMI (Figure 1A and 1B). The effects of DZNep on PRC2 and PRC1 proteins and chromatin marks were associated with decline in the levels of Cyclin D1 and cyclin E, but increase in the levels of p27, p21, p16, and the pro-death F-Box protein FBXO32, an E3 ubiquitin ligase (28,34), in the cultured MCL cells (Figure 2B and Supplemental Figure S1A). DZNep treatment significantly increased the mRNA levels of the PRC2 target genes SMARCA2, EIF3A and TCF4 (Supplemental Figure S2A–C). Recently, the expression of EZH2 was shown to be inhibited by microRNA-101 in cancer cells (39,40). Although MO2058 and JeKo-1 cells possess the pre-microRNA for hsa-miR-101 (Supplemental Figure S3A), treatment with DZNep did not significantly alter the expression of the mature hsa-miR-101 in MO2058 and JeKo-1 cells (Supplemental Figure S3B). Treatment with DZNep (1.0 to 2.0 µM) also had no effect on the methylation status of the p16 promoter in MO2058 cells, whereas treatment with the DNMT1 inhibitor decitabine caused significant promoter hypomethylation (Supplemental Figure S3C).
Figure 1. Treatment with DZNep depletes expression of PRC2 proteins EZH2, SUZ12 and associated 3MeK27H3 levels in cultured human mantle cell lymphoma cells.
A. Immunoblot analyses of EZH2, SUZ12, EED, BMI1 and β-actin in JeKo-1 cells following 24 hours treatment with DZNep. B. Immunoblot analyses of EZH2, SUZ12, EED, BMI1 and β-actin in primary MCL cells after treatment with DZNep for 24 hours. C. Quantitative real time PCR for EZH2, and SUZ12 in MO2058 and JeKo1 treated with DZNep for 16 hours. The relative quantity (RQ) of each mRNA was normalized against GAPDH expression. D. Immunoblot analyses of 3Me K27H3, 3MeK4H3, 3MeK79H3 and 3MeK9H3, AcK16H4, AcK27H3, AcK56H3 and Histone H3 on acid extracted histones from JeKo-1 cells treated with DZNep for 24 hours. E. JeKo-1 cells were treated with DZNep for 4 hours. Following this, EZH2 was immunoprecipitated and immunoblot analyses were performed for DNMT1, SUZ12, EED and EZH2 on the immunoprecipitates.
Figure 2. Treatment with DZNep attenuates EZH2 binding at target promoters, induces the cell cycle inhibitors p16, p21, and p27 and depletes Cyclin D1 and Cyclin E expression in MCL cells.
A. Quantitative PCR of the HOXA9, WNT1 and RUNX3 promoters in EZH2 chromatin immunoprecipitates from JeKo-1 cells following treatment with DZNep. Fold enrichment data are relative to the control and are expressed as a ratio of the CT of the chIP DNA versus the CT for the input samples. B. Immunoblot analyses of FBXO32, p27, p21, p16, Cyclin D1, Cyclin E and β-actin in JeKo-1 cells after treatment with DZNep for 24 hours.
DZNep treatment induces cell cycle arrest and apoptosis of MCL cells
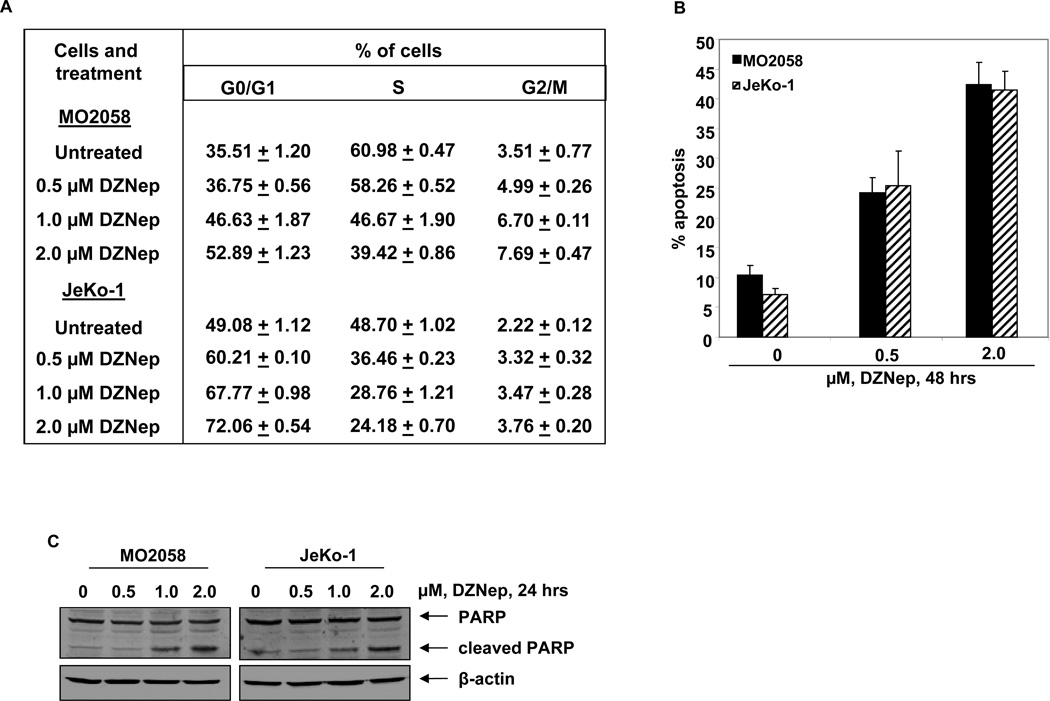
We next determined the effects of DZNep treatment on the cell cycle of MO2058 and JeKo-1 cells. As demonstrated in Figure 3A, treatment of MO2058 and JeKo-1 cells resulted in a dose dependent accumulation of cells in the G0/G1 phase, with a concomitant decline in the number of cells in S-phase phase of the cell cycle (p < 0.05). Next, we determined the effects of DZNep treatment on induction of apoptosis in MO2058, JeKo-1 and Z-138 cells. Treatment with DZNep dose dependently induced apoptosis in all three MCL cell lines, although Z-138 cells were more sensitive to the lower concentrations of DZNep compared to MO2058 and JeKo-1 cells (Figure 3B and Supplemental Figure S4A). The apoptotic effects in MO2058 and JeKo-1 cells were further enhanced following a 72 hour exposure to DZNep (data not shown). DZNep-induced caspase 3 activity was also demonstrated by induction of PARP cleavage, a hallmark of apoptosis (Figure 3C and Supplemental Figure S4B).
Figure 3. Treatment with DZNep induces cell cycle arrest and apoptosis of mantle cell lymphoma cells in a dose-dependent manner.
A. Cell cycle status of MO2058 and JeKo-1 cells treated with the indicated concentrations of DZNep for 24 hours. Values represent the mean of three independent experiments ± S.E.M. B. MO2058 and JeKo-1cells were treated with DZNep as indicated for 48 hours. The percentages of annexin V-positive apoptotic cells were determined by flow cytometry. Columns, mean of three experiments; Bars, S.E.M. C. Immunoblot analyses of PARP and β-actin in MO2058 and JeKo-1 cells after treatment with DZNep for 24 hours.
DZNep mediated induction of p16, p21, p27, and FBXO32 is mechanistically linked to depletion of EZH2 in MCL cells
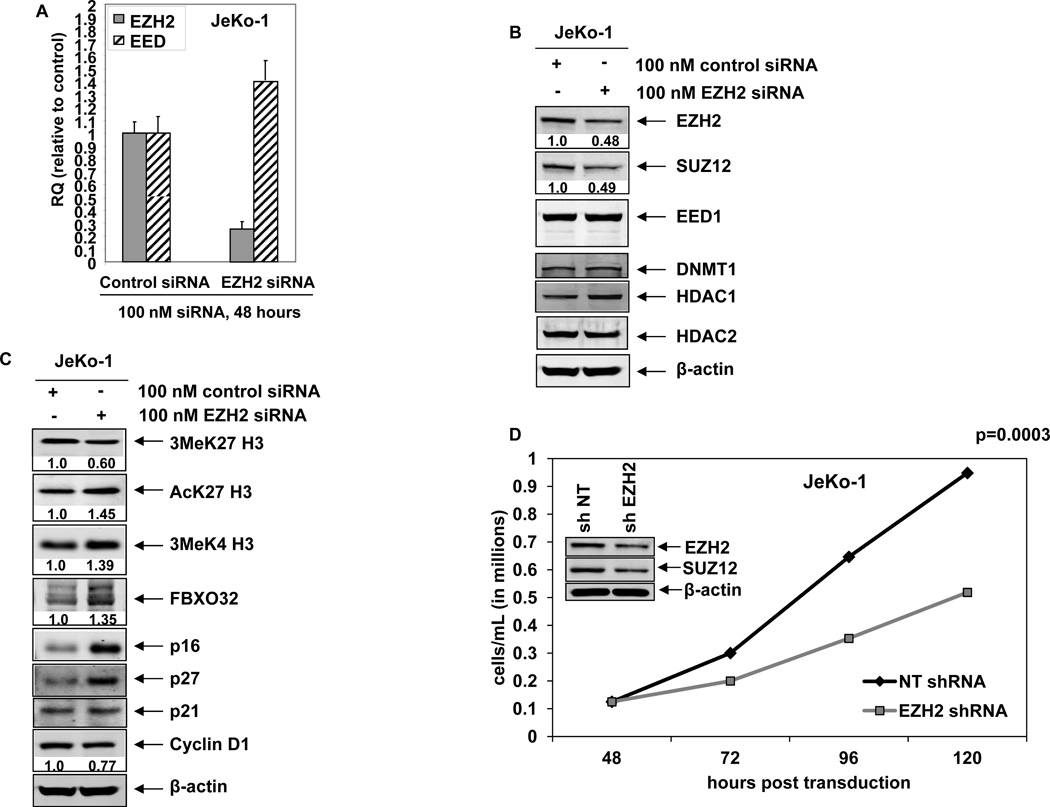
To determine whether the DZNep-mediated decline in EZH2 was mechanistically linked to increase in the levels of p21, p27 and FBXO32, we also determined the effect of siRNA to EZH2 in JeKo-1 cells. Figure 4A demonstrates that, as compared to the control siRNA, treatment with siRNA to EZH2 for 48 hours depleted EZH2 mRNA, but modestly increased the levels of EED mRNA. SUZ12 mRNA was unaffected (data not shown). Treatment with siRNA to EZH2 was associated with decline in protein levels of EZH2 and SUZ12 but not of EED (Figure 4B). Additionally, there was no effect of EZH2 siRNA on the protein levels of DNMT1 and HDAC2, while HDAC1 levels were slightly increased (Figure 4B). Attenuation of PRC2 proteins by EZH2 siRNA and the impairment of the PRC2 complex activity were associated with decline in the levels of 3MeK27H3 but induction of acetylated K27H3 and 3Me H3K4 levels in MCL cells (Figure 4C). This was accompanied by increase in the levels of p16, p21 and p27, with modest decline in Cyclin D1 levels (Figure 4C). EZH2 siRNA treatment also induced the F-Box protein FBXO32 levels in MCL cells (Figure 4C). We also determined the effects of transduction of shRNA to EZH2 on the proliferation and apoptosis of MCL cells. Depletion of EZH2 and SUZ12 by EZH2 shRNA significantly inhibited cell proliferation without inducing apoptosis of MCL cells (Figure 4D and data not shown).
Figure 4. RNA interference-mediated depletion of EZH2 induces p16, p27, p21 and FBXO32 expression and inhibits cell proliferation of MCL cells.
A. Quantitative real-time PCR for EZH2 and EED following 48 hours transfection with scrambled or EZH2 siRNA. The relative expression was normalized against GAPDH. B–C. Immunoblot analyses of EZH2, SUZ12, EED, DNMT1, HDAC1, HDAC2, 3MeK27H3, AcK27H3, FBXO32, p16, p27, p21, CyclinD1 and β-actin in JeKo-1 cells following 72 hours transfection with scrambled or EZH2 siRNA. D. JeKo-1 cells were transduced with non-targeting (NT) shRNA or EZH2 shRNA for 48 hours. Then, 1 × 10⁵ cells were plated in triplicate and cell growth was for an additional 72 hours. The inset shows the level of EZH2 and SUZ12 knockdown in the cells.
Treatment with the pan-HDAC inhibitor panobinostat (PS) depletes PRC2 complex proteins with concomitant decline in 3MeK27H3 in MCL cells
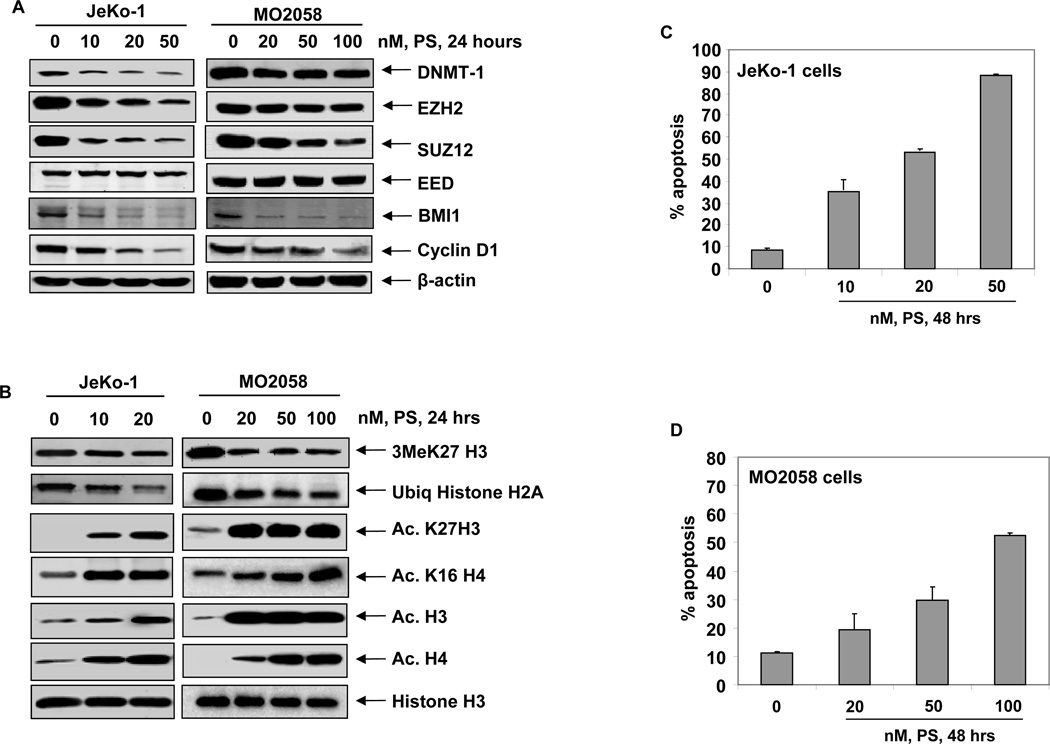
We next determined whether treatment with the pan-HDAC inhibitor PS would deplete the levels of EZH2 and SUZ12 with concomitant decline in the levels of 3MeK27H3 in MCL cells, as was observed in cultured and primary AML cells (32). Figure 5A demonstrates that PS treatment depletes EZH2 and SUZ12 levels, as well as attenuates the levels of BMI1 and DNMT1 in MCL cells (Figure 5A and Supplemental Figure S4C). This was accompanied by depletion of 3MeK27H3 and marked up regulation of acetylated-K27H3 and acetylated-K16H4 in the MCL cells (Figure 5B). Additionally, PS treatment also inhibited K119H2A ubiquitylation, possibly due to decline in PRC1 activity in MCL cells (9,14). Treatment with PS also significantly depleted the levels of Cyclin D1 in all three cell lines (Figure 5A and Supplemental Figure 4C). Consistent with previous reports, here also we observed that, in conjunction with its effects on epigenetic mechanisms, PS also induced apoptosis of the cultured MCL cells (Figure 5C and 5D) (29–31).
Figure 5. Treatment with PS depletes DNMT1 and the PRC2 complex proteins resulting in loss of trimethylation of K27 on histone H3.
A. Immunoblot analyses of DNMT1, EZH2, SUZ12, EED, BMI1, Cyclin D1 and β-actin in MO2058 and JeKo-1 cells after treatment with PS for 24 hours. B. Immunoblot analyses of 3MeK27H3, AcK27H3, AcK16 H4, Acetyl H3, Acetyl H4 and Histone H3 in MO2058 and JeKo-1 cells after treatment with PS for 24 hours. C–D. JeKo-1 and MO2058 cells were treated with PS for 48 hours. The percentages of apoptotic cells were determined by flow cytometry. Columns, mean of three experiments; Bars, S.E.M.
Co-treatment with DZNep and PS demonstrates superior anti-EZH2 activity, induces more p21 and p27 and exerts synergistic apoptotic effects against MCL cells
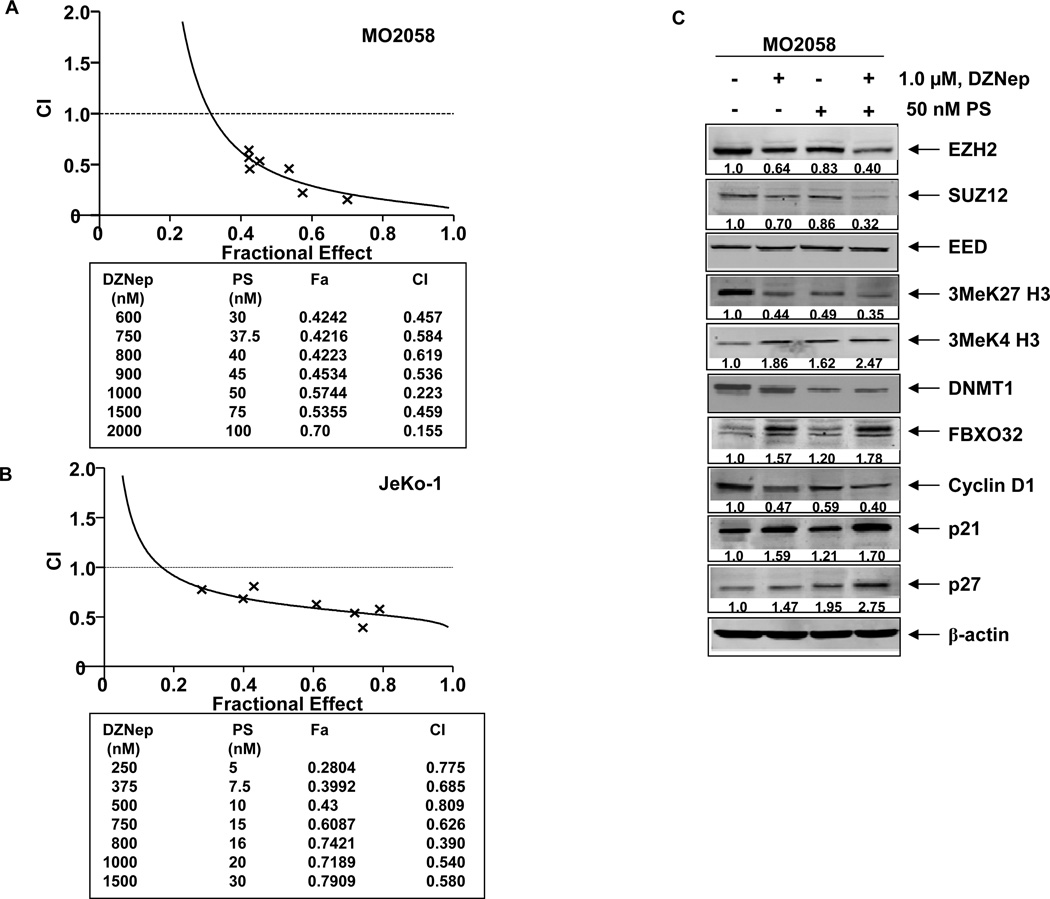
We next determined the effects of combined treatment with DZNep and PS in MCL cells. Figure 6A and 6B demonstrate that, as compared to treatment with either agent alone, co-treatment with DZNep (250–2000 nM) and PS synergistically induced apoptosis of MO2058 and JeKo-1 cells, as highlighted by the combination indices of < 1.0 determined through median dose effect isobologram analyses. Superior activity of the combination was also noted in Z-138 cells (Supplemental Figure 5C). This activity of the combination was also associated with greater attenuation of EZH2, SUZ12 and the 3MeK27H3 chromatin mark, with a concomitant, greater induction of 3MeK4H3 mark in the cultured MCL cells (Figure 6C and Supplemental Figure 5A and 5B). Co-treatment with DZNep and PS also caused greater decline in DNMT1 levels. It is noteworthy that, as compared to each agent alone, combined treatment with DZNep and PS induced greater increase in the levels of FBXO32, p21 and p27 in the cultured MO2058 MCL Cells (Figure 6C). Similar effects were also observed in JeKo-1 and Z-138 cells (Supplemental Figure 5A).
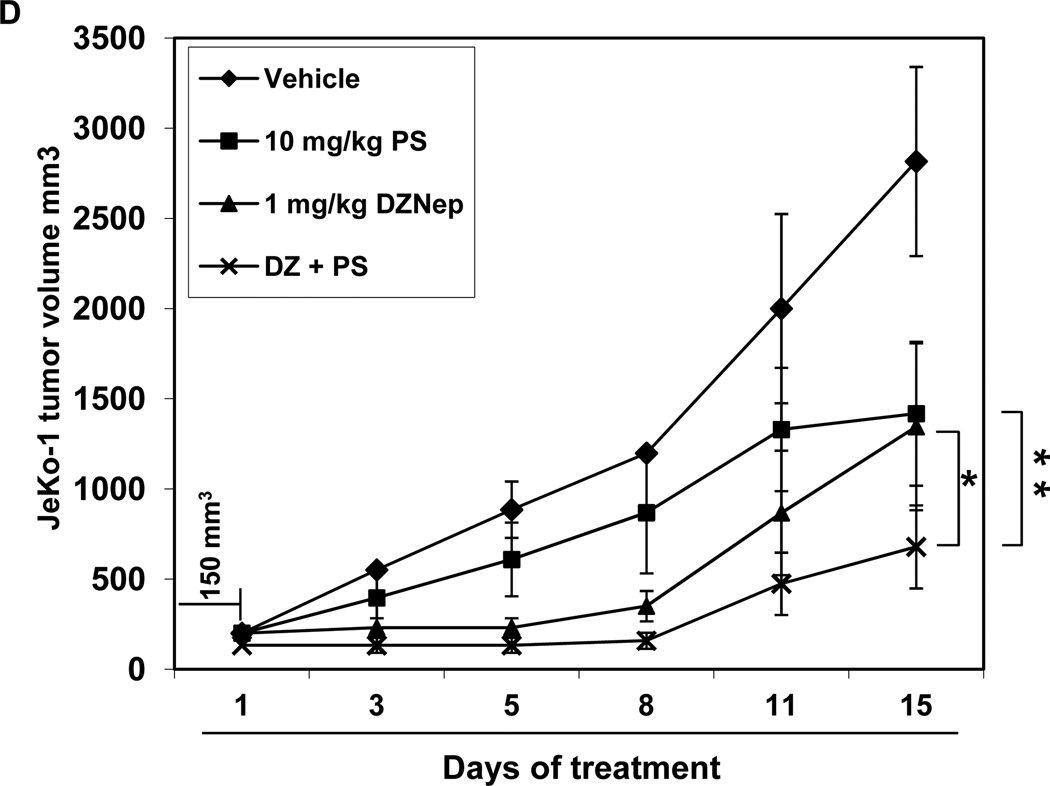
Figure 6. Co-treatment with DZNep and PS exerts synergistic anti-MCL activity and enhances DZNep-mediated depletion of EZH2, SUZ12 and 3MeK27H3 and induction of FBXO32, p21 and p27 in MCL cells.
A–B. MO2058 and JeKo-1 cells were treated with DZNep (dose range 0.25–2.0 µM) and PS (dose range 5–100 nM) at a fixed ratio for 48 hours. The percentages of apoptotic cells were determined by flow cytometry. Median dose effect and isobologram analyses were performed using the commercially available software, Calcusyn. Combination indices less than 1.0 indicate the synergism of these two agents. C. Immunoblot analyses of EZH2, SUZ12, EED, 3Me K27H3, 3Me K4H3, DNMT1, FBXO32, Cyclin D1, p21 p27 and β-actin in MO2058 cells treated with DZNep and/or PS for 24 hours. D. Tumor growth of JeKo-1 cells implanted in the flank of NOD/SCID mice and treated as indicated for 2 weeks * indicates values significantly less (p= 0.008) in combination than treatment with PS alone. ** indicates values significantly less (p= 0.04) than treatment with DZNep alone.
Treatment with DZNep and/or PS inhibits tumor growth of JeKo-1 xenografts
We next determined the in vivo anti-MCL activity of treatment with DZNep and/or PS in JeKo-1 cell xenografts in NOD/SCID mice. In cohorts of mice, JeKo-1 cells were implanted in the flanks, and the treatment with each agent or vehicle alone was begun after the flank tumors achieved a size of approximately 150 mm3. As shown in Figure 6D, although treatment with DZNep or PS alone also caused inhibition of tumor growth, combined treatment with DZNep and PS exerted superior growth inhibitory, anti-tumor effects against the JeKo-1 xenografts (p < 0.05). Neither each agent alone nor the combination of DZNep and PS induced weight loss or other physical signs of toxicity in the xenograft bearing NOD/SCID mice.
Co-treatment with DZNep and PS demonstrates greater cytotoxicity against primary MCL cells than either agent alone
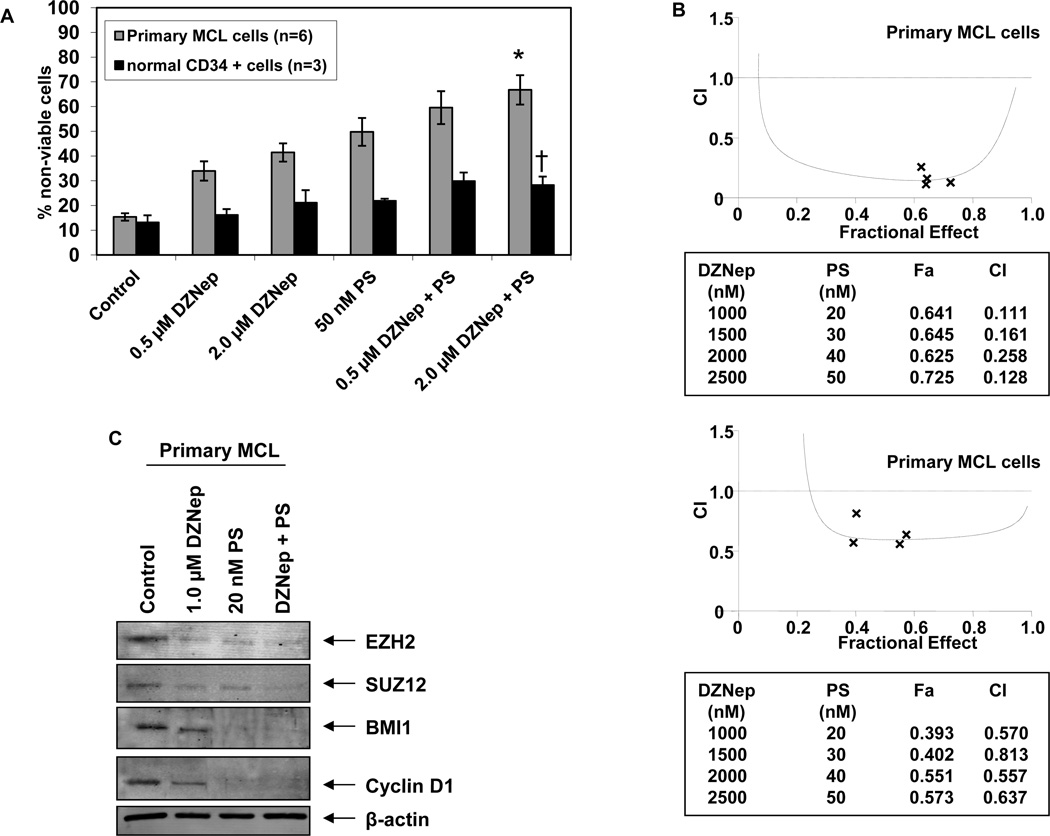
Finally, we determined the effects of treatment with DZNep and/or PS on the cell viability of patient-derived primary MCL cells versus normal CD34+ bone marrow progenitor cells. Figure 7A demonstrates that exposure to either DZNep or PS for 48 hours induced more loss of viability in six primary MCL cell samples, as compared to normal CD34+ progenitor cells. Additionally, compared to treatment with each agent alone, co-treatment with DZNep (0.5 or 2.0 µM) and PS (50 nM) induced significantly greater lethality of MCL versus normal progenitor cells (Figure 7A). Similar to the effects observed in the cultured MCL cell lines, combined treatment with DZNep and PS was synergistically lethal against primary MCL cells (Figure 7B). On one primary sample, where adequate numbers of MCL cells were available, immunoblot analyses demonstrated that combined treatment with PS and DZNep, as compared with treatment with DZNep alone, caused greater decline in the levels of EZH2, SUZ12, BMI1 and Cyclin D1 expression levels in primary MCL cells (Figure 7C).
Figure 7. Co-treatment with DZNep and PS exerts synergistic cytotoxic effects against primary MCL cells.
A. Primary MCL (n=6) and normal CD34 + cells (n=3) were treated with DZNep and/or PS for 48 hours. * indicates loss of viability values significantly greater (p< 0.05) than those resulting from treatment with either agent alone. † indicates values significantly less in normal CD34+ progenitor cells than those observed in primary MCL cells. B. Median dose effect and isobologram analyses of primary MCL cells treated with DZNep and PS for 48 hours. (CI) values less than 1.0 indicate synergism of these two agents. C. Immunoblot analyses of EZH2, SUZ12, BMI1 and Cyclin D1 and β-actin in primary MCL cells treated with DZNep and/or PS for 24 hours.
Discussion
Deregulated epigenome plays a pathogenic role and contributes to the aggressive biology in human MCL (3,7,8,14). In this, the specific role of overexpression of the PRC2 and PRC1 proteins EZH2, SUZ12 and BMI1 has also been elucidated (3,5,7,14). Our present studies demonstrate that a combination therapy targeting the deregulated epigenome by co-treatment with DZNep and PS exerts superior in vitro and in vivo activity against MCL cells, as compared to treatment with each agent alone. The KMTase activity of EZH2 and PRC2 is dependent on S-adenosylmethionine (SAM) for maintaining histone methylation and gene silencing (10). By inhibiting the SAM-dependent KMTase activity of EZH2 and PRC2, treatment with DZNep attenuates its catalytic KMTase activity within the PRC2 in MCL cells (10,28). We show here, that exposure to DZNep for as little as 4 hours results in dissociation of EZH2 from other PRC2 complex proteins and to DNMT1, prior to the depletion of EZH2 and SUZ12 in MCL cells. DZNep treatment did not significantly affect the mRNA level of EZH2, instead promoted the proteasomal degradation of EZH2. Parenthetically, a recent study demonstrated that induction of PRAJA1, a RING finger-containing ubiquitin ligase, by DZNep treatment caused rapid ubiquitination of EZH2, SUZ12 and EED in cells, which was reversed by treatment with a proteasome inhibitor (41). Treatment with DZNep also did not affect the expression levels of hsa-miR-101, which is known to down regulate the levels of EZH2 (39,40). Consistent with DZNep-mediated attenuation of EZH2 levels, in MCL cells, we observed decreased binding of EZH2 to the promoters of the known EZH2 target genes, including HOXA9, WNT1 and RUNX3. Additionally, and consistent with prior reports, exposure to DZNep induced the expression of FBXO32 (atrogin) and depleted Cyclin E (28,32,37), as well as up regulated the levels of p16, p21 and p27 in MCL cells. Since SUZ12 is aberrantly overexpressed and promotes survival of MCL cells (42), DZNep-mediated depletion of SUZ12 may also impair survival of MCL cells. Collectively, these effects of DZNep treatment explain the growth inhibitory and apoptotic effects of DZNep in MCL cells.
Notably, the PRC1 protein BMI is commonly amplified and overexpressed in MCL cells (9,14). Our findings demonstrate that DZNep treatment also depleted BMI1, thereby affecting PRC1 activity in MCL cells. Although this was not studied here, DZNep may be exerting this effect on BMI1 levels by perturbing the recently described, EZH2-regulated miRs that regulate the expression of BMI1 (43). By inhibiting both PRC2 and PRC1 activity, DZNep treatment reduced the levels of 3MeK27H3 and ubiquitylated-K119H2A chromatin marks, while increasing the acetylation of K27H3, K56H3 and K16H4. While the precise underlying mechanism for this is unknown, exposure to DZNep also increased the levels of 3MeK4H3 in MCL cells. Although its impact here is unknown, this is known to be a permissive chromatin mark mediated by trithorax (TRX) family of proteins facilitating gene expression involved in stem cell-lineage differentiation (44). Collectively, DZNep-mediated inhibition of PRC2 and PRC1, and the notable alterations in the chromatin marks: decreased 3MeK27H3 and increased 3MeK4H3, are also likely to affect the bivalent chromatin mark, which is known to promote lineage differentiation in transformed stem cells (45). While PRC2 is known to recruit DNMTs to the promoters of PRC2 target genes and PRC2 inhibition should affect DNA methylation of the target gene promoters, this was not the case for p16 gene promoter where CpG methylation was found to be unaffected by DZNep treatment. However, both EZH2 and BMI1-mediated chromatin effects have been implicated in the repression of Ink4a/Arf locus encoding p16 and ARF (p19) (46,47). Therefore, notwithstanding the absence of its effects on DNA methylation, it is not surprising that treatment with DZNep led to up regulation of p16 expression in MCL cells. BMI1 has also been shown to be required to reinforce bivalent domains at key gene loci for maintaining lineage specification poised for activation in hematopoietic stem cells (48).
DZNep treatment in MCL cells increased the expression of the cell cycle inhibitory proteins p16, p21 and p27 in MCL cells and caused induction of the E3 ubiquitin ligase FBXO32 (28,32,34,37). DZNep induced FBXO32 levels were associated with decline in the levels of Cyclin E, which is known to be targeted by FBXO32 (28). Induction of FBXO32 has also been shown to promote apoptosis (28,33). Similar to DZNep treatment, depletion of EZH2 by siRNA also induced the levels of p16, p21, p27 and FBXO32, which indicates that DZNep-mediated depletion of EZH2 is responsible for modulating these protein levels and growth inhibition in MCL cells. It is notable that while treatment with DZNep induced growth inhibition and apoptosis, EZH2 shRNA treatment only induced growth inhibition in MCL cells. This may be because DZNep treatment induced significantly higher levels of FBXO32 in MCL cells than treatment with EZH2 siRNA. Other off-target effects of DZNep may also be responsible for this discrepancy. Search for more specific and less toxic EZH2 antagonists is a clear priority but prototype, direct EZH2 antagonists are not yet available for testing.
As was reported for other cancer cell-types, treatment with PS also depleted EZH2, SUZ12 and BMI1 in MCL cells. Concomitantly, this was associated with decline in the 3MeK27H3 but increase in 3MeK4H3, acetylated-K27 H3 and acetylated-K16 H4 chromatin marks. PS treatment also inhibited H2A ubiquitylation, possibly due to decline in PRC1 activity in MCL cells (9,14). Importantly, treatment with PS also significantly depleted the levels of Cyclin D1, as well as induced apoptosis of cultured and primary MCL cells. It should be noted that we have previously documented multiple non-epigenetic mechanisms that may also contribute to the anti-MCL activity of PS (29,30). Therefore, the overall anti-MCL activity of PS is likely to be due to multiple mechanisms. Our findings also demonstrate that, as compared to treatment with each agent alone, co-treatment with DZNep and PS resulted in greater depletion of EZH2, SUZ12, DNMT1, Cyclin D1 and 3MeK27H3, with concomitant induction of 3MeK4H3, FBXO32, p21 and p27. These molecular perturbations resulting from cotreatment with DZNep and PS are likely to have contributed to the superior anti-MCL activity of the combination. Indeed, co-treatment with DZNep and PS synergistically induced apoptosis of cultured and primary MCL cells. Notably, combined treatment with DZNep and PS was only slightly more toxic than each agent alone against normal CD34+ progenitor cells. The combination also induced significantly more apoptosis in primary MCL versus normal CD34+ progenitor cells. These results indicate that cotreatment with DZNep and PS is selectively more toxic against MCL cells. This is further confirmed by our findings that the combination exerts greater in vivo antitumor effects against the JeKo-1 xenograft model, without inducing weight loss or other physical side effects during treatment of the NOD/SCID mice. In the current study, we used previously determined doses of DZNep and PS that improved survival of NOD/SCID mice implanted with human AML cell xenografts without resulting in toxicity to the mice (34). It is noteworthy that, so far, neither DZNep nor any of its active analogues has been administered to humans. On the other hand, Phase I/II clinical studies have highlighted the activity of PS in patients with hematologic malignancies, especially those with lymphoma (49,50). Findings presented here support the rationale to further test the in vivo anti-MCL efficacy of the combination of PS with an EZH2 antagonist. Additionally, our findings also create the rationale to develop and test combination therapies that target the deregulated epigenome in human MCL cells.
Supplementary Material
References
- 1.Andersen NS, Jensen MK, de Nully Brown P, Geisler CH. A Danish population-based analysis of 105 mantle cell lymphoma patients: incidences, clinical features, response, survival and prognostic factors. Eur J Cancer. 2002;38:401–408. doi: 10.1016/s0959-8049(01)00366-5. [DOI] [PubMed] [Google Scholar]
- 2.Sander B. Mantle cell lymphoma: recent insights into pathogenesis, clinical variability, and new diagnostic markers. Semin Diagn Pathol. 2011;28:245–255. doi: 10.1053/j.semdp.2011.02.010. [DOI] [PubMed] [Google Scholar]
- 3.Jares P, Colomer D, Campo E. Genetic and molecular pathogenesis of mantle cell lymphoma: perspectives for new targeted therapeutics. Nat Rev Cancer. 2007;7:750–762. doi: 10.1038/nrc2230. [DOI] [PubMed] [Google Scholar]
- 4.Hartmann EM, Campo E, Wright G, Lenz G, Salaverria I, Jares P, et al. Pathway discovery in mantle cell lymphoma by integrated analysis of high-resolution gene expression and copy number profiling. Blood. 2010;116:953–961. doi: 10.1182/blood-2010-01-263806. [DOI] [PMC free article] [PubMed] [Google Scholar]
- 5.Royo C, Salaverria I, Hartmann EM, Rosenwald A, Campo E, Beà S. The complex landscape of genetic alterations in mantle cell lymphoma. Semin Cancer Biol. 2011;21:322–334. doi: 10.1016/j.semcancer.2011.09.007. [DOI] [PubMed] [Google Scholar]
- 6.Nagy B, Lundán T, Larramendy ML, Aalto Y, Zhu Y, Niini T, et al. Abnormal expression of apoptosis-related genes in haematological malignancies: overexpression of MYC is poor prognostic sign in mantle cell lymphoma. Br J Haematol. 2003;120:434–441. doi: 10.1046/j.1365-2141.2003.04121.x. [DOI] [PubMed] [Google Scholar]
- 7.Visser HP, Gunster MJ, Kluin-Nelemans HC, Manders EM, Raaphorst FM, Meijer CJ, et al. The Polycomb group protein EZH2 is upregulated in proliferating, cultured human mantle cell lymphoma. Br J Haematol. 2001;112:950–958. doi: 10.1046/j.1365-2141.2001.02641.x. [DOI] [PubMed] [Google Scholar]
- 8.Kienle D, Katzenberger T, Ott G, Saupe D, Benner A, Kohlhammer H, et al. Quantitative gene expression deregulation in mantle-cell lymphoma: correlation with clinical and biologic factors. J Clin Oncol. 2007;25:2770–2777. doi: 10.1200/JCO.2006.08.7999. [DOI] [PubMed] [Google Scholar]
- 9.Bracken AP, Helin K. Polycomb group proteins: navigators of lineage pathways led astray in cancer. Nat Rev Cancer. 2009;9:773–784. doi: 10.1038/nrc2736. [DOI] [PubMed] [Google Scholar]
- 10.Simon JA, Lange CA. Roles of the EZH2 histone methyltransferase in cancer epigenetics. Mutat Res. 2008;647:21–29. doi: 10.1016/j.mrfmmm.2008.07.010. [DOI] [PubMed] [Google Scholar]
- 11.Kleer CG, Cao Q, Varambally S, Shen R, Ota I, Tomlins SA, et al. EZH2 is a marker of aggressive breast cancer and promotes neoplastic transformation of breast epithelial cells. Proc Natl Acad Sci U S A. 2003;100:11606–11611. doi: 10.1073/pnas.1933744100. [DOI] [PMC free article] [PubMed] [Google Scholar]
- 12.Varambally S, Dhanasekaran SM, Zhou M, Barrette TR, Kumar-Sinha C, Sanda MG, et al. The polycomb group protein EZH2 is involved in progression of prostate cancer. Nature. 2002;419:624–629. doi: 10.1038/nature01075. [DOI] [PubMed] [Google Scholar]
- 13.Bachmann IM, Halvorsen OJ, Collett K, Stefansson IM, Straume O, Haukaas SA, et al. EZH2 expression is associated with high proliferation rate and aggressive tumor subgroups in cutaneous melanoma and cancers of the endometrium, prostate, and breast. J Clin Oncol. 2006;24:268–273. doi: 10.1200/JCO.2005.01.5180. [DOI] [PubMed] [Google Scholar]
- 14.Martin-Perez D, Piris MA, Sanchez-Beato M. Polycomb proteins in hematologic malignancies. Blood. 2010;116:5465–5475. doi: 10.1182/blood-2010-05-267096. [DOI] [PubMed] [Google Scholar]
- 15.van Kemenade FJ, Raaphorst FM, Blokzijl T, Fieret E, Hamer KM, Satijn DP, et al. Coexpression of BMI-1 and EZH2 polycomb-group proteins is associated with cycling cells and degree of malignancy in B-cell non-Hodgkin lymphoma. Blood. 2001;97:3896–3901. doi: 10.1182/blood.v97.12.3896. [DOI] [PubMed] [Google Scholar]
- 16.Velichutina I, Shaknovich R, Geng H, Johnson NA, Gascoyne RD, Melnick AM, et al. EZH2-mediated epigenetic silencing in germinal center B cells contributes to proliferation and lymphomagenesis. Blood. 2010;116:5247–5255. doi: 10.1182/blood-2010-04-280149. [DOI] [PMC free article] [PubMed] [Google Scholar]
- 17.Morin RD, Johnson NA, Severson TM, Mungall AJ, An J, Goya R, et al. Somatic mutations altering EZH2 (Tyr641) in follicular and diffuse large B-cell lymphomas of germinal-center origin. Nat Genet. 2010;42:181–185. doi: 10.1038/ng.518. [DOI] [PMC free article] [PubMed] [Google Scholar]
- 18.Sneeringer CJ, Scott MP, Kuntz KW, Knutson SK, Pollock RM, Richon VM, et al. Coordinated activities of wild-type plus mutant EZH2 drive tumor-associated hypertrimethylation of lysine 27 on histone H3 (H3K27) in human B-cell lymphomas. Proc Natl Acad Sci U S A. 2010;107:20980–20985. doi: 10.1073/pnas.1012525107. [DOI] [PMC free article] [PubMed] [Google Scholar]
- 19.Yap DB, Chu J, Berg T, Schapira M, Cheng SW, Moradian A, et al. Somatic mutations at EZH2 Y641 act dominantly through a mechanism of selectively altered PRC2 catalytic activity, to increase H3K27 trimethylation. Blood. 2011;117:2451–2459. doi: 10.1182/blood-2010-11-321208. [DOI] [PMC free article] [PubMed] [Google Scholar]
- 20.Ryan RJ, Nitta M, Borger D, Zukerberg LR, Ferry JA, Harris NL, et al. EZH2 Codon 641 Mutations are Common in BCL2-Rearranged Germinal Center B Cell Lymphomas. PLoS One. 2011;6:e28585. doi: 10.1371/journal.pone.0028585. [DOI] [PMC free article] [PubMed] [Google Scholar]
- 21.Beà S, Tort F, Pinyol M, Puig X, Hernández L, Hernández S, et al. BMI-1 gene amplification and overexpression in hematological malignancies occur mainly in mantle cell lymphomas. Cancer Res. 2001;61:2409–2412. [PubMed] [Google Scholar]
- 22.Viré E, Brenner C, Deplus R, Blanchon L, Fraga M, Didelot C, et al. The Polycomb group protein EZH2 directly controls DNA methylation. Nature. 2006;439:871–874. doi: 10.1038/nature04431. [DOI] [PubMed] [Google Scholar]
- 23.Schlesinger Y, Straussman R, Keshet I, Farkash S, Hecht M, Zimmerman J, et al. Polycomb-mediated methylation on Lys27 of histone H3 pre-marks genes for de novo methylation in cancer. Nat Genet. 2007;39:232–236. doi: 10.1038/ng1950. [DOI] [PubMed] [Google Scholar]
- 24.Kondo Y, Shen L, Cheng AS, Ahmed S, Boumber Y, Charo C, et al. Gene silencing in cancer by histone H3 lysine 27 trimethylation independent of promoter DNA methylation. Nat Genet. 2008;40:741–750. doi: 10.1038/ng.159. [DOI] [PubMed] [Google Scholar]
- 25.McGarvey KM, Greene E, Fahrner JA, Jenuwein T, Baylin SB. DNA methylation and complete transcriptional silencing of cancer genes persist after depletion of EZH2. Cancer Res. 2007;67:5097–5102. doi: 10.1158/0008-5472.CAN-06-2029. [DOI] [PubMed] [Google Scholar]
- 26.Hernández-Muñoz I, Taghavi P, Kuijl C, Neefjes J, van Lohuizen M. Association of BMI1 with polycomb bodies is dynamic and requires PRC2/EZH2 and the maintenance DNA methyltransferase DNMT1. Mol Cell Biol. 2005;25:11047–11058. doi: 10.1128/MCB.25.24.11047-11058.2005. [DOI] [PMC free article] [PubMed] [Google Scholar]
- 27.Glazer RI, Hartman KD, Knode MC, Richard MM, Chiang PK, Tseng CK, et al. 3-Deazaneplanocin: a new and potent inhibitor of S-adenosylhomocysteine hydrolase and its effects on human promyelocytic leukemia cell line HL-60. Biochem Biophys Res Commun. 1986;135:688–694. doi: 10.1016/0006-291x(86)90048-3. [DOI] [PubMed] [Google Scholar]
- 28.Tan J, Yang X, Zhuang L, Jiang X, Chen W, Lee PL, et al. Pharmacologic disruption of Polycomb-repressive complex 2-mediated gene repression selectively induces apoptosis in cancer cells. Genes Dev. 2007;21:1050–1063. doi: 10.1101/gad.1524107. [DOI] [PMC free article] [PubMed] [Google Scholar]
- 29.Rao R, Nalluri S, Fiskus W, Savoie A, Buckley KM, Ha K, et al. Role of CAAT/enhancer binding protein homologous protein in panobinostat-mediated potentiation of bortezomib-induced lethal endoplasmic reticulum stress in mantle cell lymphoma cells. Clin Cancer Res. 2010;16:4742–4754. doi: 10.1158/1078-0432.CCR-10-0529. [DOI] [PMC free article] [PubMed] [Google Scholar]
- 30.Rao R, Lee P, Fiskus W, Yang Y, Joshi R, Wang Y, et al. Co-treatment with heat shock protein 90 inhibitor 17-dimethylaminoethylamino-17-demethoxygeldanamycin (DMAG) and vorinostat: a highly active combination against human mantle cell lymphoma (MCL) cells. Cancer Biol Ther. 2009;8:1273–1280. doi: 10.4161/cbt.8.13.8726. [DOI] [PMC free article] [PubMed] [Google Scholar]
- 31.Dasmahapatra G, Lembersky D, Son MP, Attkisson E, Dent P, Fisher RI, et al. Carfilzomib interacts synergistically with histone deacetylase inhibitors in mantle cell lymphoma cells in vitro and in vivo. Mol Cancer Ther. 2011;10:1686–1697. doi: 10.1158/1535-7163.MCT-10-1108. [DOI] [PMC free article] [PubMed] [Google Scholar] [Retracted]
- 32.Fiskus W, Pranpat M, Balasis M, Herger B, Rao R, Chinnaiyan A, et al. Histone deacetylase inhibitors deplete enhancer of zeste 2 and associated polycomb repressive complex 2 proteins in human acute leukemia cells. Mol Cancer Ther. 2006;5:3096–3104. doi: 10.1158/1535-7163.MCT-06-0418. [DOI] [PubMed] [Google Scholar]
- 33.Fiskus W, Buckley K, Rao R, Mandawat A, Yang Y, Joshi R, et al. Panobinostat treatment depletes EZH2 and DNMT1 levels and enhances decitabine mediated de-repression of JunB and loss of survival of human acute leukemia cells. Cancer Biol Ther. 2009;8:939–950. doi: 10.4161/cbt.8.10.8213. [DOI] [PMC free article] [PubMed] [Google Scholar]
- 34.Fiskus W, Wang Y, Sreekumar A, Buckley KM, Shi H, Jillella A, et al. Combined epigenetic therapy with the histone methyltransferase EZH2 inhibitor 3-deazaneplanocin A and the histone deacetylase inhibitor panobinostat against human AML cells. Blood. 2009;114:2733–2743. doi: 10.1182/blood-2009-03-213496. [DOI] [PMC free article] [PubMed] [Google Scholar]
- 35.Chou TC, Talalay P. Quantitative analysis of dose-effect relationships: the combined effects of multiple drugs or enzyme inhibitors. Adv Enzyme Regul. 1984;22:27–55. doi: 10.1016/0065-2571(84)90007-4. [DOI] [PubMed] [Google Scholar]
- 36.Balusu R, Fiskus W, Rao R, Chong DG, Nalluri S, Mudunuru U, et al. Targeting levels or oligomerization of nucleophosmin 1 induces differentiation and loss of survival of human AML cells with mutant NPM1. Blood. 2011;118:3096–3106. doi: 10.1182/blood-2010-09-309674. [DOI] [PMC free article] [PubMed] [Google Scholar]
- 37.Jiang X, Tan J, Li J, Kivimäe S, Yang X, Zhuang L, et al. DACT3 is an epigenetic regulator of Wnt/beta-catenin signaling in colorectal cancer and is a therapeutic target of histone modifications. Cancer Cell. 2008;13:529–541. doi: 10.1016/j.ccr.2008.04.019. [DOI] [PMC free article] [PubMed] [Google Scholar]
- 38.Chen J, Fiskus W, Eaton K, Fernandez P, Wang Y, Rao R, et al. Cotreatment with BCL-2 antagonist sensitizes cutaneous T-cell lymphoma to lethal action of HDAC7-Nur77-based mechanism. Blood. 2009;113:4038–4048. doi: 10.1182/blood-2008-08-176024. [DOI] [PubMed] [Google Scholar]
- 39.Varambally S, Cao Q, Mani RS, Shankar S, Wang X, Ateeq B, et al. Genomic loss of microRNA-101 leads to overexpression of histone methyltransferase EZH2 in cancer. Science. 2008;322:1695–1699. doi: 10.1126/science.1165395. [DOI] [PMC free article] [PubMed] [Google Scholar]
- 40.Friedman JM, Liang G, Liu CC, Wolff EM, Tsai YC, Ye W, et al. The putative tumor suppressor microRNA-101 modulates the cancer epigenome by repressing the polycomb group protein EZH2. Cancer Res. 2009;69:2623–2629. doi: 10.1158/0008-5472.CAN-08-3114. [DOI] [PubMed] [Google Scholar]
- 41.Zoabi M, Sadeh R, di Bie P, Ciechanover A. PRAJA1 is a ubiquitin ligase for the polycomb repressive complex 2 proteins. Biochem Biophys Res Commun. 2011;408:393–398. doi: 10.1016/j.bbrc.2011.04.025. [DOI] [PubMed] [Google Scholar]
- 42.Martín-Pérez D, Sánchez E, Maestre L, et al. Deregulated expression of the polycomb group protein SUZ12 targets genes characterizes mantle cell lymphoma. Am J Pathol. 2010;177:930–942. doi: 10.2353/ajpath.2010.090769. [DOI] [PMC free article] [PubMed] [Google Scholar]
- 43.Cao Q, Mani RS, Ateeq B, Dhanasekaran SM, Asangani IA, Prensner JR, et al. Coordinated regulation of polycomb group complexes through microRNAs in cancer. Cancer Cell. 2011;20:187–199. doi: 10.1016/j.ccr.2011.06.016. [DOI] [PMC free article] [PubMed] [Google Scholar]
- 44.Schuettengruber B, Martinez AM, Iovino N, Cavalli G. Trithorax group proteins: switching genes on and keeping them active. Nat Rev Mol Cell Biol. 2011;12:799–814. doi: 10.1038/nrm3230. [DOI] [PubMed] [Google Scholar]
- 45.Taberlay PC, Kelly TK, Liu CC, You JS, De Carvalho DD, Miranda TB, Zhou XJ, Liang G, Jones PA. Polycomb-repressed genes have permissive enhancers that initiate reprogramming. Cell. 2011;147:1283–1294. doi: 10.1016/j.cell.2011.10.040. [DOI] [PMC free article] [PubMed] [Google Scholar]
- 46.Kotake Y, Cao R, Viatour P, Sage J, Zhang Y, Xiong Y. pRB family proteins are required for H3K27 trimethylation and polycomb repression complexes binding to and silencing p16INK4A tumor suppressor gene. Genes Dev. 2007;21:49–54. doi: 10.1101/gad.1499407. [DOI] [PMC free article] [PubMed] [Google Scholar]
- 47.Dhawan S, Tschen SI, Bhushan A. Bmi-1 regulates the Ink4a/Arf locus to control pancreatic beta-cell proliferation. Genes Dev. 2009;23:906–911. doi: 10.1101/gad.1742609. [DOI] [PMC free article] [PubMed] [Google Scholar]
- 48.Oguro H, Yuan J, Ichikawa H, Ikawa T, Yamazaki S, Kawamoto H, et al. Poised lineage specification in multipotential hematopoietic stem and progenitor cells by the polycomb protein Bmi1. Cell Stem Cell. 2010;6:279–286. doi: 10.1016/j.stem.2010.01.005. [DOI] [PubMed] [Google Scholar]
- 49.Dickinson M, Ritchie D, Deangelo DJ, Spencer A, Ottmann OG, Fischer T, et al. Preliminary evidence of disease response to the pan deacetylase inhibitor panobinostat (LBH589) in refractory Hodgkin Lymphoma. Br J Haematol. 2009;147:97–101. doi: 10.1111/j.1365-2141.2009.07837.x. [DOI] [PubMed] [Google Scholar]
- 50.Copeland A, Buglio D, Younes A. Histone deacetylase inhibitors in lymphoma. Curr Opin Oncol. 2010;22:431–436. doi: 10.1097/CCO.0b013e32833d5954. [DOI] [PubMed] [Google Scholar]
Associated Data
This section collects any data citations, data availability statements, or supplementary materials included in this article.


