

Abstract
Context
Although prostate cancer (PCa) screening reduces the incidence of advanced disease and mortality, trade-offs include overdiagnosis and resultant overtreatment.
Objective
To review primary data on PCa overdiagnosis and overtreatment.
Evidence acquisition
Electronic searches were conducted in Cochrane Central Register of Controlled Trials, PubMed, and Embase from inception to July 2013 for original articles on PCa overdiagnosis and overtreatment. Supplemental articles were identified through hand searches.
Evidence synthesis
The lead-time and excess-incidence approaches are the main ways used to estimate overdiagnosis in epidemiological studies, with estimates varying widely. The estimated number of PCa cases needed to be diagnosed to save a life has ranged from 48 down to 5 with increasing follow-up. In clinical studies, generally lower rates of overdiagnosis have been reported based on the frequency of low-grade minimal tumors at radical prostatectomy (1.7–46.8%). Autopsy studies have reported PCa in 18.5–38.5%, although not all are low grade or low volume. Factors influencing overdiagnosis include the study population, screening protocol, and background incidence, limiting generalizability between settings. Reported rates of overtreatment vary widely in the literature, although contemporary international studies suggest increasing use of conservative management.
Conclusions
Epidemiological, clinical, and autopsy studies have been used to examine PCa overdiagnosis, with estimates ranging widely from 1.7% to 67%. Correspondingly, estimates of overtreatment vary widely based on patient features and may be declining internationally. Careful patient selection for screening and reducing overtreatment are important to preserve the benefits and reduce the downstream harms of prostate-specific antigen testing. Because all of these estimates are extremely population and context specific, this must be considered when using these data to inform policy.
Patient summary
Screening reduces spread and death from prostate cancer (PCa) but overdiagnoses some low-risk tumors that may not have caused harm. Because treatment has potential side effects, it is critical that not all patients with PCa receive aggressive treatment.
Keywords: Prostate cancer, Overdiagnosis, Overtreatment, Screening, Prostate-specific antigen
1. Introduction
Prostate cancer (PCa) screening has led to a reduction in advanced disease and disease-specific mortality. However, a trade-off is overdiagnosis of cases that would not have caused clinical consequences during a man’s lifetime if left untreated. In turn, overdiagnosis has led to overtreatment, with the potential for unnecessary side effects. Some of the gains in length of life from screening are offset to a varying extent by decrements in quality of life from downstream side effects (eg, from treatment), although this varies greatly based on patient preferences [1,2]. Many studies have attempted to characterize the extent of overdiagnosis and overtreatment resulting from PCa screening, with highly variable results. The many reasons for these disparities include the time period of the study and features of the underlying population (eg, age, comorbidities), and the definition of overdiagnosis. Broadly, most studies classify overdiagnosis as either an epidemiological or a clinical phenomenon. Published rates of overtreatment of potentially overdiagnosed cases have also varied widely across the literature for similar reasons. These issues are extremely important for PCa screening and treatment policy because overdiagnosis is generally considered the most important potential harm of PCa screening. Our goal was to review the major studies on overdiagnosis and overtreatment of clinically localized PCa including the methodological issues and pitfalls of these estimations.
2. Evidence acquisition
Electronic searches for the topics of overdiagnosis and overtreatment of PCa were conducted in Cochrane Central Register of Controlled Trials, PubMed, and Embase from inception to July 2013 with no language restrictions(see the Appendix for the full search strategy). Manual searches of the bibliographies were also performed to help identify additional relevant articles. All experimental and observational study designs were eligible for inclusion including but not limited to controlled clinical trials, statistical modeling, case series, case-control studies, and cohort studies. Comments, editorials, and review articles were excluded.
2.1. Results of the search
The search resulted in a total of 594 unique citations (Fig. 1). Initial title/abstract screening excluded 489 for not meeting core inclusion/exclusion criteria, leaving 105 citations for a full-text screening. Of these, 66 were excluded, leaving 39 for inclusion. Searches of bibliographies resulted in 14 additional citations for inclusion.
Fig. 1.
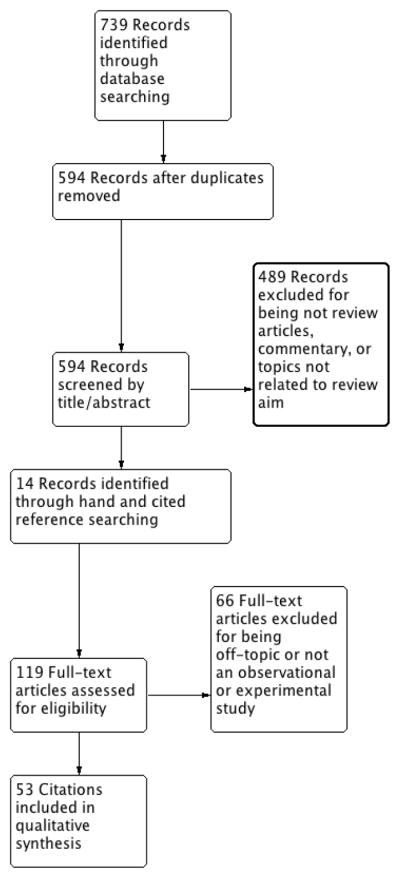
Literature selection process (Preferred Reporting Items for Systematic Reviews and Meta-analysis flow diagram).
Change off-topic to off topic
2.2. Selection of studies
One of the authors (S.L.) selected initial studies based on inclusion criteria using a title/abstract screening. These studies were initially categorized into three categories: excluded, included, and possibly relevant. The included and possibly relevant studies were then screened in full text by an expert panel using the same inclusion criteria to determine the final selection.
2.3. Data extraction and synthesis
The authors independently extracted data using a standardized form. Any discrepancies were resolved through discussion between the lead author (S.L.) and the relevant expert. Data extracted include study design; participant demographics; type of screening or treatment intervention; outcomes from interventions (biopsy results, detection rate, treatment frequency, and disease-related outcomes); and general limitations of the study design. We did not perform a formal assessment for bias or heterogeneity between studies for a complete systematic review. After data extraction, data were synthesized by the team of expert authors. The primary outcomes of interest were estimates of PCa overdiagnosis and overtreatment. Despite many different ways these outcomes were expressed in the literature, for this review the studies were broadly categorized into those using epidemiological criteria and those using clinical methods (Table 1). Within these global classifications, we grouped together studies into the following subcategories:epidemiologic al/modeling, registry/practice patterns, prostatectomy studies, and autopsy studies. It should be noted that the concepts of overdiagnosis and overtreatment are intimately intertwined. In particular, many of the clinical studies in our review described the rates of treatment for tumors that meet published criteria for potentially overdiagnosed disease, precluding the ability to completely separate these concepts in this review.
Table 1.
Methods used to estimate overdiagnosis in the literature
| Epidemiological | Clinical |
|---|---|
| Lead time: Estimate the lead-time distribution in the population using statistical models and calculate the chance that this exceeds the expected survival time for any given patient | Presence of minimal low-grade tumor on biopsy, radical prostatectomy, or autopsy specimens |
| Excess incidence: Compare the incidence under screening with the incidence in a comparable population in the absence of screening to estimate the number of “excess cases” |
3. Evidence synthesis
3.1. Epidemiological studies
The epidemiological definition defines overdiagnosis as the detection due to screening of a tumor that would not otherwise have been diagnosed within the patient’s lifetime. Thus an overdiagnosed case is a true case of cancer, but it is an extra diagnosis in that it would never have been detected clinically or symptomatically in the absence of screening. From an epidemiological standpoint, overtreatment signifies the potential lack of benefit as well as unnecessary cost and harm from treatment of an overdiagnosed case.
Overdiagnosis arises either when life expectancy at the time of screen detection is short due to advanced age or comorbidity, or when the tumor is indolent or slowly progressing [3]. In both cases, the lead time or the interval from screen detection to the point of clinical diagnosis exceeds the time interval from screen detection to death. In principle, therefore, one could estimate the chance of overdiagnosis by calculating the likelihood that the lead time exceeds the survival time. Clearly, the chance of overdiagnosis will depend on tumor and patient characteristics. Under this definition the likelihood of overdiagnosis is highly dependent on age at the time of screen detection and increases sharply as men age, and the same is true for overtreatment.
3.1.1. Measuring overdiagnosis and overtreatment
There are different ways to quantify the frequency of overdiagnosis and overtreatment in a screened population [4,5]. Some studies express the frequency of overdiagnosis as a fraction of screen-detected cases. Others estimate an absolute number of overdiagnosed cases in a defined population over a specified interval. Another measure used to characterize the extent of overdiagnosis is the additional number needed to treat or the (additional) number needed to detect (NND), which is the ratio of overdiagnoses to lives saved by a screening program. In contrast to pure measures of the extent of overdiagnosis, this measure attempts to quantify the harm-benefit trade-off of PCa screening. However, this measure focuses on mortality, ignoring other important end points such as the reduction in morbidity and treatment from advanced PCa due to screening [6].
Regardless of the measure used, published studies of PCa overdiagnosis have produced highly variable results ranging from 22% [7] to 67% [8] of screen-detected cases and NNDs ranging from 5 to 48 [9,10]. However, these estimates are not, strictly speaking, comparable. They differ for a number of reasons including (1) the method used to estimate lead time and/or overdiagnosis, (2) populations studied, (3) screening and biopsy practices, (4) diagnostic patterns in the absence of screening, and (5) the age range corresponding to the incidence data used for estimation.
3.1.2. Estimating overdiagnosis
Two competing approaches are used to estimate overdiagnosis in epidemiological studies (Table 1). The first uses statistical models to estimate the lead-time distribution in a given population and then calculates the chance that this exceeds the expected (other cause) survival time for any given patient. The second simply compares the incidence under screening with incidence in a comparable population without screening (the counterfactual incidence) and effectively attributes “excess cases” to overdiagnosis. These two approaches have been referred to as the “lead-time” and “excess-incidence” approaches, respectively [4]. The excess-incidence approach is perhaps more intuitive and certainly more straightforward to calculate but may provide inflated estimates of overdiagnosis, particularly during the early years of screening dissemination [11,12]. A review of studies of overdiagnosis in breast and PCa screening found that excess-incidence studies typically produced significantly higher estimates of the likelihood of overdiagnosis than lead-time studies [4]. In this section we review each of the two approaches and then discuss the factors that affect the estimated frequency of overdiagnosis independently of the approach used (see Table 2 for a summary of epidemiological studies).
Table 2.
Epidemiological studies of overdiagnosis
| Study | Setting | Definition | Method | Results |
|---|---|---|---|---|
| Draisma et al [8] | Rotterdam section of ERSPC | Overdiagnoses/screen-detected cases | Lead time using MISCAN model | 67% |
| Draisma et al [17] | US population | Overdiagnoses/screen-detected cases | Three models | Model 1: 23% Model 2: 28% Model 3: 42% |
| Telesca et al [7] | US population | Overdiagnoses/screen-detected cases | Lead time | Whites: 22% Blacks: 33% |
| Welch et al [21] | US population | No. of cases overdiagnosed 1987–2005 | Excess incidence | 1.3 million men |
| Schroder [20] | ERSPC | Excess cases in screened group/lives saved over 9 yr (NND) | Excess incidence | 48 |
| Schroder [9] | ERSPC | Excess cases in screened group/lives saved over 11 yr (NND) | Excess incidence | 37 |
| Loeb [24] | ERSPC (future projection) | Excess cases in screened group/lives saved over 12 yr (NND) | Excess incidence (projected) | 18 |
| Gulati et al [22] | US population | Excess cases in screened group/lives saved over 25 yr (NND) | Excess incidence (projected) | 9 |
| Hugosson et al [25] | Sweden | Excess cases in screened group/lives saved over 14 yr (NND) | Excess incidence | 12 |
| Kilpelainen et al [23] | Finland | Excess cases in screened group/lives saved over 12 yr (NND) | Excess incidence | 25 |
| Pashayan et al [16] | United Kingdom | Overdiagnosis/number screened Overdiagnoses/cases detected |
Lead time by catch-up method | 8 per 1000 22.7% |
| Heijnsdijk et al [2] | ERSPC | Overdiagnoses/deaths prevented (NND) | Modeling/lead time | 5 |
| Gulati et al [26] | US population | Modeling/lead time | 5 |
ERSPC = European Randomized Study of Screening for Prostate Cancer; MISCAN = Microsimulation Screening Analysis; NND = number needed to detect.
3.1.2.1. Modeling studies estimating lead time and overdiagnosis
The lead-time approach has been used most to estimate overdiagnosis from prostate-specific antigen (PSA) screening [7,13–18]. However, published results vary due to the methods and populations used. Disease modeling studies based on US incidence trends have estimated that 22% [7] to 42% [17] of screen-detected cases of PCa in the United States are overdiagnosed. Draisma et al [17] used three different models to estimate overdiagnosis using the same definition and the same data (US population incidence and screening frequencies from a retrospective analysis of US survey and claims data) [18]. The model estimates of the percentage of screen-detected cases overdiagnosed ranged from 23% to 42%. This variation was attributable solely to different model assumptions and the different ways that they conceptualized and estimated disease progression without screening. In this study all the models assumed that disease incidence would have remained constant if PSA screening had not been introduced in the United States, but Telesca and colleagues [7] showed the sensitivity of these estimates to assumptions about incidence trends in the absence of screening.
Non-US lead-time studies have used various approaches to estimate lead time and overdiagnosis. Savage and colleagues used data from PCa cases diagnosed in Sweden with previously stored serum from the Malmo Preventive Project [13]. Lead time was estimated based on the intervals from their blood draw to the date of cancer diagnosis among men with a PSA ≥ 3 ng/ml at the initial blood draw. However, this design may be prone to overestimating the lead time in a prospective screening study because it assumes that cases with an elevated PSA at blood draw had biopsy-detectable disease at that time.
Several studies have used versions of the “catch-up” time method to estimate the lead time [19]. This method estimates the lead time as the time it takes (or would be expected to take) for the number of cases in an unscreened group to accumulate to equal the number diagnosed at a prevalence screen in a screened group. Auvinen et al applied this method to data from the Finnish European Randomized Study of Screening for Prostate Cancer (ERSPC) and estimated a lead time of 5–7 yr depending on age at screening [14]. Finne et al applied a similar approach to data from the ERSPC and estimated a mean lead time of 6.8 yr, although this varied from 4 to 8 yr between countries [15]. The catch-up time method was also used by Pashayan et al using data from the UK ProTecT trial [16]. This study estimated lead times of 11–12 yr depending on age and an overdiagnosis frequency ranging from 10% among men detected at 50–54 yr of age to 31% among men detected at 65–69 yr. Because these estimates are based on the specific population and screening protocol used, they may not be generalizable to different populations or protocols.
3.1.2.2. Excess-incidence approaches
The excess-incidence approach has been used to approximate overdiagnosis in the ERSPC [9,20] and also in a US population study [21]. The primary publication from the ERSPC noted that 8.2% of the screening arm was diagnosed with PCa, compared with only 4.8% of the control group. This excess incidence in the screened group yielded a projection of a 58% overdiagnosis among screen-detected cases. This excess-incidence estimate was cited in a 2010 article by Welch and Black [3] and used by ERSPC investigators [20] to estimate that 48 men needed to be treated to prevent one PCa death at 9 yr.
A US population study [21] estimated that disease incidence would have remained at pre-PSA levels in the absence of screening and projected that screening led to the overdiagnosis of 1.3 million men by 2005. This amounts to 37% of all cases detected, considerably more than even the highest lead time–based estimate of Draisma et al [17], which amounted to only 18.6% of detected cases.
3.1.2.3. The additional number needed to detect
The NND is another measure designed to compare the expected cases overdiagnosed by a screening program with the lives saved by that program. Empirical estimates of the NND are primarily from the ERSPC [9,20] and have been calculated as the ratio of the excess cases in the screened group to the lives saved relative to the control group. However, these estimates of the NND are highly time dependent and demonstrably overestimate the long-term NND. This is because the numerator of the empirical NND (excess incidence as a proxy for overdiagnosis) is too high and the denominator of the empirical NND (lives saved over the limited term) is too low [22].
Not only are empirical NND estimates from later time points invariably lower than those from earlier time points (eg, the NND estimate from the updated ERSPC report at 11 yr is 37 [9] in contrast to the earlier estimate of 48 [20] in the original report), but long-term projections of the NND are dramatically lower than either of these short-term estimates. In the Finnish ERSPC (n = 80 144), Kilpelainen et al reported a number needed to be invited of 1199 and to detect of 25 at 12 yr [23]. Loeb [24] projected that NND in the overall ERSPC would decrease to 18 at year 12, and Gulati and colleagues projected an NND of 9 at 25 yr [22]. In the Goteborg randomized population-based study, at 14 yr the number needed to screen was 293, and NND was 12 in the intent-to-treat analysis [25]. Two recent modeling studies [2,26] projected long-term NNDs of approximately five overdiagnoses per life saved, with some variation depending on the specific screening protocol assumed. Thus NND estimates based on limited term follow-up must be treated with caution and generally overestimate the harm-benefit trade-offs of screening.
3.1.3. Factors affecting rates of overdiagnosis
Overdiagnosis estimates are strongly affected by the population studied [10], the background incidence of disease in the absence of screening, and screening protocols and practices [27]. In the United States, Telesca and colleagues found that overdiagnosis among blacks was higher than among whites, although whether this was attributable to differences in background practice patterns or differences in screening and biopsy practices was unclear [7].
Differences are also apparent in estimates of overdiagnosis from US and European studies. For example, Draisma et al [8,17] used the same model to estimate overdiagnosis in the Rotterdam ERSPC and in the US population. They projected that 67% of screen-detected cases in the Rotterdam trial were overdetected; however, this number was reduced to 42% in the US population. The differences between these estimates are due primarily to differences between the US and European populations and variations in the screening practices in the two settings. Prior to screening, background incidence in the United States was consistently higher than in Europe due to greater diagnostic intensity with respect to PCa detection in the United States [28]. Thus the size of the latent pool of PCa and the potential for overdiagnosis were already much higher in Europe. Further, the ERSPC referred men to biopsy at a PSA of 3 ng/ml, and the vast majority of Dutch cases complied with this recommendation [29]. However, in the United States, the original threshold for biopsy referral was 4.0 ng/ml and, according to a biopsy follow-up study conducted by the US Prostate, Lung, Colorectal and Ovarian Cancer screening trial [30], only about 40% of men with an elevated PSA received a biopsy within 1 yr. It is likely that these differences generated a higher frequency of overdiagnosed cases in the ERSPC even though screening was less frequent (every 4 yr in most centers) than in the US population setting (every 1–2 yr). Another key factor affecting the rate of overdiagnosis is the age of the population [31]. Gulati et al [26] found that the screening interval affected overdiagnosis less than the ages screened or the PSA cut-offs used for referral to biopsy and specifically recommended using higher cut-offs for biopsy referral, particularly among older men, to reduce the likelihood of overdiagnosis. Another modeling study by Heijnsdijk et al estimated that screening at 4-yr intervals from 55 to 70 yr of age increased overdiagnosis by 47% compared with no screening [32]. Extending the stop age to 75 yr led to the greatest increase in overdiagnosis and cost.
3.2. Clinical studies of overdiagnosis and overtreatment
3.2.1. Registry studies and practice patterns
The clinical definition of overdiagnosis essentially equates overdiagnosis with low-risk clinical or pathologic features of the tumor. This definition thus considers low-risk tumors as overdiagnosed. Overdiagnosis estimates derived using this definition are not comparable with epidemiological estimates of overdiagnosis and do not show as strong an age dependence as those based on the epidemiological definition.
For example, numerous large observational studies have attempted to quantify overdiagnosis and overtreatment in this sense by reporting trends in the incidence and treatment patterns for low-risk PCa. In the US CaPSURE database, Cooperberg et al reported an increase in the proportion of low-risk disease from 29.8% (1989–1992) to 32.6% (1993–1995) to 45.3% (1999–2001) [33]. Among these low-risk patients, age, socioeconomic status, insurance type, region, and year were all associated with the likelihood of aggressive primary treatment. A later study by Dall’era et al examined men diagnosed with PCa in CaPSURE from 1995 to 2007 [34]. Clinically insignificant disease (defined as PSA <10 ng/ml, clinical stage T1 or CT2a, no Gleason pattern 4/5, and <33% positive biopsies) was present in 41%. Insignificant disease was significantly more common in younger men with higher education and private insurance (indicating the higher likelihood of this population to undergo screening), and most men underwent active treatment.
Daskivich et al reported that 54% of a US veteran population with low-risk PCa and significant comorbidity (Charlson score ≥ 3) received treatment [35]. Chronological age was a stronger predictor of active treatment for low-risk disease than comorbidity.
Using Surveillance Epidemiology and End Results (SEER) data from 2000 to 2002, Miller et al reported that 55% of men with lower risk PCa underwent aggressive therapy, and it was more likely among younger men [36]. However, this study only included men >65 yr of age, and the assumption that all low-risk cancer is appropriate for observation may be flawed. In a later study using the SEER registry (2004–2006), Shao et al reported on men diagnosed with PCa at PSA <4 ng/ml [37]. Overall, 54% had low-risk disease and 75% underwent radical prostatectomy or radiation therapy.
With respect to practice patterns in elderly men, Shao et al showed that those with more PSA tests during the 5 yr prior to PCa diagnosis were more likely to receive PCa treatment, thus indicating a positive correlation between aggressiveness of screening and aggressiveness of treatment in the United States [38]. In another study using SEER data (2004–2008), Mishra et al reported on 15 109 men >70 yr of age with favorable-risk disease [39]. Of these men, 2.6% received radical prostatectomy and 59% had radiation therapy. Within this favorable-risk elderly population, aggressive treatment was more likely with younger age, married status, and higher grade disease (Gleason 6 vs ≤ 5).
Several other US studies have reported high rates of active treatment among men with low-risk screen-detected cancers. This is particularly true for certain subgroups, such as young men. For example, Kim et al reported that 96% of very low-risk patients age ≤ 55 yr from the Department of Defense chose active treatment [40]. Nevertheless, given the relatively short follow-up of most contemporary active surveillance programs, the very long-term outcomes of these young men without definitive treatment remain uncertain.
An important point is that overdiagnosis does not have to lead to overtreatment, and screening will continue to be contentious in the United States without a reduction in overtreatment. One of the most important ways is to expand the role of conservative management, particularly for patients with low-risk disease and a limited life expectancy. It is noteworthy that other countries with different health care systems have reported more than threefold higher rates of conservative management than previously reported in the United States. For example, in Sweden from 2007 to 2011, 59% of very low-risk and 41% of low-risk patients from the nationwide registry chose active surveillance [41]. Similarly, two recent observational series from Australia reported initial active surveillance in >40% of low-risk patients [42,43].
Although conservative management may reduce costs compared with radical prostatectomy for clinically localized PCa [44], it is also important to consider effectiveness and to define the ideal subgroups for active treatment versus conservative management. Using a mathematical model, McGregor et al estimated that for every 100 men detected by screening, only 16 would have their lives extended by surgery [45]. However, this model based on data from Quebec may not be generalizable to other populations. More recently, Xia et al developed a model to combine information on time from diagnosis to treatment from a Johns Hopkins active surveillance cohort and time to progression following treatment from the CaPSURE database [46]. The model results implied that only 1–2 of every 100 low-risk cases diagnosed would have their lives saved by immediate surgery.
3.2.2. Biopsy/prostatectomy studies of overdiagnosis
Numerous clinical studies have estimated the frequency of overdiagnosis based on the rates of insignificant tumor histology found at biopsy and/or radical prostatectomy. Specifically, most of these studies considered overdiagnosed cases as the proportion of biopsies that met criteria for insignificant disease or the proportion of radical prostatectomy specimens that contained organ-confined, low-grade, and low-volume disease and analyzed predictors of this finding. Conversely, some studies also examined the opposite scenario of underdiagnosis, in which the histology at radical prostatectomy had more aggressive features, suggesting a potential case where earlier diagnosis may have led to improved results [47].
Table 3 summarizes radical prostatectomy studies of potential overdiagnosis/overtreatment. In a large German series, Noldus et al reported that the frequency of overdiagnosis remained stable at 2–5% from 1994 to 1999 based on the frequency of small cancers (<0.5 ml) at prostatectomy [48]. In 2126 US men with PSA-detected disease undergoing radical prostatectomy, Graif et al reported overdiagnosis of insignificant tumors (defined as organ-confined disease with negative margins, tumor volume <0.5 ml, and no Gleason pattern 4 or 5) in only 1.3–7.1% of cases, compared with a much higher proportion (25–30%) with aggressive tumor features (which they called “underdiagnosis”) [47]. However, a limitation of these studies is that the results depend on the specific tumor volume and other criteria used to define insignificant disease.
Table 3.
Radical prostatectomy studies estimating possible overdiagnosis
| Study | Location | Definition | Main result |
|---|---|---|---|
| Graif et al [47] | United States | Organ confined, negative margins, <0.5 ml, no Gleason pattern 4 or 5 | 5% |
| Noldus et al [48] | Germany | <0.5 ml | 2–5% from 1994 to 1999 |
| Pelzer et al [52] | Austria | Epstein insignificant | 8.7% |
| Pelzer et al [51] | Austria | pT2a, Gleason <7, negative margins | 16.8% screened group, 7.9% referrals |
| Pelzer et al [50] | Austria | pT2a, Gleason <7, negative margins | 17.4% screened group, 8.9% referrals |
| Postma et al [53] | Netherlands | Organ confined, <0.5 ml, no Gleason pattern 4 or 5 | 31.6% first screening round, 42.6% second screening round |
| Resnick et al [55] | United States | Organ confined, negative margins, <10% estimated tumor volume, Gleason ≤ 6 | 31.3%, 1 prior biopsy; 43.8%, 2 prior biopsies; 46.8%, 3+ prior biopsies |
Several factors such as serial screening have been associated with increasing overdiagnosis of insignificant or low-grade disease [49] and thus a lower frequency of finding adverse pathologic features at radical prostatectomy. For example, Pelzer reported significantly less underdiagnosis (defined as pathologic stage T3+ or a positive surgical margin) in screened men compared with nonscreened men [50–52]. Postma et al compared treatment patterns and pathologic features between men from rounds 1 and 2 of the Rotterdam ERSPC [53]. This study showed a significantly greater proportion of minimal tumors at radical prostatectomy specimen (42.6% vs 31.6%), as well as a greater utilization of watchful waiting (22% vs 10%), among men diagnosed in the second round compared with the first round.
Men undergoing multiple repeat prostate biopsies are also more likely to have pathologically insignificant PCa detected. Park reported that men with two and three prior biopsies had 2.7-fold and 4.7-fold increased odds of clinically insignificant disease using biopsy criteria [54]. Similarly, Resnick et al reported insignificant prostatectomy pathology (organ confined with negative margins, Gleason score ≤ 6, and <10% estimated volume) in 31.3%, 43.8%, and 46.8% of men with one, two, and three or more previous prostate biopsies [55].
Other clinical studies have expressed greater concern about the potential for underdiagnosis and undertreatment. At one extreme, Brausi et al reported on a group of 71 patients with atypical small acinar proliferation of prostate (ASAP) on prostate biopsy [56]. Of these men, 25 underwent prostatectomy and PCa was found in all cases. Among the remainder, 39% were diagnosed with PCa during follow-up. The authors expressed concern about the potential for delayed diagnosis or losses to follow-up without immediate treatment for ASAP. Although radical prostatectomy is extremely aggressive and not recommended for men with isolated ASAP on prostate biopsy, the issue of PCa underdiagnosis in general has received relatively less attention. This is particularly true in certain populations with a persistently high frequency of underdiagnosis rather than overdiagnosis, such as low-income uninsured men [57].
3.2.3. Autopsy studies
Autopsy studies may provide a clue to the potential for overdiagnosis in a screened population because they provide an assessment of the size of the pool of latent preclinical cases (Table 4). However, these studies are not very frequent, and the sample size is often small. In a classic study of 249 men 20–69 yr of age, Sakr et al reported histologic PCa in 24% of men [58]. PCa was found in 2%, 29%, 32%, 55%, and 64% of men in their 20s, 30s, 40s, 50s, and 60s. Some other international studies have similarly reported high rates of PCa at autopsy, such as 38.8% of 139 autopsies in Hungary [59]. Of these cases, 35.2% were >0.5 ml in volume, and 8% were Gleason ≥ 7. In a large study of 320 autopsies, Zlotta et al recently reported histologic evidence of PCa in 37.3% of Russian and 35.0% of Asian men, both populations without widespread screening [60]. Interestingly, 23.1% and 51.4% of cancers in these respective populations were Gleason ≥ 7, raising questions about the definition for latent PCa. Haas et al reported a 29% PCa detection rate in 164 autopsy prostates, of which 42.6% were considered clinically significant based on histologic criteria [61].
Table 4.
Studies reporting the rates of prostate cancer detection at autopsy
| Autopsy study | Location | Sample size | Prostate cancer detection rate, % |
|---|---|---|---|
| Sakr et al [58] | United States | 249 | 24 |
| Soos et al [59] | Hungary | 139 | 38.8 |
| Zlotta et al [60] | Russian vs Asian | 320 | 37.3 vs 35.0 |
| Haas et al [61] | United States | 164 | 42.6 |
| Sanchez-Chapado et al [62] | Spain | 162 | 18.5 |
| Stamatiou et al [63] | Greece | 212 | 18.8 |
Other populations have reported somewhat lower rates of PCa at autopsy. In white Mediterranean men 20–80 yr of age from Spain, PCa was found in 18.5% of cases [62]. Similarly, Stamatiou et al reported 18.8% PCa in a Greek autopsy series [63]. Of these cases, 70.7% had a tumor volume <1 ml, 60% were multifocal, and 12.5% were Gleason ≥ 7. Note that interpretation of autopsy studies must take into account the age distribution of the included individuals, PCa detection practices in the population studied, and any selection criteria that must have been applied to select individuals for autopsy.
3.3. Future directions
Significant research has been dedicated to identifying better ways to differentiate which men have life-threatening PCa. Several nomograms have been developed considering multiple variables together to predict clinically significant PCa. In a large radical prostatectomy cohort, Chun et al reported that 65 of 1132 men (5.7%) had pathologically insignificant PCa (organ confined, tumor volume <0.5 ml, no Gleason pattern 4 or 5) [64]. They created a nomogram to predict clinically significant disease based on PSA, clinical stage, biopsy Gleason score, core cancer length, and the percentage of positive biopsies, which performed favorably compared with an earlier nomogram by Kattan et al [65], although the utility of these nomograms relies on the operational clinical criteria used to define significant tumor histology. Gulati and colleagues (JNCI, in press) have developed a model-based nomogram for the likelihood of overdiagnosis (epidemiological definition) given age, PSA, biopsy grade, and clinical stage at diagnosis. Other new markers and imaging may help to distinguish life-threatening PCa in the future. These include adjunctive PSA-based measurements such as PSA velocity and the Prostate Health Index [66], magnetic resonance imaging [67], genetic variants [68], new tissue-based risk stratification tests [69], and many others beyond the scope of this review.
4. Conclusions
Many different types of study designs have been used to estimate PCa overdiagnosis. Depending on the method used for the calculation, underlying population characteristics, and screening protocol, these estimates have ranged from as low as 1.7% to as high as 67%. Limitations of methods, populations, and approaches used should be taken into account when interpreting these overdiagnosis estimates. Substantial differences between populations limit the ability to generate policy based on estimates of overdiagnosis from another context. That notwithstanding, more careful patient selection for screening and dissociating diagnosis from treatment are essential to reduce harms. Recent international studies have suggested a higher frequency of initial conservative management than in the past. In the future, continued improvements in patient selection, markers, and clinical staging may help to further reduce both overdiagnosis and overtreatment.
Take-home message.
Estimates of prostate cancer overdiagnosis vary widely from 1.7% to 67% due to substantial differences in the method of calculation, underlying population characteristics, and screening protocols. Dissociating diagnosis from treatment and improvements in staging are essential to reduce the downstream harms of screening.
Acknowledgments
Funding/Support and role of the sponsor: None.
Appendix – PubMed search strategy
(((overtreatment[All Fields] OR overtreatment’[All Fields] OR overtreatments[All Fields]) OR (over treatment[All Fields] OR over treatments[All Fields]) OR (unjustified treatment[All Fields] OR unjustified treatments[All Fields]) OR (unnecessary treatment[All Fields] OR unnecessary treatments[All Fields])) OR (overdetection[All Fields] OR over-detection[All Fields] OR over-detected[All Fields] OR overdetected[All Fields] OR overdiagnosis[All Fields] OR over-diagnosis[All Fields] OR overdiagnoses[All Fields] OR over-diagnoses[All Fields])) AND ((((“prostate” [MeSH Terms] OR “prostate” [All Fields]) OR (“prostate” [MeSH Terms] OR “prostate” [All Fields] OR “prostatic” [All Fields])) AND ((“neoplasms” [MeSH Terms] OR “neoplasms” [All Fields] OR “cancer” [All Fields]) OR (“neoplasms” [MeSH Terms] OR “neoplasms” [All Fields] OR “cancers” [All Fields]) OR (“neoplasms” [MeSH Terms] OR “neoplasms” [All Fields] OR “neoplasm” [All Fields]) OR (“neoplasms” [MeSH Terms] OR “neoplasms” [All Fields]))) OR “prostatic neoplasms” [MeSH Terms])
Footnotes
Author contributions: Stacy Loeb had full access to all the data in the study and takes responsibility for the integrity of the data and the accuracy of the data analysis.
Study concept and design: Loeb, Bjurlin, Etzioni.
Acquisition of data: Loeb, Bjurlin, Nicholson, Tammela, Penson, Carter, Carroll, Etzioni.
Analysis and interpretation of data: Loeb, Bjurlin, Tammela, Penson, Carter, Carroll, Etzioni.
Drafting of the manuscript: Loeb, Bjurlin, Nicholson, Etzioni.
Critical revision of the manuscript for important intellectual content: Tammela, Penson, Carter, Carroll.
Statistical analysis: Nicholson.
Obtaining funding: Loeb, Etzioni.
Administrative, technical, or material support: Loeb, Bjurlin, Nicholson, Tammela, Penson, Carter, Carroll, Etzioni.
Supervision: Loeb, Etzioni.
Other (specify): None.
Financial disclosures: Stacy Loeb certifies that all conflicts of interest, including specific financial interests and relationships and affiliations relevant to the subject matter or materials discussed in the manuscript (eg, employment/affiliation, grants or funding, consultancies, honoraria, stock ownership or options, expert testimony, royalties, or patents filed, received, or pending), are the following: Ruth Etzioni is supported by Award U01 CA157224 from the National Cancer Institute. Stacy Loeb is supported by the National Institutes of Health (award number K07CA178258). The content is solely the responsibility of the authors and does not necessarily represent the official views of the National Institutes of Health.
Publisher's Disclaimer: This is a PDF file of an unedited manuscript that has been accepted for publication. As a service to our customers we are providing this early version of the manuscript. The manuscript will undergo copyediting, typesetting, and review of the resulting proof before it is published in its final citable form. Please note that during the production process errors may be discovered which could affect the content, and all legal disclaimers that apply to the journal pertain.
References
- 1.Boniol M, Boyle P, Autier P, Ruffion A, Perrin P. Critical role of prostate biopsy mortality in the number of years of life gained and lost within a prostate cancer screening programme. BJU Int. 2012;110:1648–52. doi: 10.1111/j.1464-410X.2012.11513.x. [DOI] [PubMed] [Google Scholar]
- 2.Heijnsdijk EA, Wever EM, Auvinen A, et al. Quality-of-life effects of prostate-specific antigen screening. N Engl J Med. 2012;367:595–605. doi: 10.1056/NEJMoa1201637. [DOI] [PMC free article] [PubMed] [Google Scholar]
- 3.Welch HG, Black WC. Overdiagnosis in cancer. J Natl Cancer Inst. 2010;102:605–13. doi: 10.1093/jnci/djq099. [DOI] [PubMed] [Google Scholar]
- 4.Etzioni R, Gulati R, Mallinger L, Mandelblatt J. Influence of study features and methods on overdiagnosis estimates in breast and prostate cancer screening. Ann Intern Med. 2013;158:831–8. doi: 10.7326/0003-4819-158-11-201306040-00008. [DOI] [PMC free article] [PubMed] [Google Scholar]
- 5.de Gelder R, Heijnsdijk EAM, van Ravesteyn NT, Fracheboud J, Draisma G, de Koning HJ. Interpreting overdiagnosis estimates in population-based mammography screening. Epidemiol Rev. 2011;33:111–21. doi: 10.1093/epirev/mxr009. [DOI] [PMC free article] [PubMed] [Google Scholar]
- 6.Hartzband P, Groopman J. There is more to life than death. N Engl J Med. 2012;367:987–9. doi: 10.1056/NEJMp1207052. [DOI] [PubMed] [Google Scholar]
- 7.Telesca D, Etzioni R, Gulati R. Estimating lead time and overdiagnosis associated with PSA screening from prostate cancer incidence trends. Biometrics. 2008;64:10–9. doi: 10.1111/j.1541-0420.2007.00825.x. [DOI] [PubMed] [Google Scholar]
- 8.Draisma G, Boer R, Otto SJ, et al. Lead times and overdetection due to prostate-specific antigen screening: estimates from the European Randomized Study of Screening for Prostate Cancer. J Natl Cancer Inst. 2003;95:868–78. doi: 10.1093/jnci/95.12.868. [DOI] [PubMed] [Google Scholar]
- 9.Schroder FH. Prostate-cancer mortality at 11 years of follow-up. N Engl J Med. 2012;366:981–90. doi: 10.1056/NEJMoa1113135. [DOI] [PMC free article] [PubMed] [Google Scholar]
- 10.Crawford ED, Grubb R, III, Black A, et al. Comorbidity and mortality results from a randomized prostate cancer screening trial. J Clin Oncol. 2011;29:355–61. doi: 10.1200/JCO.2010.30.5979. [DOI] [PMC free article] [PubMed] [Google Scholar]
- 11.Puliti D, Duffy SW, Miccinesi G, et al. Overdiagnosis in mammographic screening for breast cancer in Europe: a literature review. J Med Screen. 2012;19(Suppl 1):42–56. doi: 10.1258/jms.2012.012082. [DOI] [PubMed] [Google Scholar]
- 12.Biesheuvel C, Barratt A, Howard K, Houssami N, Irwig L. Effects of study methods and biases on estimates of invasive breast cancer overdetection with mammography screening: a systematic review. Lancet Oncol. 2007;8:1129–38. doi: 10.1016/S1470-2045(07)70380-7. [DOI] [PubMed] [Google Scholar]
- 13.Savage CJ, Lilja H, Cronin AM, Ulmert D, Vickers AJ. Empirical estimates of the lead time distribution for prostate cancer based on two independent representative cohorts of men not subject to prostate-specific antigen screening. Cancer Epidemiol Biomarkers Prev. 2010;19:1201–7. doi: 10.1158/1055-9965.EPI-09-1251. [DOI] [PMC free article] [PubMed] [Google Scholar]
- 14.Auvinen A, Maattanen L, Stenman UH, et al. Lead-time in prostate cancer screening (Finland) Cancer Causes Control. 2002;13:279–85. doi: 10.1023/a:1015040231402. [DOI] [PubMed] [Google Scholar]
- 15.Finne P, Fallah M, Hakama M, et al. Lead-time in the European Randomised Study of Screening for Prostate Cancer. Eur J Cancer. 2010;46:3102–8. doi: 10.1016/j.ejca.2010.09.034. [DOI] [PubMed] [Google Scholar]
- 16.Pashayan N, Duffy SW, Pharoah P, et al. Mean sojourn time, overdiagnosis, and reduction in advanced stage prostate cancer due to screening with PSA: implications of sojourn time on screening. Br J Cancer. 2009;100:1198–204. doi: 10.1038/sj.bjc.6604973. [DOI] [PMC free article] [PubMed] [Google Scholar]
- 17.Draisma G, Etzioni R, Tsodikov A, et al. Lead time and overdiagnosis in prostate-specific antigen screening: importance of methods and context. J Natl Cancer Inst. 2009;101:374–83. doi: 10.1093/jnci/djp001. [DOI] [PMC free article] [PubMed] [Google Scholar]
- 18.Mariotto A, Etzioni R, Krapcho M, Feuer EJ. Reconstructing prostate-specific antigen (PSA) testing patterns among black and white men in the US from Medicare claims and the National Health Interview Survey. Cancer. 2007;109:1877–86. doi: 10.1002/cncr.22607. [DOI] [PubMed] [Google Scholar]
- 19.Draisma G, van Rosmalen J. A note on the catch-up time method for estimating lead or sojourn time in prostate cancer screening. Stat Med. 2013;32:3332–41. doi: 10.1002/sim.5750. [DOI] [PMC free article] [PubMed] [Google Scholar]
- 20.Schroder FH. Screening and prostate-cancer mortality in a randomized European study. N Engl J Med. 2009;360:1320–8. doi: 10.1056/NEJMoa0810084. [DOI] [PubMed] [Google Scholar]
- 21.Welch HG, Albertsen PC. Prostate cancer diagnosis and treatment after the introduction of prostate-specific antigen screening: 1986–2005. J Natl Cancer Inst. 2009;101:1325–9. doi: 10.1093/jnci/djp278. [DOI] [PMC free article] [PubMed] [Google Scholar]
- 22.Gulati R, Mariotto AB, Chen S, Gore JL, Etzioni R. Long-term projections of the harm-benefit trade-off in prostate cancer screening are more favorable than previous short-term estimates. J Clin Epidemiol. 2011;64:1412–7. doi: 10.1016/j.jclinepi.2011.06.011. [DOI] [PMC free article] [PubMed] [Google Scholar]
- 23.Kilpelainen TP, Tammela TL, Malila N, et al. Prostate cancer mortality in the Finnish randomized screening trial. J Natl Cancer Inst. 2013;105:719–25. doi: 10.1093/jnci/djt038. [DOI] [PubMed] [Google Scholar]
- 24.Loeb S. What is the true number needed to screen and treat to save a life with prostate-specific antigen testing? J Clin Oncol. 2011;29:464–7. doi: 10.1200/JCO.2010.30.6373. [DOI] [PMC free article] [PubMed] [Google Scholar]
- 25.Hugosson J, Carlsson S, Aus G, et al. Mortality results from the Goteborg randomised population-based prostate-cancer screening trial. Lancet Oncol. 2010;11:725–32. doi: 10.1016/S1470-2045(10)70146-7. [DOI] [PMC free article] [PubMed] [Google Scholar]
- 26.Gulati R, Gore JL, Etzioni R. Comparative effectiveness of alternative prostate-specific antigen-based prostate cancer screening strategies: model estimates of potential benefits and harms. Ann Intern Med. 2013;158:145–53. doi: 10.7326/0003-4819-158-3-201302050-00003. [DOI] [PMC free article] [PubMed] [Google Scholar]
- 27.Davidov O, Zelen M. Overdiagnosis in early detection programs. Biostatistics. 2004;5:603–13. doi: 10.1093/biostatistics/kxh012. [DOI] [PubMed] [Google Scholar]
- 28.Neppl-Huber C, Zappa M, Coebergh JW, et al. Changes in incidence, survival and mortality of prostate cancer in Europe and the United States in the PSA era: additional diagnoses and avoided deaths. Ann Oncol. 2012;23:1325–34. doi: 10.1093/annonc/mdr414. [DOI] [PubMed] [Google Scholar]
- 29.Roobol MJ, Kranse R, Bangma CH, et al. Screening for prostate cancer: results of the Rotterdam section of the European randomized study of screening for prostate cancer. Eur Urol. 2013;64:530–9. doi: 10.1016/j.eururo.2013.05.030. [DOI] [PubMed] [Google Scholar]
- 30.Pinsky PF, Andriole GL, Kramer BS, Hayes RB, Prorok PC, Gohagan JK. Prostate biopsy following a positive screen in the Prostate, Lung, Colorectal and Ovarian cancer screening trial. J Urol. 2005;173:746–50. doi: 10.1097/01.ju.0000152697.25708.71. discussion 750–1. [DOI] [PubMed] [Google Scholar]
- 31.Wever EM, Heijnsdijk EA, Draisma G, et al. Treatment of local-regional prostate cancer detected by PSA screening: benefits and harms according to prognostic factors. Br J Cancer. 2013;108:1971–7. doi: 10.1038/bjc.2013.198. [DOI] [PMC free article] [PubMed] [Google Scholar]
- 32.Heijnsdijk EA, der Kinderen A, Wever EM, Draisma G, Roobol MJ, de Koning HJ. Overdetection, overtreatment and costs in prostate-specific antigen screening for prostate cancer. Br J Cancer. 2009;101:1833–8. doi: 10.1038/sj.bjc.6605422. [DOI] [PMC free article] [PubMed] [Google Scholar]
- 33.Cooperberg MR, Lubeck DP, Meng MV, Mehta SS, Carroll PR. The changing face of low-risk prostate cancer: trends in clinical presentation and primary management. J Clin Oncol. 2004;22:2141–9. doi: 10.1200/JCO.2004.10.062. [DOI] [PMC free article] [PubMed] [Google Scholar]
- 34.Dall’era MA, Hosang N, Konety B, Cowan JE, Carroll PR. Sociodemographic predictors of prostate cancer risk category at diagnosis: unique patterns of significant and insignificant disease. J Urol. 2009;181:1622–7. doi: 10.1016/j.juro.2008.11.123. discussion 1627. [DOI] [PubMed] [Google Scholar]
- 35.Daskivich TJ, Chamie K, Kwan L, et al. Overtreatment of men with low-risk prostate cancer and significant comorbidity. Cancer. 2011;117:2058–66. doi: 10.1002/cncr.25751. [DOI] [PubMed] [Google Scholar]
- 36.Miller DC, Gruber SB, Hollenbeck BK, Montie JE, Wei JT. Incidence of initial local therapy among men with lower-risk prostate cancer in the United States. J Natl Cancer Inst. 2006;98:1134–41. doi: 10.1093/jnci/djj308. [DOI] [PubMed] [Google Scholar]
- 37.Shao YH, Albertsen PC, Roberts CB, et al. Risk profiles and treatment patterns among men diagnosed as having prostate cancer and a prostate-specific antigen level below 4. 0 ng/ml. Arch Intern Med. 2010;170:1256–61. doi: 10.1001/archinternmed.2010.221. [DOI] [PMC free article] [PubMed] [Google Scholar]
- 38.Shao YH, Albertsen PC, Shih W, Roberts CB, Lu-Yao GL. The impact of PSA testing frequency on prostate cancer incidence and treatment in older men. Prostate Cancer Prostatic Dis. 2011;14:332–9. doi: 10.1038/pcan.2011.29. [DOI] [PMC free article] [PubMed] [Google Scholar]
- 39.Mishra MV, Shen X, Den RB, et al. Patterns of care for elderly men diagnosed with favorable-risk prostate cancer from 2004 to 2008: a population-based analysis. Am J Clin Oncol. 2013;36:606–11. doi: 10.1097/COC.0b013e318261056c. [DOI] [PubMed] [Google Scholar]
- 40.Kim J, Ebertowski J, Janiga M, et al. Many young men with prostate-specific antigen (PSA) screen-detected prostate cancers may be candidates for active surveillance. BJU Int. 2013;111:934–40. doi: 10.1111/j.1464-410X.2012.11768.x. [DOI] [PMC free article] [PubMed] [Google Scholar] [Retracted]
- 41.Loeb S, Berglund A, Stattin P. Population based study of use and determinants of active surveillance and watchful waiting for low and intermediate risk prostate cancer. J Urol. 2013;190:1742–9. doi: 10.1016/j.juro.2013.05.054. [DOI] [PubMed] [Google Scholar]
- 42.Sengupta S, Davis I, Lim Joon D, Bolton D, Millar J. Are we over-diagnosing and over-treating prostate cancer? BJU Int. 2013;111:98. [Google Scholar]
- 43.Evans SM, Millar JL, Davis ID, et al. Patterns of care for men diagnosed with prostate cancer in Victoria from 2008 to 2011. Med J Aust. 2013;198:540–5. doi: 10.5694/mja12.11241. [DOI] [PubMed] [Google Scholar]
- 44.Corcoran AT, Peele PB, Benoit RM. Cost comparison between watchful waiting with active surveillance and active treatment of clinically localized prostate cancer. Urology. 2010;76:703–7. doi: 10.1016/j.urology.2009.12.071. [DOI] [PubMed] [Google Scholar]
- 45.McGregor M, Hanley JA, Boivin JF, McLean RG. Screening for prostate cancer: estimating the magnitude of overdetection. CMAJ. 1998;159:1368–72. [PMC free article] [PubMed] [Google Scholar]
- 46.Xia J, Trock BJ, Cooperberg MR, et al. Prostate cancer mortality following active surveillance versus immediate radical prostatectomy. Clin Cancer Res. 2012;18:5471–8. doi: 10.1158/1078-0432.CCR-12-1502. [DOI] [PMC free article] [PubMed] [Google Scholar]
- 47.Graif T, Loeb S, Roehl KA, et al. Under diagnosis and over diagnosis of prostate cancer. J Urol. 2007;178:88–92. doi: 10.1016/j.juro.2007.03.017. [DOI] [PubMed] [Google Scholar]
- 48.Noldus J, Graefen M, Haese A, Henke RP, Hammerer P, Huland H. Stage migration in clinically localized prostate cancer. Eur Urol. 2000;38:74–8. doi: 10.1159/000020255. [DOI] [PubMed] [Google Scholar]
- 49.Kilpelainen TP, Auvinen A, Maattanen L, et al. Results of the three rounds of the Finnish Prostate Cancer Screening Trial—the incidence of advanced cancer is decreased by screening. Int J Cancer. 2010;127:1699–705. doi: 10.1002/ijc.25368. [DOI] [PubMed] [Google Scholar]
- 50.Pelzer AE, Colleselli D, Bektic J, et al. Over-diagnosis and under-diagnosis of screen- vs non-screen-detected prostate cancers with in men with prostate-specific antigen levels of 2.0–10. 0 ng/mL. BJU Int. 2008;101:1223–6. doi: 10.1111/j.1464-410X.2007.07367.x. [DOI] [PubMed] [Google Scholar]
- 51.Pelzer AE, Colleselli D, Bektic J, et al. Clinical and pathological features of screen vs non-screen-detected prostate cancers: is there a difference? BJU Int. 2008;102:24–7. doi: 10.1111/j.1464-410X.2008.07566.x. [DOI] [PubMed] [Google Scholar]
- 52.Pelzer AE, Bektic J, Akkad T, et al. Under diagnosis and over diagnosis of prostate cancer in a screening population with serum PSA 2 to 10 ng/ml. J Urol. 2007;178:93–7. doi: 10.1016/j.juro.2007.03.021. discussion 97. [DOI] [PubMed] [Google Scholar]
- 53.Postma R, Schroder FH, van Leenders GJ, et al. Cancer detection and cancer characteristics in the European Randomized Study of Screening for Prostate Cancer (ERSPC)—Section Rotterdam. A comparison of two rounds of screening. Eur Urol. 2007;52:89–97. doi: 10.1016/j.eururo.2007.01.030. [DOI] [PubMed] [Google Scholar]
- 54.Park B, Jeon SS, Ju SH, et al. Detection rate of clinically insignificant prostate cancer increases with repeat prostate biopsies. Asian J Androl. 2013;15:236–40. doi: 10.1038/aja.2012.123. [DOI] [PMC free article] [PubMed] [Google Scholar]
- 55.Resnick MJ, Lee DJ, Magerfleisch L, et al. Repeat prostate biopsy and the incremental risk of clinically insignificant prostate cancer. Urology. 2011;77:548–52. doi: 10.1016/j.urology.2010.08.063. [DOI] [PubMed] [Google Scholar]
- 56.Brausi M, Castagnetti G, Dotti A, De Luca G, Olmi R, Cesinaro AM. Immediate radical prostatectomy in patients with atypical small acinar proliferation. Over treatment? J Urol. 2004;172:906–8. doi: 10.1097/01.ju.0000134622.54235.93. discussion 908–9. [DOI] [PubMed] [Google Scholar]
- 57.Miller DC, Litwin MS, Bergman J, et al. Prostate cancer severity among low income, uninsured men. J Urol. 2009;181:579–83. doi: 10.1016/j.juro.2008.10.010. discussion 583–4. [DOI] [PMC free article] [PubMed] [Google Scholar]
- 58.Sakr WA, Grignon DJ, Crissman JD, et al. High grade prostatic intraepithelial neoplasia (HGPIN) and prostatic adenocarcinoma between the ages of 20–69: an autopsy study of 249 cases. In Vivo. 1994;8:439–43. [PubMed] [Google Scholar]
- 59.Soos G, Tsakiris I, Szanto J, Turzo C, Haas PG, Dezso B. The prevalence of prostate carcinoma and its precursor in Hungary: an autopsy study. Eur Urol. 2005;48:739–44. doi: 10.1016/j.eururo.2005.08.010. [DOI] [PubMed] [Google Scholar]
- 60.Zlotta AR, Egawa S, Pushkar D, et al. Prevalence of prostate cancer on autopsy: cross-sectional study on unscreened Caucasian and Asian men. J Natl Cancer Inst. 2013;105:1050–8. doi: 10.1093/jnci/djt151. [DOI] [PubMed] [Google Scholar]
- 61.Haas GP, Delongchamps NB, Jones RF, et al. Needle biopsies on autopsy prostates: sensitivity of cancer detection based on true prevalence. J Natl Cancer Inst. 2007;99:1484–9. doi: 10.1093/jnci/djm153. [DOI] [PubMed] [Google Scholar]
- 62.Sanchez-Chapado M, Olmedilla G, Cabeza M, Donat E, Ruiz A. Prevalence of prostate cancer and prostatic intraepithelial neoplasia in Caucasian Mediterranean males: an autopsy study. Prostate. 2003;54:238–47. doi: 10.1002/pros.10177. [DOI] [PubMed] [Google Scholar]
- 63.Stamatiou K, Alevizos A, Perimeni D, Sofras F, Agapitos E. Frequency of impalpable prostate adenocarcinoma and precancerous conditions in Greek male population: an autopsy study. Prostate Cancer Prostatic Dis. 2006;9:45–9. doi: 10.1038/sj.pcan.4500847. [DOI] [PubMed] [Google Scholar]
- 64.Chun FK, Haese A, Ahyai SA, et al. Critical assessment of tools to predict clinically insignificant prostate cancer at radical prostatectomy in contemporary men. Cancer. 2008;113:701–9. doi: 10.1002/cncr.23610. [DOI] [PubMed] [Google Scholar]
- 65.Kattan MW, Eastham JA, Wheeler TM, et al. Counseling men with prostate cancer: a nomogram for predicting the presence of small, moderately differentiated, confined tumors. J Urol. 2003;170:1792–7. doi: 10.1097/01.ju.0000091806.70171.41. [DOI] [PubMed] [Google Scholar]
- 66.Loeb S, Metter EJ, Kan D, Roehl KA, Catalona WJ. Prostate-specific antigen velocity (PSAV) risk count improves the specificity of screening for clinically significant prostate cancer. BJU Int. 2012;109:508–13. doi: 10.1111/j.1464-410X.2011.10900.x. discussion 513–4. [DOI] [PMC free article] [PubMed] [Google Scholar]
- 67.Rouse P, Shaw G, Ahmed HU, Freeman A, Allen C, Emberton M. Multi-parametric magnetic resonance imaging to rule-in and rule-out clinically important prostate cancer in men at risk: a cohort study. Urol Int. 2011;87:49–53. doi: 10.1159/000325880. [DOI] [PubMed] [Google Scholar]
- 68.Chang BL, Isaacs SD, Wiley KE, et al. Genome-wide screen for prostate cancer susceptibility genes in men with clinically significant disease. Prostate. 2005;64:356–61. doi: 10.1002/pros.20249. [DOI] [PubMed] [Google Scholar]
- 69.Cooperberg M, Simko J, Falzarano S, et al. Development and validation of the biopsy-based genomic prostate score (GPS) as a predictor of high grade or extracapsular prostate cancer to improve patient selection for active surveillance. Paper presented at: American Urological Association annual meeting; May 4–8, 2013; San Diego, CA. [Google Scholar]