Abstract
Hypoxia-inducible factor 1α (HIF-1α) promotes cell survival after hypoxia-ischemia by regulating its target genes. Desferrioxamine (DFO) has been found to up-regulate HIF-1α expression in ischemia brain injury. However, the signaling pathway to mediate this regulation remains unclear in neonatal hypoxia-ischemia brain damage (HIBD). Since phosphoinositide 3-kinase (PI3K/Akt) pathway and extracellular signal-related protein kinase pathway (Erk1/2 MAPK) have proven to be involved in the regulation of HIF-1α in neonatal rat brain after hypoxia-ischemia (HI), we hypothesized that DFO might regulate HIF-1α by activating PI3K/Akt and Erk1/2 MAPK pathways in developing rat brain after HI. To test this hypothesis, we subjected postnatal day 10 rats to DFO intraperitoneal injection 30 min before HI. Rat brains were collected to detect the expression of HIF-1α and its target gene VEGF, as well as PI3K/Akt and Erk1/2 MAPK using Western blot analysis. We found that the expression of HIF-1α, VEGF, and p-Erk1/2 was significantly upregulated and peaked at 4 h after HI in DFO treated group, with higher level and earlier peak time than control group. However, the expression of p-Akt was unchanged in DFO treated group compared with control group. Our findings suggest that DFO might up-regulate HIF-1α and its target gene VEGF through Erk1/2 MAPK pathway in the developing rat brain after HI.
Keywords: DFO, HIF-1α, phosphoinositide 3-kinase, extracellular signal-related protein kinase, development, brain, hypoxia-ischemia
Introduction
Hypoxia inducible factor 1 (HIF-1) is a heterodimeric DNA binding complex composed of α and β subunit which is the major component of the molecular response to hypoxia [1]. HIF-1α is a transcriptional factor playing a central role in the maintenance of oxygen homeostasis. HIF-1β is constitutively expressed and identical to the aryl hydrocarbon receptor nuclear translocator. Hypoxia results in the stabilization of HIF-1α enabling it, upon dimerization, to bind hypoxia responsive elements (HRE) in target genes [2,3]. Hypoxia-ischemia (HI) from a variety of causes such as stroke and hypoxia-ischemia brain damage (HIBD) results in severe brain injury in neonates [4]. However, the pathophysiological mechanisms and preventive measures are not clear. In our previous study, we found that HIF-1α plays a neuroprotective role by regulating its target genes in rat models with neonatal stroke and hypoxia-ischemia brain injury [5-7]. Therefore, investigation of drugs which up-regulate HIF-1α in the developing brain after HI may be helpful.
Desferrioxamine (DFO), an iron chelator, has been shown to activate HIF-1 in vitro, and increase expression of HIF-1α target genes such as Epo [8]. In vivo studies also showed that DFO can up-regulate HIF-1α expression in normal oxygen and in a rat neonatal stroke model with ischemia-reperfusion [6]. However, the signaling pathway to mediate this regulation remains unclear. In our previous study, we found that PI3K/Akt and Erk1/2 MAPK pathways were involved in the regulation of HIF-1α in developing rat brain after HI [9,10]. Therefore, we hypothesized that DFO might regulate HIF-1α by activating PI3K/Akt and Erk1/2 MAPK pathways in developing rat brain after HI. To test this hypothesis, we generated neonatal hypoxia-ischemia brain injury models using postnatal day 10 rats to compare HIF-1α, VEGF, Akt, p-Akt, Erk1/2 and p-Erk1/2 expression with or without DFO treatment.
Materials and methods
Animal protocols
All animal researches were approved by Sichuan University Committee on Animal Research. Female Sprague-Dawley rats with litters of mixed gender were acquired from the animal center of Sichuan University. The mother was given food and water and housed in a temperature and light controlled facility until the pups were 10 days old. For the HI model, we used a method previously described [5,11]. Briefly, each pup was anesthetized with halothane. With the pup supine, the right common carotid artery (CCA) was exposed and permanently ligated with a 7-0 silk suture through a midline cervical incision. After ligation of the CCA, the pups were returned to the dam for 1 h to recover from anesthesia. Duration of 2.5 h of hypoxia (8% O2/92% N2) was used to produce HI injury. For the DFO treating model and 0.9% NaCl treating model, pups received intraperitoneal injection 30 min before HI treatment. Sham controls received halothane anesthesia and exposure of the CCA without ligation of the CCA and hypoxia.
Western blot analysis
The isolated cortices at different time points as described above were homogenized in ice-cold lysis buffer. Lysates were centrifuged at 14000r for 30 min at 4°C, and the protein concentration was determined by a BCA protein assay kit (Pierce) using bovine serum albumin (BSA) as the standard. Protein samples (100 ug per lane) diluted in SDS-PAGE sample buffer were boiled for 5 min, electrophoresed and separated on an 8% SDS-polyacrylamide gels as described previously [12]. All experiments were repeated at least three times.
Reverse transcriptase-polymerase chain reaction (RT-PCR)
A subset of pups at 4 h, 8 h and 24 h after HI, as well as from sham controls were removed and frozen for RT-PCR analysis [7,9]. HIF-1α primers were designed based on NCBI Genebank (synthesized by Shanghai Genebase Com.): HIF-1α 5’-AAGTCT AGGGATGCAGCAC-3’ (sense) and 5’-CAAGATCA- CCAGCATCTAG-3’ (antisense). β-actin 5’-ACACTGTGCCCATCT AGGAGG-3’ (sense) and 5’-AGGGGCCGG ACTC GTCATACT (antisense). Polymerase Chain Reaction (PCR) was conducted using Taq DNA Polymerase (TaKaRa) in a PCR reaction mixture (50 µl) containing 10 µl cDNA. PCR products were subjected to electrophoresis on a 2% agarose gel using 600 bp ladder DNA markers as a size reference (BioTeke Corporation). DNA was visualized by ethidium bromide staining and gels were photographed under ultraviolet transillumination.
Statistical analysis
Data of relative optical densities of immunoblots are presented as mean ± standard deviation (SD). Statistical differences between sham control and each group were compared using ANOVA with Bonferroni/Dunnett post-hoc tests. Statistical differences at the same time point between DFO-treated group and HI group were compared using paired t tests. A value of p<0.05 was considered statistically significant.
Results
Expression of HIF-1α, VEGF after HI with or without DFO treatment
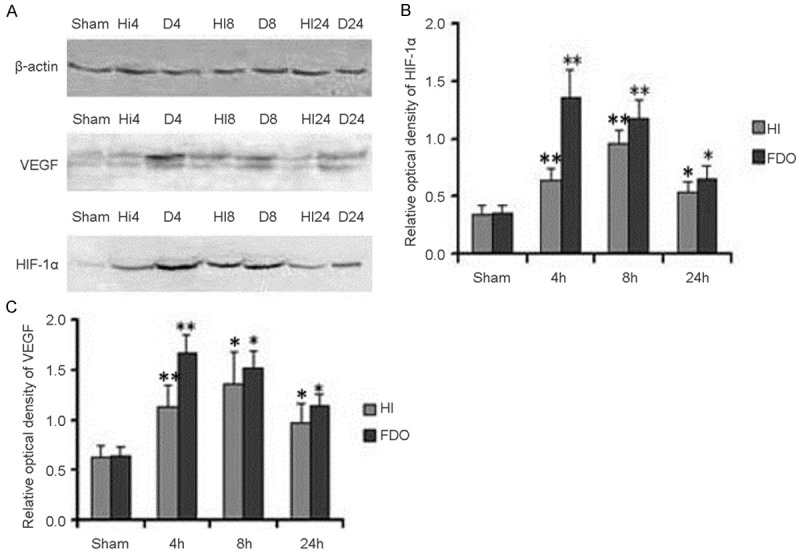
We determined the expression of HIF-1α and VEGF at 4 h, 8 h and 24 h after HI using Western blot analysis. We found that one band of 110 kDa, corresponding to HIF-1α protein, was induced at 4 h, peaked at 8 h, and declined at 24 h after HI without DFO treating (Figure 1A). However, HIF-1α expression was peaked at 4 h, and maintained at a high level at 8 h and 24 h after HI with DFO treated (Figure 1A). After normalization with β-actin expression, we found that there were approximate 4.03-fold and 3.46-fold HIF-1α protein increase at 4 h and 8 h (F=108.02, p<0.01) after using DFO compared with sham controls (Figure 1B). Meanwhile, approximate 1.93-fold and 2.81-fold HIF-1α increase at 4 h and 8 h (F=82.72, p<0.01) were detected after HI without DFO treating compared with sham controls (Figure 1B).
Figure 1.

HIF-1α and VEGF expression in P10 rat brains after HI with or without DFO. Western blot quantitative analysis of HIF-1α and VEGF expression (A). Quantification of HIF-1α and VEGF protein expression in HI group, DFO treating group and sham controls. Data were obtained by densitometry and were normalized using β-actin as the loading control. Values are expressed in relative optical density and represented as mean ± SD. For each column, n=4. *p<0.05, **p<0.01 compared with the sham control (B, C). (HI, hypoxia-ischemia; D, DFO treated group).
To quantify VEGF expression in these two models, Western blot analysis with specific VEGF antibody was used to detect the induction of VEGF with β-actin as an internal control. We found that one band of 42 kDa, corresponding to VEGF protein, was significantly induced at 4 h, peaked at 8 h, and maintained at a high level at 24 h after HI without DFO treating (Figure 1A). However, VEGF expression was peaked at 4 h, and maintained at a high level at 8 h and 24 h after HI with DFO treating (Figure 1A). After normalization with β-actin expression, we found that there were approximate 2.58-fold and 2.37-fold VEGF protein increase at 4 h and 8 h (F=121.36, p<0.01) after HI with DFO treated compared with sham controls (Figure 1C). Meanwhile, approximate 1.77-fold and 2.13-fold VEGF increase were detected at 4 h and 8 h (F=21.88, p<0.01) after HI without DFO treating compared with sham controls (Figure 1C).
Expression of Akt, p-Akt after HI with or without DFO treatment
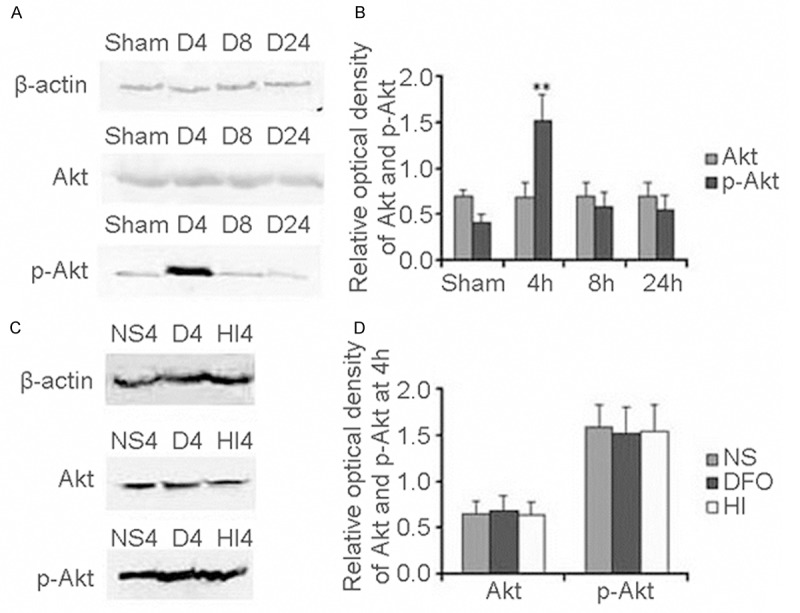
We determined the expression of Akt and p-Akt at 4 h, 8 h and 24 h after HI with or without DFO treating. The expression of Akt and p-Akt was detected using Western blot analysis. We found that Akt expression was not obviously changed (Figure 2A) at any time point after HI with DFO treated compared to the sham controls. The expression pattern was in agreement with our previous findings [9]. However, one band of 60 kDa, corresponding to p-Akt protein was obviously induced, peaked at 4 h and then declined at 8 h and 24 h after HI with DFO-treated compared to the sham controls (Figure 2A). Meanwhile, we quantified Akt and p-Akt expression. We found that the Akt expression was not obviously changed between DFO treated group and sham control at any time point after HI (F=0.09, p>0.05) (Figure 2B). However, the p-Akt was increased 3.69-fold at 4 h in DFO treated group compared with sham control (F=91.45, p<0.01) (Figure 2B).
Figure 2.

PI3K/Akt levels after HI in P10 rat brains. Western blot quantitative analysis of Akt and p-Akt expression in DFO treated group (A). Quantification of Akt and p-Akt protein expression in different times and sham control. Data were obtained by densitometry and were normalized using β-actin as the loading control. Values are expressed in relative optical density and represented as mean ± SD. For each column, n=4. *p<0.05, **p<0.01 compared with the sham control (B). Western blot quantitative analysis Akt and p-Akt expression in different group (HI group, DFO treated group and NS treated group) (C). Quantification of Akt and p-Akt protein expression in different groups (HI group, DFO treated group and NS treated group). Data were obtained by densitometry and were normalized using β-actin as the loading control. Values are expressed in relative optical density and represented as mean ± SD. For each column, n=4. *p<0.05, **p<0.01 compared with the HI group and NS treated group (D). (HI, hypoxia-ischemia; D, DFO treated group; NS, 0.9% NaCl treated group).
Through comparison of Akt and p-Akt expression at 4 h among HI group, DFO treated group and NaCl treated group, we found that the Akt and p-Akt expressed in HI group were as the same as in DFO treated group and NaCl treated group (Figure 2C). Meanwhile, we found that the expression of Akt and p-Akt was not significantly changed among HI group, DFO treated group and NaCl treated group at 4 h after HI (F=0.17, p>0.05; F=0.14, p>0.05) (Figure 2D).
Expression of Erk1/2, p-Erk1/2 after HI with or without DFO-treated
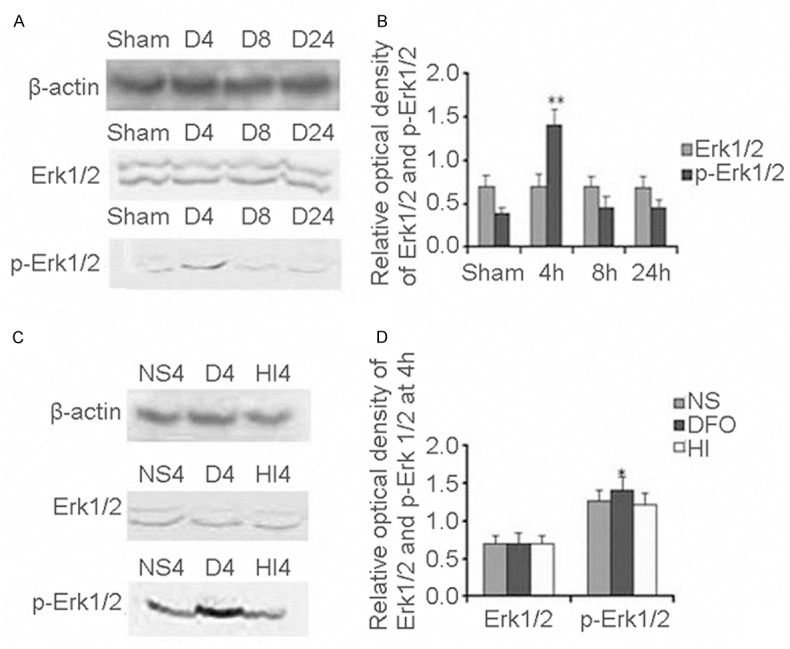
Next we determined the expression of Erk1/2 and p-Erk1/2 at 4 h, 8 h and 24 h after HI with or without DFO treated using Western blot analysis. We found that Erk1/2 expression was not obviously changed (Figure 3A) at any time point after HI with DFO treated compared to the sham controls. The expression pattern was as the same as without DFO-treated [10]. However, we found that one band of 44 kDa corresponding to p-Erk1/2 protein was peaked at 4 h and then declined at 8 h and 24 h after HI with DFO treated compared to the sham controls (Figure 3A). Meanwhile, we quantified Erk1/2 and p-Erk1/2 expression and found that the Erk1/2 expression was not obviously changed between with DFO treated and sham control (F=0.02, p>0.05) (Figure 3B). However, the p-Erk1/2 expression was increased 3.76-fold at 4 h in DFO treated compared with the sham control (F=191.02, p<0.01) (Figure 3B).
Figure 3.

Erk1/2/p-Erk1/2 levels after HI in P10 rat brains. Western blot quantitative analysis Erk1/2 and p-Erk1/2 expression in DFO treated group (A). Quantification of Erk1/2 and p-Erk1/2 protein expression in different times and sham control. Data were obtained by densitometry and were normalized using β-actin as the loading control. Values are expressed in relative optical density and represented as mean ± SD. For each column, n=4. *p<0.05, **p<0.01 compared with the sham control (B). Western blot quantitative analysis Erk1/2 and p-Erk1/2 expression in different group (HI group, DFO treated group and NS treated group) (C). Quantification of Erk1/2 and p-Erk1/2 protein expression in different groups (HI group, DFO treated group and NS treated group). Data were obtained by densitometry and were normalized using β-actin as the loading control. Values are expressed in relative optical density and represented as mean ± SD. For each column, n=4. *p<0.05, **p<0.01 compared with the HI group and NS treated group (D). (HI, hypoxia-ischemia; D, DFO treated group; NS, 0.9% NaCl treated group).
Through comparison of Erk1/2 and p-Erk1/2 expression at 4 h among HI group, DFO treated group and NaCl treated group, we found that Erk1/2 expression in HI group was as the same as in DFO treated group and NaCl treated group (Figure 3C). However, p-Erk1/2 protein was higher in DFO treated group than that in HI group (Figure 3C). We quantified Erk1/2 and p-Erk1/2 expression and found that the Erk1/2 expression was not obviously changed among HI group, DFO treated group and NaCl treated group at 4 h after HI (F=0.06, p>0.05) (Figure 3D). After normalization with β-actin, we found that p-Erk1/2 protein was approximately increased 1.12-fold in the DFO treated group compared with that in the HI group and NaCl treated group (F=5.12, p<0.05) (Figure 3D). There was no significant difference of p-Erk1/2 expression between HI group and NaCl treated group (p>0.05) (Figure 3D).
The effect of DFO on HIF-1α mRNA levels
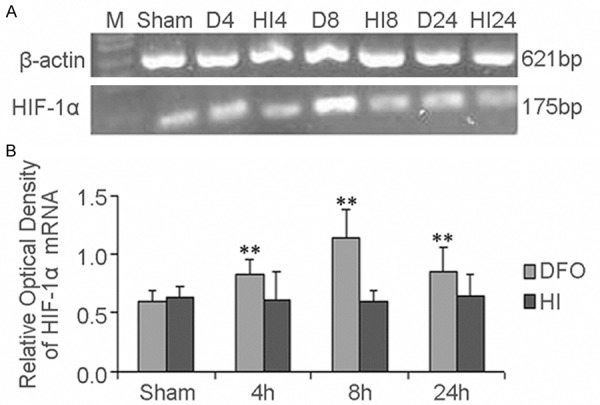
To investigate whether DFO is involved in the regulation of HIF-1α transcription, total RNA was isolated using the same brain from the HI group, DFO treated group, and NaCl treated group (each group n=4). HIF-1α mRNA and the internal control β-actin mRNA were amplified by RT-PCR. In this study, one band of 175 bp, corresponding to the HIF-1α mRNA, and one band of 621 bp, corresponding to β-actin, were detected (Figure 4A). Surprisingly, after normalization with β-actin, we found that HIF-1α mRNA expression was obviously up-regulated after using DFO treated compared to sham control (F=17.93, p<0.01) (Figure 4B). However, it was unchanged when compared HI group and sham control (F=0.132, p>0.05) (Figure 4B). Through comparison of HIF-1α mRNA expression at the same time point between DFO treated group and HI group, we found that HIF-1α mRNA expression in DFO treated group was higher than that in HI group, especially at 4 h and 8 h there were significantly difference (t=2.776, p<0.05 and t=6.964, p<0.01).
Figure 4.

The effect of DFO on HIF-1α mRNA levels after HI in P10 rat brains. RT-PCR was used to detect HIF-1α mRNA expression. Total RNA was isolated from the brains of HI group, DFO treated group. Two bands corresponding to HIF-1α (175 bp) and β-actin (621 bp) were amplified (A). Data were obtained by densitometry and were normalized using β-actin as the loading control. Values are expressed in relative optical density and represented as mean ± SD. For each column, n=4. *p<0.05, **p<0.01 compared with the sham control (B). (HI, hypoxia-ischemia; D, DFO treated group).
Discussion
HIF-1α and its target genes play important roles in cellular repair in many pathologic conditions, including stroke and HI. Therefore, exploring drugs regulating HIF-1α expression becomes interesting and helpful in therapeutic intervention in HIBD. In this study, we showed that DFO up-regulated HIF-1α expression and its targeted gene VEGF in HI rat brain, and this effect might be mediated through Erk1/2 pathway. In addition, we found that DFO not only upregulated the protein level but also the mRNA level of HIF-1α. These observations suggest that DFO might exert its angiogenesis and neural-protective effects by controlling the levels of HIF-1α and its target gene VEGF in developing rat brains after HI.
Our findings are in agreement with previous studies. In the brain, pharmacological activation of HIF by DFO has been found to provoke a prolonged increase in ischemic tolerance in vivo [13,14]. However, the mechanisms how DFO up-regulates HIF-1α are not clarified in developing rat brains after HI. HIF-1α is regulated through different mechanisms including its stabilization, phosphorylation, modifications of redox conditions, and interactions with co-activators such as p300/CREB-binding protein (CBP). In this study, we found that HIF-1α protein peaked at 4 h after HI through DFO treatment, earlier than the peak time of HIF-1α mRNA expression, suggesting that DFO regulates HIF-1α activity through mechanisms other than regulating gene transcription in early time after HI. In addition, we also found that p-Erk1/2 protein peaked at the same time as HIF-1α and VEGF protein peaked. It is known that HIF-1 is a phosphorylated protein and its phosphorylation is involved in HIF-1α subunit stabilization [15]. The phosphorylation of HIF-1α is proven to be dependent on Erk1/2 MAPK [16-18]. Moreover, in the previous study, we observed that hypoxia promote the nuclear accumulation of HIF-1α protein and induce a higher molecular weight HIF-1α protein band in the cytosol. This induction was blocked by U0126 (a MAP kinase inhibitor) [10]. These results suggest that the phosphorylation of HIF-1α by the MAP kinase (Erk1/2) is a prerequisite step for nuclear translocation of HIF-1α and necessary for its stabilization [19]. Therefore, collectively these results suggest that DFO might upregulate HIF-1α through Erk1/2 MAPK mediated stabilization of HIF-1α in early time after HI. To clarify the mechanism of the neural-protective role of DFO will help us to use it more effectively in the treatment of HIBD.
Conclusion
DFO up-regulates HIF-1α expression and its targeted gene VEGF expression in neonatal rat brain after HI treatment, partly through Erk1/2 MAPK pathway. DFO might exert neural-protective and angiogenesis effects through regulating the levels of HIF-1α and its target gene VEGF in developing rat brains after HI.
Acknowledgements
This work was supported by the National Science Foundation of China (No. 81250038 to Lihua Li), Financial Grant from the China Postdoctoral Science Foundation (No. 20100481515 to Lihua Li), Special Financial Grant from the China Postdoctoral Science Foundation (No. 2012T50890 to Lihua Li).
References
- 1.Semenza GL. Regulation of mammalian O2 homeostasis by hypoxia-inducible factor 1. Annu Rev Cell Dev Biol. 1999;15:551–578. doi: 10.1146/annurev.cellbio.15.1.551. [DOI] [PubMed] [Google Scholar]
- 2.Semenza GL. Surviving ischemia: adaptive responses mediated by hypoxia-inducible factor 1. J Clin Invest. 2000;106:809–812. doi: 10.1172/JCI11223. [DOI] [PMC free article] [PubMed] [Google Scholar]
- 3.Semenza GL. Expression of hypoxia-inducible factor 1: mechanisms and consequences. Biochem Pharmacol. 2000;59:47–53. doi: 10.1016/s0006-2952(99)00292-0. [DOI] [PubMed] [Google Scholar]
- 4.Ferriero DM. Neonatal brain injury. N Engl J Med. 2004;351:1985–1995. doi: 10.1056/NEJMra041996. [DOI] [PubMed] [Google Scholar]
- 5.Li LH, Qu Y, Zhang L, Li XH, Li JH, Mao M, Jin XD, Mu DZ. Influence of hypoxia-inducible factor 1-alpha on neuronal apoptosis in a rat model of hypoxia- or hypoxia-ischemia-induced brain injury. Neur Rege Res. 2009;4:1019–1023. [Google Scholar]
- 6.Mu D, Chang YS, Vexler ZS, Ferriero DM. Hypoxia-inducible factor 1alpha and erythropoietin upregulation with deferoxamine salvage after neonatal stroke. Exp Neurol. 2005;195:407–415. doi: 10.1016/j.expneurol.2005.06.001. [DOI] [PubMed] [Google Scholar]
- 7.Mu D, Jiang X, Sheldon RA, Fox CK, Hamrick SE, Vexler ZS, Ferriero DM. Regulation of hypoxia-inducible factor 1alpha and induction of vascular endothelial growth factor in a rat neonatal stroke model. Neurobiol Dis. 2003;14:524–534. doi: 10.1016/j.nbd.2003.08.020. [DOI] [PubMed] [Google Scholar]
- 8.Wang GL, Semenza GL. Desferrioxamine induces erythropoietin gene expression and hypoxia-inducible factor 1 DNA-binding activity: implications for models of hypoxia signal transduction. Blood. 1993;82:3610–3615. [PubMed] [Google Scholar]
- 9.Li L, Qu Y, Mao M, Xiong Y, Mu D. The involvement of phosphoinositid 3-kinase/Akt pathway in the activation of hypoxia-inducible factor-1alpha in the developing rat brain after hypoxia-ischemia. Brain Res. 2008;1197:152–158. doi: 10.1016/j.brainres.2007.12.059. [DOI] [PubMed] [Google Scholar]
- 10.Li L, Xiong Y, Qu Y, Mao M, Mu W, Wang H, Mu D. The requirement of extracellular signal-related protein kinase pathway in the activation of hypoxia inducible factor 1 alpha in the developing rat brain after hypoxia-ischemia. Acta Neuro. 2008;115:297–303. doi: 10.1007/s00401-008-0339-5. [DOI] [PubMed] [Google Scholar]
- 11.Ferriero DM, Arcavi LJ, Sagar SM, McIntosh TK, Simon RP. Selective sparing of NADPH-diaphorase neurons in neonatal hypoxia-ischemia. Ann Neurol. 1988;24:670–676. doi: 10.1002/ana.410240512. [DOI] [PubMed] [Google Scholar]
- 12.Jiang X, Mu D, Sheldon RA, Glidden DV, Ferriero DM. Neonatal hypoxia-ischemia differentially upregulates MAGUKs and associated proteins in PSD-93-deficient mouse brain. Stroke. 2003;34:2958–2963. doi: 10.1161/01.STR.0000102560.78524.9D. [DOI] [PubMed] [Google Scholar]
- 13.Prass K, Ruscher K, Karsch M, Isaev N, Megow D, Priller J, Scharff A, Dirnagl U, Meisel A. Desferrioxamine induces delayed tolerance against cerebral ischemia in vivo and in vitro. J Cereb Blood Flow Metab. 2002;22:520–525. doi: 10.1097/00004647-200205000-00003. [DOI] [PubMed] [Google Scholar]
- 14.Siddiq A, Ayoub IA, Chavez JC, Aminova L, Shah S, LaManna JC, Patton SM, Connor JR, Cherny RA, Volitakis I, Bush AI, Langsetmo I, Seeley T, Gunzler V, Ratan RR. Hypoxia-inducible factor prolyl 4-hydroxylase inhibition. A target for neuroprotection in the central nervous system. J Biol Chem. 2005;280:41732–41743. doi: 10.1074/jbc.M504963200. [DOI] [PMC free article] [PubMed] [Google Scholar]
- 15.Shin HJ, Choi MS, Ryoo NH, Nam KY, Park GY, Bae JH, Suh SI, Baek WK, Park JW, Jang BC. Manganese-mediated up-regulation of HIF-1alpha protein in Hep2 human laryngeal epithelial cells via activation of the family of MAPKs. Toxicol In Vitro. 2010;24:1208–1214. doi: 10.1016/j.tiv.2010.02.008. [DOI] [PubMed] [Google Scholar]
- 16.Berra E, Roux D, Richard DE, Pouyssegur J. Hypoxia-inducible factor-1 alpha (HIF-1 alpha) escapes O(2)-driven proteasomal degradation irrespective of its subcellular localization: nucleus or cytoplasm. EMBO Rep. 2001;2:615–620. doi: 10.1093/embo-reports/kve130. [DOI] [PMC free article] [PubMed] [Google Scholar]
- 17.Berra E, Milanini J, Richard DE, Le Gall M, Vinals F, Gothie E, Roux D, Pages G, Pouyssegur J. Signaling angiogenesis via p42/p44 MAP kinase and hypoxia. Biochem Pharmacol. 2000;60:1171–1178. doi: 10.1016/s0006-2952(00)00423-8. [DOI] [PubMed] [Google Scholar]
- 18.Semenza GL. HIF-1 and mechanisms of hypoxia sensing. Curr Opin Cell Biol. 2001;13:167–171. doi: 10.1016/s0955-0674(00)00194-0. [DOI] [PubMed] [Google Scholar]
- 19.Liu XH, Kirschenbaum A, Lu M, Yao S, Dosoretz A, Holland JF, Levine AC. Prostaglandin E2 induces hypoxia-inducible factor-1alpha stabilization and nuclear localization in a human prostate cancer cell line. J Biol Chem. 2002;277:50081–50086. doi: 10.1074/jbc.M201095200. [DOI] [PubMed] [Google Scholar]


