

Abstract
This paper highlights methods for using geospatial analysis to assess, enhance, and improve recruitment efforts to ensure representativeness in study populations. We apply these methods to the Measurement to Understand Reclassification of Disease of Cabarrus/Kannapolis (MURDOCK) study, a longitudinal population health study focused on the city of Kannapolis and Cabarrus County, NC. Although efforts have been made to recruit a participant registry that is representative of the 18 ZIP code catchment region inclusive of Cabarrus County and Kannapolis, bias in such recruitment is inevitable. Participants in the MURDOCK study are geospatially referenced at entry, providing information that can be used to monitor and guide recruitment efforts. MURDOCK participant population representativeness was assessed using chi-squared tests to compare the MURDOCK population with 2010 Census data, relative to both the entire 18 ZIP code catchment area and for individual Census tracts. A logistic regression model was fit to characterize Census tracts with low recruitment, defined by fewer than 56 participants from that tract. The distance to the site at which participants enrolled was calculated, and median distance to enrollment site was used in the logistic regression. Tracts with low recruitment rates contained higher minority and younger populations, suggesting specific strategies for improving recruitment in these areas. Areal units farther away from enrollment sites were also not well-sampled, despite being in the specified study area, indicating that distance traveled to enrollment may be a barrier. These results have implications for targeting recruitment efforts and representative samples more generally, including in other population-based studies.
Keywords: Geographic health information systems (GHIS), spatial analysis, sample recruitment, neighborhood, population-based studies
Introduction
While traditional cohort and case control studies are useful for examining medical and public health risks for specific groups, population-based studies allow us to measure the health of a generalized population. This approach enables population-wide interventions that are effective given the distinct values and needs of the community. In perhaps the most well-known example, the Framingham Heart Study was established to track the population of Framingham, Massachusetts longitudinally in order to learn about the cardiovascular health of the community, and then generalize those findings to the population at large [1]. More recently, in Camden, New Jersey, the Camden Coalition of Healthcare Providers constructed a city-wide database that is leveraged to help tailor interventions meant to address the specific needs of the population and drive down health care costs [2].
Representative sampling, a key goal of many studies, allows inferences to be generalized to a larger population. Representative sampling is key to large population-based studies because it allows conclusions to be drawn without the time and effort needed to sample every member of the population. In reality, a truly representative sample is difficult to achieve in population-based studies due to inherent biases in the sociodemographic groups that typically agree to be included in these types of studies.
Traditionally, representativeness analysis has focused on obtaining sample demographic characteristics that reflect those of the population. Representativeness may be defined by underlying demographics, as well as by social and environmental exposures -all of which commonly exhibit patterning across geographic areas. Geographic health information systems (GHIS) [3] and spatial analysis can be used to leverage spatial patterning to achieve representativeness. These tools can help assess representativeness across environmental, demographic, and social variables [4-8], as well as aid in the development of specific, targeted recruitment strategies. Geospatial patterning and representativeness of participants can be assessed by linking participant data with demographic and socioeconomic data from the U.S. Census and other sources. Spatial analyses of study recruitment penetration can provide insight regarding the effectiveness of recruitment strategies across geography and key demographic characteristics and elucidate new approaches for achieving population representativeness. In addition, relationships among study participant characteristics and population level outcomes may be mediated by geospatial location; so ensuring geographic representativeness in population-based studies, which is straightforward to assess with GHIS, is critical to the development of robust population-based datasets.
Representativeness is of particular interest in the Measurement to Understand Reclassification of Disease of Cabarrus/Kannapolis (MURDOCK) Study, a multi-tiered, longitudinal, prospective study for classifying chronic diseases using advanced biomarker discovery and electronic health records from adults living in 18 pre-specified ZIP codes in the area of Cabarrus County and the City of Kannapolis, North Carolina. This study aims to recruit 50,000 adult residents. Recruitment began in February 2009, and over 10,000 adult volunteers were enrolled as of December 2013. Early and ongoing assessment of the demographic and geographic representativeness of participants relative to the general population of the study area is a key component of the study’s targeted recruitment strategy, which will evolve to address issues of over- and under-sampling throughout the course of the study.
This paper highlights methods for using geospatial analysis to assess and revise recruitment efforts in an effort to achieve both demographic and spatial representativeness in the study. The methods applied in this study are useful for guiding recruitment efforts and participant selection for the MURDOCK study, and can be extended to other community-based cohort studies focused on characterizing the burden of disease among populations.
Materials and methods
The MURDOCK Study was designed with the goal of reclassifying health and chronic diseases using clinically well-annotated biospecimens, electronic health records, patient-reported outcomes, and epidemiologic methods [9]. A comprehensive overview of the goals and objectives of the MURDOCK Study [9] and detailed methods of the MURDOCK Study Community Registry and Biorepository have been published previously [10]. Briefly, the MURDOCK Study Community Registry and Biorepository is a longitudinaldisease-tracking registry enrolling individuals who are 18 years of age or older. Although initial recruitment efforts focused on participants residing within Cabarrus County or the city of Kannapolis, this was subsequently expanded to individuals living within a specified geographic area defined by 18 ZIP codes that are at least partially contained within Cabarrus County. Participants are enrolled after providing informed consent for: a baseline health questionnaire, limited physical exam, patient reported outcomes, and biological samples; yearly follow up by health questionnaire; access to their health information from medical records and other sources; and re-contact up to four times per year for additional studies [10]. Open enrollment of participants,in which participants self-select into the study, is the primary method of enrollment for this study. This method is facilitated by advertising in print and on radio and television, use of social media, participation by MURDOCK staff in local community health events, targeted mass enrollments at community locations such as churches and schools, and referrals through local healthcare providers. Mass enrollments, in which a community group is identified and MURDOCK Study staff are present onsite to enroll participants, have served an integral role in increasing enrollment. With the exception of mass enrollment efforts, MURDOCK Study participants are enrolled at one of 29 designated sites located throughout the catchment area.
The MURDOCK Study and all associated analyses are conducted according to a research protocol approved by Institutional Review Boards 9.38at Duke University Medical Center and Carolinas Health Care System.
Geospatial analysis
As part of the MURDOCK Study Community Registry and Biorepository, all participants provide their physical address. The address is used to spatially locate the study participant, through a process referred to as geocoding. The geocoding process convertstextual address information into specific latitude and longitude coordinates for each address, and can be performed at various levels of precision, from the individual household level to ZIP code or county level. For the MURDOCK Study, participantresidential addresses at the time of enrollment are geocoded to the street level using ArcGIS 10.1 software (Esri, Redlands, CA). Street level geocoding places an address along a street block, with a side offset of 20 feet from the even or odd side of the street, based on the street name, direction, address, and address range recorded in a reference dataset. The geocoding process allows us to connect each participant with disparate datasets based on common geography. For this analysis, we linked participants to tract level data from the 2010 U.S. Census, including demographic characteristics such as race, ethnicity, age, and sex.
As of March 28, 2013, 9,179 individuals had enrolled in the MURDOCK Study Community Registry and Biorepository. We achieved a geocoding success rate of 84%, or 7,721 participants. Participant addresses that we were unable to geocode often contained P.O Boxes or incomplete information (n = 35). In addition, some addresses could not be located in the street reference layer (n = 1,423). This geocoding rate of 84% is below what we have been able to obtain in multiple other counties in North Carolina [11]. We attribute the lower geocoding rate to poor reference and address data, both of which we are working to improve as the study moves forward. We also excluded 23 participants who were under age 18 who were enrolled in a secondary study of acne and 423 participants from targeted recruitment in multiple sclerosis and centenarian ancillary studies whose recorded address was outside the 18 ZIP code study area. After these exclusions, 7,275 participants were included in the current analyses.
In addition to linking participants with Census data, geocoded addresses were used to calculate the distance to the enrollment site at which a given participant completed enrollment activities. Participants could enroll at one of 29 enrollment sites of their choosing (note that the number of actively enrolling sites has fluctuated over time); however, 6 sites were in the same physical location (a large medical office complex) and were consolidated for the purposes of this study. Participants who enrolled during a mass enrollment at a temporary site were also excluded because the physical locations of those enrollments are not recorded. The geographic distribution of these sites within the specified 18 ZIP code enrollment region is shown in Figure 1. Euclidean distances from participant address to participant-specific enrollment site were calculated using ArcGIS 10.1 software (Esri, Redlands, CA).
Figure 1.

Study area population and MURDOCK participants. The left-hand panel shows Census tract population from the 2010 Census for the 18 ZIP code catchment area. This panel shows areas that are heavily and sparsely populated, along with MURDOCK enrollment sites. The right-hand panel shows the count of MURDOCK participants in each Census tract. This figure shows that most MURDOCK participants are recruited from inside Cabarrus County.
Statistical analyses
We used Census tracts as the areal unit of analysis. The Census uses nested geographies to create spatial boundaries within counties. Census tracts are the largest sub-county areal unit, followed by block groups and then blocks. Although ZIP codes are a familiar areal unit, they do not conform to county boundaries and are not nested like the other divisions. We choose Census tract as the unit of analysis in order to be sufficiently powered within each areal unit. Descriptive statistics (medians with 25th and 75th percentiles for continuous variables and counts and percentages for discrete variables) were computed. Age was summarized using standard Census categories (18-21, 22-29, 30-39, 40-49, 50-64, > 65 years). Race/ethnicity, age, and sex were compared against 2010 U.S. Census data for both the entire study population, and at the Census tract level using chi-square tests. Pearson residuals were used to identify cell counts of demographic groups (e.g. number non-Hispanic black) that significantly differed from their expected value, and to assess variation of tract level representativeness. We used Cochran-Mantel-Haenszel tests to assess heterogeneity of demographic representativeness at the tract level.
Areas that are positively or negatively associated with their neighbors are said to have spatial dependence, or spatial autocorrelation. When observations are spatially dependent, traditional regression assumptions are violated and subsequent model inference may be misleading. Spatial dependency among observations can be accounted for by including variables that capture their spatial structure or through modeling. We measured the spatial autocorrelation of demographic characteristics and enrollment patterns using Moran’s I, a ratio of the product of the variable and its spatial lag with the cross-product of the variable adjusted for the spatial weights - a matrix representation of spatial neighbors [12]. For this analysis, neighbors were defined by contiguity including either a shared boundary line segment or vertex. Unobserved influences may contribute to spatially dependent enrollment patterns.
Tract-level spatial enrollment patterns were investigated using a logistic regression model to identify characteristics of tracts with fewer than 56 participants. We used tract demographic features and enrollment distance as explanatory variables. Variable selection was performed among tract percent age categories, tract percent male, tract percent minority, tract population density, and the tract mean distance travelled to enrollment using manual backwards selection to minimize the Akaike information criterion (AIC), a measure of relative model fit. Variable multicollinearity, the correlation of model predictor variables, was assessed using variance inflation factor (VIF). The VIF represents the multiplicative difference of the variance of the variable relative to it being uncorrelated with other model predictors. We used the standard cutoff of 5 for retaining variables in the model. Residuals from the logistic regression model were assessed for spatial autocorrelation using Moran’s I. All statistical analyses were performedusing R 3.0.2 (R Foundation for Statistical Computing, Vienna, Austria).
Results
Demographics of study population and aspatial analysis
Table 1 shows sociodemographic summaries of the MURDOCK sample and population area Census reference data. Over half of the MURDOCK sample was above 50 years of age (56.5%) and the sample was predominantly female (65.6%) and non-Hispanic white (75.6%). In contrast, in the 2010 Census, 34.4% of people in the study area were above 50 years, 51.3% were female, and 58.3% were non-Hispanic white. People in committed relationships represented 67% of the population, and 36.3% of the sample had some college or an associate’s degree. Chi-square tests and Pearson residuals confirm that non-Hispanic blacks, Asians, Hispanics, and persons under the age of 50 are statistically significantly under-sampled in the MURDOCK cohort. Interestingly, in Cabarrus County, rather than the 18 ZIP code area, non-Hispanic whites constitute 72% of the population. By including the areas outside of Cabarrus County that are still within the 18 ZIP code study area, this number drops to 58.3%, highlighting the usefulness of geographically-based analysis to assess study representativeness and plan for adjustments to recruitment strategies.
Table 1.
Demographics of MURDOCK study participants and the study area population
| MURDOCK (N = 7275) | Census (104 Census tracts) | ||||
|---|---|---|---|---|---|
|
|
|||||
| Variable | Levels | n | % | n | % |
| Age | 18-21 | 305 | 4.19 | 27,810 | 5.89 |
| 22-29 | 451 | 6.2 | 54,456 | 11.53 | |
| 30-39 | 960 | 13.2 | 74,020 | 15.67 | |
| 40-49 | 1452 | 19.96 | 74,136 | 15.06 | |
| 50-64 | 2385 | 32.78 | 75,938 | 16.07 | |
| 65+ | 1722 | 23.67 | 43,265 | 9.16 | |
| Sex | Female | 4771 | 65.58 | 242,405 | 51.31 |
| Male | 2504 | 34.42 | 229,995 | 48.69 | |
| Race/ethnicity | Non-Hispanic white | 5497 | 75.56 | 275,256 | 58.27 |
| Non-Hispanic black | 891 | 12.25 | 118,482 | 25.08 | |
| Non-Hispanic Asian | 44 | 0.6 | 16,601 | 3.51 | |
| Non-Hispanic other | 190 | 2.61 | 10,808 | 2.29 | |
| Hispanic | 653 | 8.98 | 51,253 | 10.85 | |
| Relationship status | Committed | 4878 | 67.05 | - | - |
| Not committed | 2380 | 32.71 | - | - | |
| Missing | 17 | 0.23 | - | - | |
| Educational attainment | Less than high school | 613 | 8.43 | 39757 | 13.92 |
| High school or GED | 1628 | 22.38 | 71468 | 25.02 | |
| Some college or associate鈥檚 degree | 2640 | 36.29 | 88467 | 30.97 | |
| Bachelor鈥檚 degree | 1476 | 20.29 | 60244 | 21.09 | |
| Master鈥檚 or higher professional degree | 907 | 12.47 | 25741 | 9.01 | |
| Missing | 11 | 0.15 | - | - | |
Spatial enrollment
The spatial distribution of MURDOCK participants compared with the population density of the study area is shown in Figure 1. There are 10 eligible ZIP codes that lie mostly within Cabarrus County, and 8 eligible ZIP codes that lie mostly outside the county. According to the 2010 U.S. Census, there were more people residing in the 8 ZIP code region outside the county (284,255; 61%) than in the county itself (178,014; 39%), due in part to the proximal locations of those ZIP codes to Charlotte, NC, the largest city in North Carolina. Due to an initial focus of the MURDOCK Study on recruitment inside the Cabarrus County boundaries and the city of Kannapolis, most MURDOCK participants reside within the Cabarrus County limits (6,420 participants, 88%). Future recruitment efforts will more explicitly address this imbalance highlighted by the geospatial analysis.
Tract-level enrollment
The number of participants recruited per tract ranged from 0 to 383, with a mean of 70.0 (SD = 94.2) and median of 17 (Q1 = 5.8, Q3 = 109.8), and the percent of adults enrolled per tract ranged from 0.00% to 6.94%, with a mean of 1.55% (SD = 1.92) and median of 0.35% (Q1 = 0.15%, Q3 = 2.77), highlighting the low sample size among many tracts. Of the 104 Census tracts, one tract recruited no participants and was excluded from following tract level analyses. There is evidence of positive spatial autocorrelation in the distribution of the number of participants in each Census tract (Moran’s I = 0.63, p< 0.0001). In other words, the number of the people sampled in a tract is similar to that of its neighbors. This positive autocorrelation persists when we look at the percent of the tract adults enrolled in the MURDOCK study (Moran’s I = 0.8, p< 0.0001). This result indicates a clear spatial pattern to the recruitment of MURDOCK participants at the tract level, after accounting for difference in tract population size. Spatial correlation among the number and percent of adults enrolled indicate an underlying spatial structure mediating tract level enrollment, which may be due in part to correlation in distance to enrollment sites (see analysis below).
Tracts with few participants cannot be assessed for representativeness, due to low cell counts (see Cochran (1954) for recommendations about minimum expectations) [13]. Census tracts are designed to have roughly the same population. However, in the study area, Census tracts range from 1,248 to 11,911 persons with a mean population of 4,542 and a standard deviation of 1,778.
We know from the analysis above that overall, the enrolled participants are not representative of the underlying population. To further explore this issue, we focus on those Census tracts that have more robust enrollment to see if enrollees from those Census tracts are more representative of the underlying population as compared to all participants in the entire study area.
In examining the number of enrolled participants in each tract, we found a significant number of Census tracts with low enrollment. We excluded low enrollment tracts from analysis of Census demographics that we next report. Using natural break analysis,we found a break in the data at 31 enrollees per Census tract, with no tracts containing 32-55 enrollees. Thus we conduct our demographic analysis comparison of tracts on only those tracts that contain at least 56 enrollees, leaving 43 tracts for analysis.While we excluded the tracts with low enrollment here, it is important to note that the low enrollment tracts tend to be higher minority (χ2 = 33.316, df = 4, p< 0.0001) and lower income areas. We explore this more in the logistic regression analysis below.
We used chi-square tests and Pearson residuals to assess demographic representativeness of the 43 higher-enrollment tracts (see Table 2). The study sample for the subset of tracts remained significantly different from the Census on race/ethnicity (χ2 = 135.5, df = 4, p< 0.0001), age (χ2 = 932.1, df = 5, p< 0.0001), and sex (χ2 = 518.09, df = 1, p< 0.0001). However the chi-square statistics for these analyses were smaller than for the overall study area, indicating that the Census and study demographic characteristics were more similar among tracts with at least 56 adults enrolled. Examination of the Pearson residuals shows that minority groups, participants under 50 years of age, and men were under sampled.
Table 2.
Demographics of MURDOCK study participants and the study area population, restricted to tracts with ≥ 56 participants
| MURDOCK | Census | ||||
|---|---|---|---|---|---|
|
|
|
||||
| Demographic characteristic | Levels | n | % | n | % |
| Age | 18-21 | 264 | 3.94 | 10090 | 5.01 |
| 22-29 | 401 | 5.98 | 18326 | 9.09 | |
| 30-39 | 882 | 13.15 | 29013 | 14.40 | |
| 40-49 | 1319 | 19.67 | 31182 | 15.47 | |
| 50-64 | 2206 | 32.89 | 35248 | 17.49 | |
| 65+ | 1635 | 24.38 | 23677 | 11.75 | |
| Sex | Female | 4379 | 65.29 | 103116 | 51.16 |
| Male | 2328 | 34.71 | 98425 | 48.84 | |
| Race/ethnicity | Non-Hispanic white | 5180 | 77.23 | 146617 | 72.75 |
| Non-Hispanic black | 736 | 10.97 | 28344 | 14.06 | |
| Non-Hispanic Asian | 37 | 0.55 | 3712 | 1.84 | |
| Non-Hispanic other | 169 | 2.52 | 3956 | 1.96 | |
| Hispanic | 585 | 8.72 | 18912 | 9.38 | |
Since we found that minority groups, younger populations and men are under sampled, we calculated Cochran-Mantel-Haenszel tests to determine if these groups were similarly under sampled in across the 43 high-enrollment tracts. Results showed representativeness was heterogeneous among the 43 higher-enrollment tracts for race (χ2 MH = 155.17, df = 4, p< 0.0001), age (χ2 MH = 809.62, df = 5, p< 0.0001), and sex (χ2 MH = 500.41, df = 1, p< 0.0001). Despite the overall undersampling of minority and younger demographics, some tracts were more representative than others.
Because tract-level representativeness was found to be heterogeneous, we drilled down to assess the 43 tracts individually. We calculated chi-square tests for each of the higher-enrollment tracts. As the 43 tracts are contiguous, with all 37 of the Cabarrus County tracts included, we assessed the spatial distribution of chi-square statistics for race, age, and sex for spatial autocorrelation using Moran’s I. Each was found to be spatially independent at the 0.05 significance level. These results indicate that demographic differences between the sample and population area, for tracts with at least 56 participants, appear spatially random.
Distance to enrollment
Euclidean distance to enrollment site was aggregated at the tract level to assess the spatial distribution of mean distance to recruitment site by tract. Moran’s I was used to assess autocorrelation in tract mean distance. We expect positive spatial autocorrelation among the mean distance, since the enrollment sites are not randomly placed throughout the study area. Results demonstrated evidence of moderate positive spatial autocorrelation (I = 0.36, p< 0.0001), indicating neighboring tracts were similar in terms of mean distance to enrollment site. Although these results are not surprising, they demonstrate spatial structure inherent in the data. The differences in distances were consistent with the spatial distribution of enrollment sites. Mean distance to enrollment site is shown in Figure 2.
Figure 2.
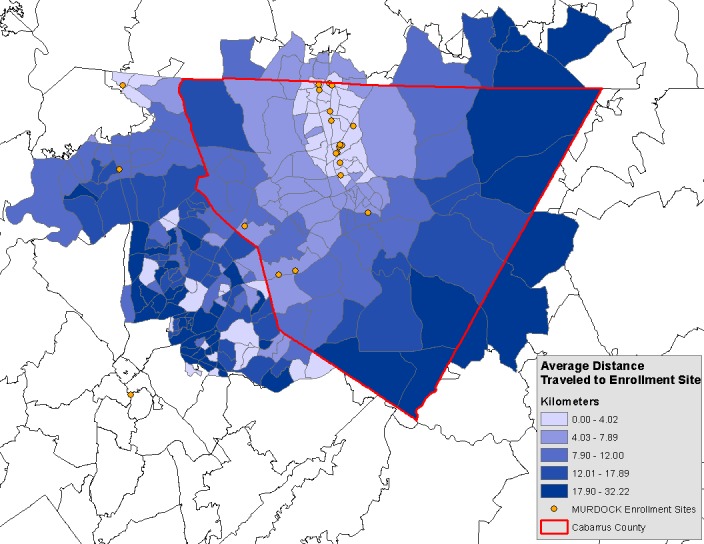
Average distance traveled to enrollment site. This figure shows the average distance travelled to enroll by MURDOCK participants. In general MURDOCK participants traveled shorter distances when more enrollment sites were available, indicating thatdistance to enrollment site is a barrier to enrollment.
Identifying characteristics of low sampled tracts
In order to better understand differences between tracts with< 56 adults enrolled and tracts with ≥ 56 participants, we fit a logistic regression model to assess population tract-level features that may characterize poorly sampled tracts. Earlier results indicated oversampling non-Hispanic whites; therefore, we combined all other race and ethnicity categories as the percent minority population for each tract.
As shown in Table 3, tracts with< 56 enrolled participants had fewer people ≥ 65 years old (p = 0.0013) and more minorities (p = 0.0114), at the population level. Tracts with< 56 participants enrolled also had greater mean distances to enrollment site (p = 0.0004). Tract percent 22-29 years old (p = 0.10), percent 30-39 years old (p = 0.65), percent 50-64 years old (p = 0.05), and population density (p = 0.33) were not significantly different. Multicollinearity of the model terms was assessed by variance inflation factors (VIF). Moran’s I of the residuals was 0.28 (p = 0.12), suggesting the spatial distribution of tract enrollment can be at least partially explained by the model terms.
Table 3.
Results of logistic regression modeling of the probability of a tract having < 56 participants
| Variable | Estimate | Std. Err. | VIF |
|---|---|---|---|
| Intercept | -2.253 | 3.831 | - |
| % Age 22-29 | 0.210 | 0.129 | 1.96 |
| % Age 30-39 | 0.47 | 0.103 | 1.15 |
| % Age 50-64 | 0.290* | 0.150 | 3.06 |
| % Age 65+ | -0.571*** | -0.177 | 2.48 |
| % Minority | 0.001** | -0.000 | 2.75 |
| Population density | 1,105.96 | -1,145.428 | 1.95 |
| Mean distance (miles) | 2.678*** | 0.749 | 2.95 |
| Observations | 103 | ||
| Log Likelihood | -25.25 | ||
| Akaike Inf. Crit. | 66.52 |
p < 0.1;
p < 0.05;
p < 0.01.
Discussion
Geospatial location may capture information about unobserved influences on sociodemographic characteristics of target populations. Leveraging GHIS technology and spatial analysis can extend traditional methods for assessing study recruitment efforts and sample representativeness by providing an additional layer of information on which to base targeted recruitment efforts. In our application of these methods to the MURDOCK Study Community Registry and Biorepository, we found strong evidencethat the enrolled participants are not representative of the eligible population, with under-recruiting occurring in tracts with younger and more racially diverse populations.
Geospatial representativeness in the MURDOCK study
Examining the geospatial distribution of demographic characteristics across Census tracts revealed a clear spatial pattern to the recruitment of MURDOCK participants. In particular, the number of participants per tract was found to have high spatial autocorrelation. We fit a logistic regression model to identify population-level characteristics that were associated with the spatial dependency of tracts with few participants. Many tracts in the 18 ZIP code area had very low numbers of MURDOCK enrollees, with 58.7% of tracts having fewer than 56 participants. In addition, tracts that did have high recruitment numbers (≥ 56 participants), were found to be more demographically homogenous than tracts that were not well sampled. This result indicates that having a well sampled geographic area is an important consideration in obtaining true representativeness. The percent of tract residents ≥ 65 years of age, percent of tract residents who were minorities, and the mean distance travelled to enrollment site by tract participants were negatively associated with recruitment.
GHIS provide useful information to guide future targeted recruitment efforts in the MURDOCK Study Community Registry and Biorepository, and similar population-based studies. For example, under-recruiting in non-Hispanic black and Hispanic populations corresponds to under-recruiting in geographic areas with high minority populations. Therefore, expansion of recruitment efforts to these high minority areas, including establishing enrollment centers and reaching out to faith-based organizationsthere, may improve minority recruitment and retention. In addition, targeted recruitment efforts to the areas that are within the specified ZIP codes but that lie predominantly outside county areas, where the population is younger and more ethnically diverse, may help increase minority and younger participant enrollment.
Additionally, placing more enrollment sites in tracts that are farther from existing sites will decrease the travel time of potential participants and make the study more visible in those areas. Such a strategy based on understanding geographic representation may help to improve demographic representation at the population level, which may in turn improve representation at more resolved geographic units.
One principal reason for current under-sampling areas lying outside the county boundary derives from the initial focus of the study on recruitment within the Cabarrus County lines or the limits of the city of Kannapolis. As the study evolved, it became clear that these boundaries were difficult to use to define eligibility for the study (i.e., ZIP codes are listed on drivers’ licenses that are checked for eligibility, and county is not, and the City of Kannapolis actually resides in two counties), and also that they would not adequately support our plans for a household-based population representative sampling strategy. This led to the redefinition of the catchment area by ZIP code boundaries.
Still, the goal is to recruit an overall population that is representative of the current 18 ZIP code catchment area, through both open enrollment and incorporation of a household-based random sample from which 15,000 participants from the eligible geographic area will be recruited. Importantly, for this random sample recruitment effort, we will use geospatial information to identify and engage “neighborhood ambassadors” who live near randomly selected households to work with MURDOCK Study staff members to provide information and enrollment support for randomly selected households to be approached during door-to-door recruitment. Pilot work is underway, and full-scale implementation of the representative sample is projected to start in Summer of 2014.
Implications of geographic health information systems more broadly
As shown in the MURDOCK Study example, GHIS and spatial analysis provide useful tools for assessing recruitment effectiveness and guiding future efforts to maintain representativeness of the overall population being sampled. The use of spatial methodologies in planning recruitment strategies from the start of a study can elucidate population characteristics by defined areas, thereby facilitating planning for recruitment site locations, materials, and staffing needs. By considering both kinds of representativeness - demographic and geographic - future enrollment efforts can better target under-represented populations and areas, thereby elucidating potentially unmeasured characteristics that influence health and illness that may vary across geographies. Future studies striving for representativeness might establish a baseline prior to recruiting and reassess on an ongoing basis using the methods outlined in this manuscript.
Limitations
There are limitations in both this study, and in reproducing this work in other areas. We did not consider alternative transportation such as bus routes or other public transportation in our distance analysis. This could affect the true travel time of a participant to enrollment site. The MURDOCK Study staff has attempted to use mass enrollments, such as events at drug stores, churches, workplaces, and other public venues, to make enrollment more convenient, and those participants were not included in the analysis. We also used straight line Euclidean distance instead of network-based travel time, an area for improvement in future studies.
We acknowledge that other studies looking to assess representativeness may not have the expertise or software available to leverage the spatial methodologies presented in this work. In addition, spatial scale is an important consideration for this kind of analysis. We chose to work at the census tract level based on the number of participants enrolled in the MURDOCK Study Community Registry and Biorepository. A similar study that has fewer enrollees may force the spatial scale to a coarser level. Despite these limitations, geospatial techniques can be effectively leveraged for future targeted recruitment efforts.
Conclusions
This manuscript employs one population-based study to show how geographic health information systems can add valuable information to traditional registry methodology. First, GHIS can be used to define recruitment strategies up front, facilitating both the design of recruitment strategies and the location of recruitment sites. Second, GHIS can be used to monitor recruitment efforts for both demographic and geographic representativeness. This can turn recruitment efforts into learning systems, where the characteristics (both demographic and geographic) of those already recruited are used in combination with the underlying GHIS to dynamically adjust recruitment strategies. Third, the GHIS can have downstream effects on the power of what can be concluded from analyses of the registry data. The spatial structure of the GHIS can help account for social and environmental characteristics of the local context that may influence health and wellness outcomes. These strengths are widely applicable across studies and can be brought to bear whether the study has not yet been incepted or is already underway. Thus, geographic health information systems provide a powerful set of tools for population-based studies.
Acknowledgements
This study was supported by funding from the Measurement to Understand the Reclassification of Disease of Cabarrus and Kannapolis (MURDOCK) Study through a gift to Duke University from the David H. Murdock Foundation for Business and Culture and grant number UL1RR024128-01 from the National Center for Research Resources, a component of the National Institutes of Health (NIH), and NIH Roadmap for Medical Research. None of the sponsors had a role in study design, data or sample collection, or statistical analyses, interpretation of the data, writing of the study manuscript, or the decision to publish.
Disclosure of conflict of interest
None.
References
- 1.Dawber TR. The Framingham study: the epidemiology of atherosclerotic disease. 1980 [Google Scholar]
- 2.Brenner J. Building an accountable care organization in Camden, NJ. Prescriptions for Excellence in Health Care Newsletter Supplement. 2010;1:6–8. [Google Scholar]
- 3.Miranda ML, Ferranti J, Strauss B, Neelon B, Califf RM. Geographic health information systems: a platform to support the ‘triple aim’. Health Aff (Millwood) 2013;32:1608–1615. doi: 10.1377/hlthaff.2012.1199. [DOI] [PMC free article] [PubMed] [Google Scholar]
- 4.Krieger N, Chen JT, Waterman PD, Rehkopf DH, Subramanian SV. Painting a truer picture of US socioeconomic and racial/ethnic health inequalities: the Public Health Disparities Geocoding Project. Am J Public Health. 2005;95:312–323. doi: 10.2105/AJPH.2003.032482. [DOI] [PMC free article] [PubMed] [Google Scholar]
- 5.Robinson JC, Wyatt SB, Hickson D, Gwinn D, Faruque F, Sims M, Sarpong D, Taylor HA. Methods for retrospective geocoding in population studies: the Jackson Heart Study. J Urban Health. 2010;87:136–150. doi: 10.1007/s11524-009-9403-2. [DOI] [PMC free article] [PubMed] [Google Scholar]
- 6.Comer KF, Grannis S, Dixon BE, Bodenhamer DJ, Wiehe SE. Incorporating geospatial capacity within clinical data systems to address social determinants of health. Public Health Rep. 2011;126(Suppl 3):54–61. doi: 10.1177/00333549111260S310. [DOI] [PMC free article] [PubMed] [Google Scholar]
- 7.Goldberg DW, Jacquez GM. Advances in geocoding for the health sciences. Spat Spatiotemporal Epidemiol. 2012;3:1–5. doi: 10.1016/j.sste.2012.02.001. [DOI] [PubMed] [Google Scholar]
- 8.Miranda ML, Edwards SE. Use of spatial analysis to support environmental health research and practice. N C Med J. 2011;72:132–135. [PMC free article] [PubMed] [Google Scholar]
- 9.Tenenbaum JD, Christian V, Cornish MA, Dolor RJ, Dunham AA, Ginsburg GS, Kraus VB, McHutchison JG, Nahm ML, Newby LK, Svetkey LP, Udayakumar K, Califf RM. The MURDOCK Study: a long-term initiative for disease reclassification through advanced biomarker discovery and integration with electronic health records. Am J Transl Res. 2012;4:291–301. [PMC free article] [PubMed] [Google Scholar]
- 10.Bhattacharya S, Dunham AA, Cornish MA, Christian VA, Ginsburg GS, Tenenbaum JD, Nahm ML, Miranda ML, Califf RM, Dolor RJ, Newby LK. The Measurement to Understand Reclassification of Disease of Cabarrus/Kannapolis (MURDOCK) Study Community Registry and Biorepository. Am J Transl Res. 2012;4:458–470. [PMC free article] [PubMed] [Google Scholar]
- 11.Kim D, Galeano MA, Hull A, Miranda ML. A framework for widespread replication of a highly spatially resolved childhood lead exposure risk model. Environ Health Perspect. 2008;116:1735–1739. doi: 10.1289/ehp.11540. [DOI] [PMC free article] [PubMed] [Google Scholar]
- 12.Cressie NAC. Statistics for spatial data. 1993:900. [Google Scholar]
- 13.Cochran WG. Some methods for streng thening the common X2 tests. Biometrics. 1954;10:417–451. [Google Scholar]