

Abstract
Neuroimaging studies suggest that categorical perception of speech phonemes in adults is primarily subserved by a pathway from bilateral primary auditory areas to association areas in the left middle superior temporal cortex, but the neural substrates underlying categorical speech perception in children are not yet known. Here, fMRI was used to examine the neural substrates associated with phoneme perception in 7- to 12-year-old children as well as the relationships among level of expertise in phoneme perception, the associated activation, and the development of reading and phonological processing abilities. While multiple regions in left frontal, temporal, and parietal cortex were found to be more responsive to phonemic than nonphonemic sounds, the extent of left lateralization in posterior temporal and parietal regions during phonemic relative to nonphonemic discrimination differed depending on the degree of categorical phoneme perception. In addition, an unexpected finding was that proficiency in categorical perception was strongly related to activation in the left ventral occipitotemporal cortex, an area frequently associated with orthographic processing. Furthermore, in children who showed lower proficiency in categorical perception, the level of categorical perception was positively correlated with reading ability and reading and reading-related abilities were inversely correlated with right mid-temporal activation in the phonemic relative to nonphonemic perception contrast. These results suggest that greater specialization of left hemisphere temporal and parietal regions for the categorical perception of phonemes, as well as activation of the region termed the visual word form area, may be important for the optimal developmental refinement of both phoneme perception and reading ability.
Keywords: categorical perception, child, functional magnetic resonance imaging, reading development, speech perception
1. Introduction
Repeated expressions of the same speech utterance inevitably vary acoustically, both between and within speakers. Speech perception entails disregarding phonemically irrelevant acoustic variability and recognizing a wide variety of physically different sounds as exemplars of the same phoneme. As a result, the adult human brain is more sensitive to acoustic variations that cue phonemic categories than to acoustic variations of a similar extent within a phonemic category, a phenomenon known as categorical perception (CP) of speech (Liberman et al., 1957). While CP is not limited to speech (Pastore et al., 1990; Pisoni, 1977), nor to humans (Kuhl and Miller, 1975), it is an essential marker of phonemic perception.
Young infants can discriminate not only contrasts that are phonemic in their native language but also those that are phonemic in languages to which they have had no exposure. However, sensitivity to non-native phoneme contrasts begins to decline in the latter part of the first year of life (Cheour et al., 1998; Eimas, 1975; Werker and Tees, 1984). CP of native phonemes continues to develop between the ages of 6 and 12 years, with performance still not reaching adult levels at the upper end of this age range (Bogliotti, 2003; Elliott et al., 1981; Hazan and Barrett, 2000). This immaturity in speech perception manifests as less precise phoneme boundaries and significantly greater interindividual variability in phonemic categorization than seen in adults (Hazan and Barrett, 2000).
Several lines of evidence suggest a relationship between reading development and development of CP of speech. Bogliotti (2003) reported an increase in CP in children between age 6, before reading acquisition, and age 7, after initial reading acquisition. At age 7, those who were poor readers showed lower discrimination at the category boundary but stronger discrimination of a phonemically irrelevant contrast relative to those who were good readers. Less developed CP has also been linked with developmental dyslexia in both children and adults (Chiappe et al., 2001; Godfrey et al., 1981; Lieberman et al., 1985; Maassen and Groenen, 2001; Serniclaes, 2001). In addition, studies have found CP performance to be associated not only with reading ability (Godfrey et al., 1981), but also with phonological processing abilities thought to be areas of core deficits in dyslexia, specifically, rapid naming of visual stimuli (McBride-Chang, 1996) and phonological awareness (Chiappe et al., 2001; McBride-Chang, 1996), with the latter referring to an appreciation of the segmental nature of spoken language and the ability to manipulate its constituent parts.
The mechanisms underlying these relationships are still unclear. The increase in explicit phonological awareness and letter-name learning that accompanies reading development may sharpen the perception of phoneme categories. Alternatively, maturation of CP may facilitate development of phonological awareness and rapid naming abilities, or a common factor might jointly influence all of these processes. In this regard, anomalies in speech perception and associated event-related potentials (ERPs) can be seen well before the emergence of phonological awareness and rapid naming abilities in infants at familial risk for dyslexia, and these early differences in speech processing have been found to be predictive of future phonological processing performance (for review, see Leppänen et al., 2011; Lyytinen et al., 2004). Specifically, across multiple studies conducted as part of the Jyväskylä Longitudinal Study of Dyslexia, not only was a behavioral difference in categorical perception seen between infants at familial risk for dyslexia relative to control infants (Richardson et al., 2003), but ERP differences were seen suggesting diminished left hemisphere (Leppänen et al., 2002) and enhanced right hemisphere processing during speech perception in the at-risk group (Guttorm et al., 2001; Leppänen et al., 1999). Furthermore, infant speech perception ERPs were associated with later phonological awareness, rapid serial naming, letter knowledge (Guttorm et al., 2010), and second-grade reading and writing skills (Leppänen et al., 2011). Finally, further support for a more direct, or potentially causal, role of speech perception in the development of phonological awareness can be found in two studies showing improvements on measures of phonological awareness following phonemic discrimination training in mainstream children (Moore et al., 2005) and children with reading disabilities (Hurford, 1990). These studies suggest that not only development of CP but also specific left lateralization of CP neural processing may be important for optimal development of reading and phonological processing abilities.
FMRI studies in adults suggest that analysis of acoustic information, such as spectral content, harmonic structure, and pitch, involves the dorsal aspect of the superior temporal gyrus bilaterally, whereas later stages of speech processing involve specific subsystems that are relatively left lateralized (Binder et al., 2000; Davis and Johnsrude, 2003; Scott et al., 2000). In adults, primarily the middle portion of the left ventral superior temporal gyrus and sulcus (STG/STS) is engaged during discrimination of phonemic relative to acoustically matched nonphonemic stimuli, implicating this area in phonemic perception (DeWitt and Rauschecker, 2012; Liebenthal et al., 2010, 2005; Obleser et al., 2007). These results are consistent with a hierarchical speech sound processing system in the superior temporal cortex, extending from dorsal areas in the STG bilaterally, associated with analysis of the physical features of complex sounds, to areas in the left STS, associated with mapping complex auditory patterns in speech to learned phonemic representations.
Developmental changes in activation patterns at the stage of phonemic recoding have not yet been studied using fMRI. FMRI studies examining activation patterns associated with higher-level speech and language processing in children have suggested that, consistent with the ERP infant studies, children as young as two to three months of age show left hemisphere dominance for speech processing (Dehaene-Lambertz et al., 2002); however, the degree of lateralization may continue to increase with age (Gaillard et al., 2000; Szaflarski et al., 2006). In addition, some studies have reported a greater spatial extent of activation or less functional specialization in children ranging in age from 8 to 13 years compared to adults and older adolescents (Gaillard et al., 2000; Lidzba et al., 2011; Tatsuno and Sakai, 2005). These findings, however, are not universal, with some studies finding no differences in degree of lateralization or extent of activation (Gaillard et al., 2003).
In this study, we compared brain responses to phonemic stimuli (the syllables /ba/ and /da/) and acoustically-matched nonphonemic sounds in 32 children, aged 7.9 to 12.9 years, during performance of a discrimination task. Our goal was to investigate the neural substrates associated with phonemic perception in children as well as the relationships among level of expertise in phoneme perception, the associated activation, and the development of reading and phonological processing abilities. We hypothesized that children would show patterns of brain activation associated with CP that are generally similar to those previously seen in adults, including the preferential engagement of the left temporal lobe; however, we expected greater variability in activation patterns among the children, and an association between this variability and both CP performance and reading-related abilities. To examine the latter hypothesis, we examined different subgroups of children defined by their behavioral performance on a categorical perception task as well as by the relationship between proficiency on this task and their level of reading ability.
2. Material and Methods
2.1 Participants
Participants were 39 monolingual, right-handed children, 7 to 12 years of age, who had no history of significant neurological illness or injury, hearing impairment, developmental speech, language or learning disorder, chronic medical illness, or psychiatric disorder. Participants as well as at least one of their parents were native speakers of American English. The latter was necessary to ensure that the children were exposed to American English phonemes from birth. Children were excluded if they had fewer than 40 trials remaining in the phonemic (P) or the nonphonemic (N) scanner conditions after removal of trials in which no response was given or excessive movement occurred. Application of this criterion resulted in the exclusion of 6 children. One additional child was excluded due to poor image quality, leaving a final sample of 32 children (see Table 1 for sample characteristics). The study protocol was approved by the Children’s Hospital of Wisconsin Institutional Review Board. Parents of all participants gave written informed consent, and children provided written assent.
Table 1.
Means and standard deviations (in parentheses) for the demographic and behavioral measures for the full sample and the Low and High Categorical Perception Index (CPI) groups.
| All (n = 32) | Low CPI (n = 9) | High CPI (n = 23) | |
|---|---|---|---|
| Age | 10.30 (1.54) | 10.52 (1.82) | 10.22 (1.46) |
| Sex (% F) | 37.5 | 33.3 | 39.1 |
| Socioeconomic Status | 50.1 (12.4) | 49.8 (10.9) | 50.2 (13.2) |
| WASI Estimated IQ | 115.13 (11.11) | 111.56 (10.04) | 116.52 (11.41) |
| WRAT-3 Reading | 111.72 (7.68) | 109.67 (8.63) | 112.52 (7.33) |
| CTOPP Elision | 11.66 (2.27) | 11.64 (2.24) | 11.67 (2.35) |
| CTOPP RLN | 10.72 (2.56) | 10.89 (2.37) | 11.96 (2.20) |
| CPI | 68.77 (22.37) | 37.44 (11.69) | 81.02 (9.85) |
| P Response Time | 1133.48 (267.32) | 1113.56 (401.73) | 1141.28 (204.41) |
| N Response Time | 1088.23 (251.51) | 1034.83 (363.25) | 1109.13 (198.83) |
| P Identification Slope | 1.39 (1.09) | 1.13 (1.19) | 1.45 (1.02) |
| N Identification Slope | 0.51 (0.49) | 0.39 (0.50) | 0.58 (0.47) |
| % P Motion Trials Removed | 10.59 (7.23) | 13.52 (8.09) | 9.44 (7.60) |
| % N Motion Trials Removed | 11.39 (10.09) | 14.32 (5.74) | 10.24 (11.24) |
| % Missed in P | 4.34 (3.81) | 4.51 (4.49) | 4.28 (3.62) |
| % Missed in N | 4.88 (5.57) | 4.69 (5.15) | 4.95 (5.84) |
WASI = Wechsler Abbreviated Scale of Intelligence; WRAT-3 = Wide Range Achievement Test – 3; CTOPP = Comprehensive Test of Phonological Processing; RLN = Rapid Letter Naming; P = Phonemic; N = Nonphonemic
2.2 Stimuli
Stimuli were created using a cascade/parallel formant synthesizer (SenSyn Laboratory Speech Synthesizer, Sensimetrics Corp., Cambridge, MA). The P test items consisted of a 7-token continuum from /ba/ to /da/. Pitch, intensity, formant bandwidth and formant center frequency parameters for synthesis of the anchor points of the P continuum were derived from natural utterances of the syllables produced by a male speaker (JRB) and sampled at 44.1 kHz. The pitch, intensity and formant bandwidths of the anchor points, as well as the formant center frequencies throughout the steady-state vowel segment of the syllables were equated across tokens using average values. Tokens were edited to 150 ms duration. The anchor points of the N continuum were constructed by spectrally inverting the first formant of the speech syllables in order to disrupt their phonemic value without altering their general spectrotemporal characteristics. Intermediate tokens for both continua were interpolated as described in a previous study (Liebenthal et al., 2005). Spectrograms for an example stimulus from each continuum are provided in Supplementary Figure S1.
2.3 Procedure
All participants completed a brief audiometric screening test to ensure that they had no unidentified hearing impairment. They were familiarized with the P and N perception tasks as follows: (1) identification training on the anchor points; (2) identification testing on the entire continuum; and (3) practice of the discrimination task in a mock scanner. Brief neuropsychological testing was also performed, including measures of estimated IQ (the Wechsler Abbreviated Scale of Intelligence (Wechsler, 1999)] - Vocabulary and Matrix Reasoning subtests), single-word reading (Wide Range Achievement Test-3rd Edition (Wilkinson, 1993)- Reading subtest), and phonological processing (two Comprehensive Test of Phonological Processing [Wagner et al., 1999] subtests). With regard to the latter, the aspects of phonological processing assessed included the rapid retrieval of phonological codes associated with letter stimuli (Rapid Letter Naming), and phonological awareness (Elision). Socioeconomic status was assessed using a modified Hollingshead Index of Social Status (Hollingshead, 1975) based on the educational and occupational attainment of the parent with the highest status, or in cases of divorce or single parenthood, the parent with primary placement.
During scanning, participants performed a 2-alternative forced-choice AX discrimination task (i.e., is the second sound in a pair identical to the first?). The distance in acoustic space between the tokens in each pair was identical, but, for the P items, one token-pair is within the /ba/ category (1-3), one is within the /da/ category (5-7), and one crosses the phonemic category boundary (3-5). A single trial was presented in each interval between image acquisitions, beginning 490 ms following the completion of an acquisition. The stimuli were 150 ms in duration separated by a 1000 ms interstimulus interval and followed by a 2700 ms response window. P and N stimuli were presented in alternating runs. Each run contained ten discrimination pairs of each type and five baseline silence trials. Participants in the younger (7-9 year) range completed four runs, and those in the older range (10-12 year) completed four to six runs.
2.4 Image Acquisition
Images were acquired on a 3T GE Signa Excite scanner (GE Medical Systems, Milwaukee, WI). Whole-brain fMRI data were acquired using gradient-echo, echoplanar imaging (TE = 20 ms, flip angle = 90°) at long intervals (TR=7 sec; acquisition time=2 sec). The clustered acquisition paradigm was used to avoid perceptual masking of the test items and contamination of the BOLD data by the acoustic noise of the scanner (Edmister et al., 1999). Thirty-six axial slices, 3 mm thick, were acquired with 0.5 mm gap between slices to prevent signal bleed. The field of view was 220 cm and matrix 64×64, resulting in nearly isotropic 3.44-mm voxels covering the whole brain. High resolution, T1-weighted structural images were obtained at each session using a 3D SPGR sequence (TE = 3.9 ms, TR = 9.5 ms, TI = 450 ms, flip angle = 12°, matrix = 256 × 224, NEX = 1, slice thickness 1.2 mm, 106 axial slices, scan time = 6.23 min).
2.5 Image Analysis
Image processing and statistical analysis were performed using the Analysis of Functional Neuroimages (AFNI) software package (Cox, 1996). Within-subject analysis included volumetric image registration to minimize head motion artifacts and voxelwise multiple linear regression with reference functions representing experimental conditions (P, N) and regressors of no interest (linear and nonlinear trends, condition-specific RTs, and motion parameters). Missed trials (i.e., trials on which the participant did not respond) and trials with greater than 10% outlier voxels, an index of excessive motion, were removed from the analyses. Individual t-maps were computed to determine the significance of the activation (relative to rest) in each of the experimental conditions. General linear tests were conducted for each contrast. Individual anatomical scans and statistical t-maps were transformed into standard stereotaxic space (Talairach and Tournoux, 1988), and stereotactically resampled functional maps were smoothed with a 6mm FWHM Gaussian filter. In this regard, studies have supported the feasibility of using adult-defined common stereotaxic space for analysis of pediatric data, suggesting that anatomical differences between the atlas-transformed brain morphology of children aged 7 to 8 years and adults are minimal relative to the level of resolution possible with current functional imaging and do not result in spurious functional differences (Burgund et al., 2002; Kang et al., 2003).
Group maps were generated using random effects analysis. The contrast maps for the full sample analyses were thresholded at a voxelwise z > 2.810, and clusters smaller than 630 μl were removed to yield a mapwise threshold of alpha < 0.05 as determined through Monte Carlo simulations. Also yielding a mapwise threshold of alpha < .05, the contrast maps for the smaller groups of nine subjects and the regression maps were thresholded at a voxelwise z > 2.577 with clusters smaller than 891 μl removed.
In addition to the whole brain analyses, regions of interest (ROIs) in each hemisphere were anatomically defined using a digital atlas based on probabilistic cytoarchitectonic maps and macro-anatomical labels (Eickhoff et al., 2005). These included an inferior frontal region (IF) comprised of the IFG and Rolandic operculum (RO), a middle STG/MTG region that also included Heschl’s gyrus (mS/MTG), a posterior STG/MTG region (pS/MTG), and an inferior parietal region (IPL) comprised of the SMG and AG. These regions were selected for analysis based on the involvement of each region in different aspects of speech processing in previous work (Liebenthal et al., 2005; Hickok and Poeppel, 2007; Liebenthal et al., 2010; Turkeltaub and Coslett, 2010). The division between mS/MTG and pS/MTG was set at the medial posterior tip of HG (Talairach y = -30), consistent with previous functional differentiation of these regions (Liebenthal et al., 2010). To calculate lateralization of the BOLD response in each ROI, individual intensity-based thresholds for each of these regions were calculated for each participant in each condition using a method described by Fernandez et al. (2001) and Jansen et al. (2006). To determine the threshold, the mean activation level for the most extreme 5% of the voxels was determined. The threshold was then set to signal intensity changes that exceeded 50% of the mean activation level for this 5% of voxels. The number of voxels that exceeded that threshold were counted. Lateralization indices (LI) were calculated using the ratio, (VL - VR)/ (VL + VR), in which VL and VR refer to the number of activated voxels in the left and right hemispheres, respectively. Positive values suggest greater left lateralization. Values exceeding + .20 were considered to represent significantly lateralized activation, whereas values between these limits were considered to suggest a bilateral pattern. While the selection of a threshold for attributing language dominance is somewhat arbitrary, the threshold of .20 has been considered to be a reasonable one for this purpose in numerous prior fMRI studies (Seghier, 2008; Springer et al., 1999).
2.6 Behavioral Data Analysis
Identification performance was examined using the beta coefficient from a logistic regression fitted to individual identification curves. The beta values, which represent the slope of the regression function, were highly skewed, and therefore a square root transformation was applied, but significant departure from normality remained. High values of beta suggest a steep, step-like curve characteristic of CP. Low values suggest a more linear or continuously varying response, and values close to 0 indicate a flat response curve or no difference in labeling across the continuum. With regard to discrimination performance, a CP index (CPI) was computed. This index was defined as the difference between the percentage of across-category P pairs perceived as “different” and the average percentage across the two sets of within-category P pairs perceived as “different”. There was substantial variation in the CPI across the sample, and discontinuities were observed in the distribution of CPIs (Fig. 1). To examine potential differences in activation patterns associated with CP proficiency, the sample was divided into two groups at the point of greatest discontinuity, forming a Low CPI group (<50; n = 9) and a High CPI group (>60; n = 23).
Figure 1.

Distribution of Categorical Perception Index scores across the 32 individual participants. The dotted circle highlights the largest discontinuity and the solid circle highlights the smaller discontinuity.
Correlations between the CPI, the reading and phonological processing performances, and the extent of activation for P relative to N in each of the ROIs were examined. The correlations with the neuropsychological variables were only run in the predefined ROIs to minimize the number of analyses. As a means of correcting for the remaining large number of correlations performed, without risking an unacceptably high Type II error rate, only correlations that were both significant at p < 0.05 (two-tailed) and reflected a large effect size, i.e., coefficient greater than or equal to 0.5, were considered significant. Because of the small sample size in the Low CPI group, the obtained correlations are considered to be preliminary findings to be used for the purpose of generating hypotheses for further examination in larger samples.
Many of the ROI variables showed significant departures from normality based on the Shapiro-Wilk test and/or indices of skewness and kurtosis. Therefore, non-parametric tests were used for these analyses, including Spearman’s ρ for the correlations, the Mann-Whitney-Wilcoxon test for the between-subject analyses, and the Wilcoxon Signed-Rank Test for the repeated measures analyses. The use of Spearman’s ρ does not permit the inclusion of age as a covariate; however, this was considered acceptable because no correlations between age and the CPI or activation in the ROIs met significance criteria in any group, and age-corrected standard scores were used for all of the neuropsychological variables.
3. Results
3.1 Behavioral Results
Category labeling of the continua was tested prior to scanning. As expected, the slope of the identification function (Fig. 2), which reflects the degree of CP, was much steeper for the P compared to the N stimuli (Mean + standard deviation of beta coefficients in logistic regression functions fitted to individual identification curves for P = 1.36 + 1.06 and for N = 0.53 + 0.48 (Z = 4.076, p < 0.001). The results were also compared to those of the 25 adults who had participated in a previous study using the same stimuli (Liebenthal et al. 2005). The adults showed significantly steeper slopes for both the P (2.47 + 1.33) and the N (0.94 + 0.39) continua compared to the children (U = 195, p =0.001 and U = 209, p = 0.002, respectively). Same-different (AX) discrimination performance during fMRI (Fig. 3) indicates that the children did perceive the P stimuli categorically. Specifically, across-category discrimination (token-pair 3-5) was significantly stronger than within-category discrimination (token-pairs 1-3 and 5-7) for P (z = 4.937 and 4.900, p < 0.001, respectively). In contrast, for N, the differences in discrimination across token pairs was smaller, although it was significantly higher for the 5-7 token-pair than the 3-5 or 1-3 pairs (Z = -3.309, p = 0.001, and -2.832, p = 0.005, respectively).
Figure 2.
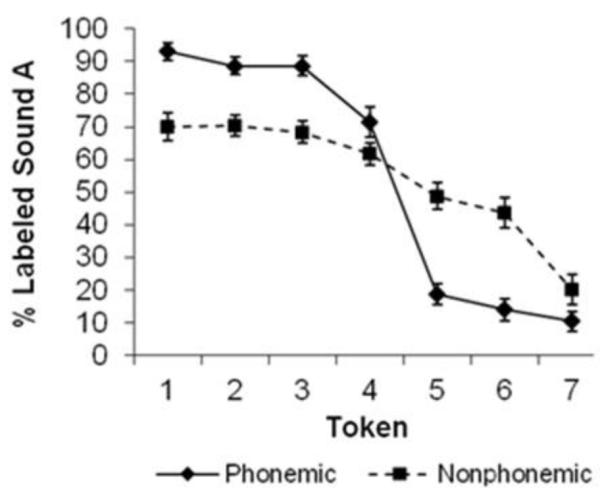
Identification functions for the phonemic and nonphonemic stimuli. Error bars reflect the standard error of measurement
Figure 3.

Discrimination functions for the High and Low Categorical Perception Index (CPI) groups in the phonemic (P) and nonphonemic (N) conditions. Error bars reflect standard error of measurement.
The Low (CPI <50) and High (CPI >60) CPI groups did not significantly differ with regard to age, sex, socioeconomic status (SES), estimated IQ, single-word reading, phoneme deletion, rapid serial naming of letters, slope of the identification function, median response times (RTs) in P and N, percentage of P and N items on which there was no response, or percent trials removed from P or N for motion (Table 1). Both groups showed significantly stronger across-than within-category discrimination in P. However, the Low CPI group also showed higher discrimination of the within-/da/ trials than the within-/ba/ trials (Z = -2.547, p = .011), while the High CPI group showed no significant difference between the within-category trials (Z = -1.429, p = .153). In the group comparisons, the Low CPI group showed both weaker discrimination of the across-category P token-pairs (U = 2, p < 0.001) and stronger discrimination of the /da/ within-category P token-pairs, with a similar trend for the /ba/ within category pairs (for /da/, U = 12, p < 0.001; for /ba/, U = 60.5, p = 0.071) relative to the High CPI group. The groups did not significantly differ with regard to their discrimination of the N token-pairs. With regard to RT, there were no significant differences between individual participants’ median RTs for P and N in any group.
In the full group, there were no significant correlations between the CPI and the neuropsychological measures. However, visual inspection of the relationship between the CPI and single-word reading suggested that there could be a significant association between these variables in participants who performed below a CPI of 70 (Fig. 4), with this CPI level corresponding to a second smaller discontinuity in the CPI distribution (Fig.1). Indeed, in the 14 participants with a CPI below 70, there was a significant correlation between reading and the CPI (ρ= 0.54, p = 0.049). Further exploration of this relationship indicated that this reflected a correlation specifically between reading and the ability to discriminate across-category tokens (ρ = 0.56, p = 0.037).
Figure 4.

Categorical Perception Index (CPI) scores plotted against single-word reading performance on the Wide Range Achievement Test-3 (WRAT-3) in participants with CPIs < 70 and CPIs > 70
3.2 FMRI Results
3.2.1 Whole Brain Analyses
Results for the entire group are shown in Figure 5A and Supplementary Table S1A. In the P condition relative to the resting baseline, extensive left hemisphere activation was seen in the STG extending ventrally into the posterior STS, as well as in the insula, inferior frontal gyrus and sulcus (IFG/IFS), middle frontal gyrus (MFG) extending into the superior frontal gyrus (SFG), supplementary motor area (SMA), precentral (PrCG) and postcentral (PoCG) gyri, Rolandic operculum and parietal operculum (RO/PO), supramarginal gyrus (SMG), intraparietal sulcus (IPS), thalamus, cerebellum, and ventral occipitotemporal cortex somewhat anterior to the putative “visual word form area” (VWFA). Smaller foci of activation were seen in the right STG, RO/PO, PrCG, PoCG, and thalamus. Areas of relative activation during the “resting” baseline were noted in the right angular gyrus (AG), superior occipital gyrus (SOG), and cuneus. For N contrasted with baseline, activation was seen in the STG, RO/PO, PrCG, PoCG, thalamus, and cerebellum bilaterally, but greater on the right, as well as in right STS, pMTG, lateral occipital cortex, and ventral occipitotemporal cortex, extending medially to the lingual gyrus. Greater activation during baseline relative to N was seen in the left IFG, posterior MFG, SFG, temporal pole, SOG, and precuneus. The direct contrast of the P and N conditions revealed extensive areas of greater activation during P in the left frontal cortex and, to a lesser extent, left PoCG, anterior STG/STS, caudate, putamen, and cerebellum. Greater activation for N was observed in the right posterior cortex, including posterior STS and MTG, AG, and medial and lateral occipital regions.
Figure 5.
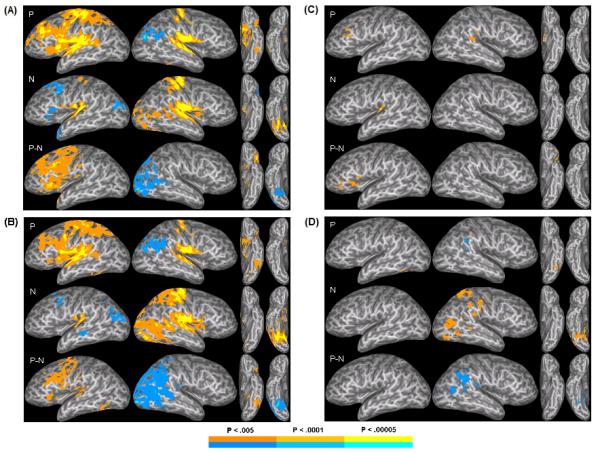
Activation patterns in each group. Activation patterns in the phonemic condition relative to baseline (P), the nonphonemic condition relative to baseline (N), and the P condition relative to the N condition (P-N) for (A) the entire sample; (B) the High Categorical Perception Index (CPI) group; (C) the Low CPI group, and (D) the High relative to the Low CPI group. The maps were thresholded at a voxelwise z > 2.810, and clusters smaller than 630 μl were removed to yield a mapwise threshold of alpha < 0.05. Hot colors indicate regions of greater activation in the first condition, while cool colors indicate greater activation in the contrasting condition.
Activation in the High CPI group closely resembled that in the full group (Fig. 5B and Supplementary Table S1B). However, in P relative to baseline, the High CPI group showed qualitatively more extensive suprathreshold activation in the left ventral occipitotemporal cortex extending more posteriorly along the left occipitotemporal sulcus (OTS) and fusiform gyrus (FG). For N relative to baseline, there was more extensive posterior temporal, parietal, and occipital activation on the right. An additional focus of deactivation was seen in the left mid to posterior STS. Activation for the contrast between P and N also resembled that seen in the full group, but there appeared to be less extensive left frontal activation, and there was additional suprathreshold activation in the left posterior STG as well as the pOTS and FG. Additional relative activation for N compared to P was seen in the right posterior STG/STS and IPL.
Qualitatively, much less activation exceeded threshold in the Low CPI group, which is expected given the much smaller sample size (Fig. 5C and Supplementary Table S1C). In the P condition relative to baseline, there was no activation in left temporal regions, while there was a significant focus in the right STG. Otherwise, there was significant activation in left lateral and medial frontal regions, including the left MFG/IFS and anterior insula as well as the cingulate gyrus and SMA, which overlapped with that seen in the High CPI group but appeared much smaller in extent. In contrast, in the N condition relative to baseline, activation was confined to the left STG. Finally, when contrasting activation in the P and N conditions, there was activation exclusively in the left lateral frontal regions, including left pars orbitalis, pars triangularis, and anterior insula.
In the direct contrast between High and Low CPI groups for the P condition relative to rest (Fig. 5D and Supplementary Table S1D), significant activation was seen in left pOTS/FG, reflecting greater activation in this region for the High CPI group. There was an area of relative activation for the Low CPI group in the right SMG. In N, there was substantial activation throughout the posterior right cortex for the High compared to the Low group, including the PoCG, SMG, pMTG, lateral occipital cortex, fusiform gyrus, lingual gyrus, and cerebellum. Overlapping right posterior areas showed decreased activation in the P relative to N contrast and appear to reflect both the greater relative activation in the region in P for the Low compared to the High CPI group and the greater activation in surrounding regions in N for the High CPI group.
Because of the large difference in sample sizes and the potential consequences of an unbalanced design on power and robustness to violations of assumptions, particularly homogeneity of variance, additional whole brain analyses were conducted to examine the reliability of the group difference findings. A sample of nine participants were pseudorandomly drawn from the High CPI group, with the constraints that this group did not differ from the Low CPI group with regard to age, SES, neuropsychological performances, percent of trials removed for motion in P and N, percent of missed trials in P or N, and median RTs in P and N. The maps for the comparisons between the size-matched groups are very similar to those using the full High CPI group, suggesting that the group differences previously described are not secondary to the sample size differences. The results of these comparisons are provided in the Supplementary Material (Supplementary Fig. S2).
In addition, the relationship between CPI and brain activation was examined using multiple regression across the full sample (Fig. 6), covarying for age. Consistent with the between-group findings, there was a significant positive correlation with activation in the left pOTS/FG in P. There was also a focus in the left parahippocampal gyrus. In N, significant positive correlations were seen between CPI and activation in bilateral, predominantly right cerebellum and right lingual gyrus, while a negative correlation was seen between more posterior bilateral cerebellar activation, primarily left, and CPI in the P-N contrast.
Figure 6.
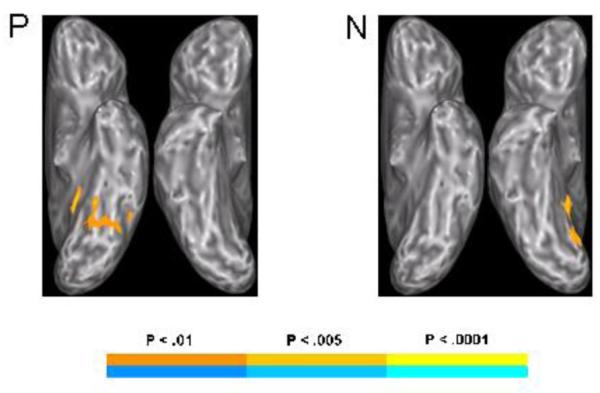
Regions significantly correlated with the Categorical Perception Index in the full sample for the phonemic (P) and nonphonemic (N) conditions. The maps were thresholded at a voxelwise z > 2.577 with clusters smaller than 891 μl removed, yielding a mapwise threshold of alpha < 0.05.
3.2.2 ROI Analyses
Differences in the extent of lateralization between the High and Low CPI groups for the PN contrasts were examined for each ROI using a lateralization index (Table 2). While the groups showed similar levels of left lateralization in the IFG, significant differences in lateralization were seen in the pS/MTG (U = 36, p = .004) and IPL (U = 52, p = .031). In each case, the lateralization was reversed across the groups, with left lateralization in the High CPI group and right lateralization in the Low CPI group, consistent with what was seen in the whole brain analyses. There was a trend in the mS/MTG (U = 62, p = .086), reflecting left lateralization in the High CPI and more bilateral activation (right greater than left) in the Low CPI group.
Table 2.
Laterality indices for the Low and High Categorical Perception Index (CPI) groups in the phonemic condition relative to the nonphonemic condition.
| Region | Low CPI Group | High CPI Group | Mann-Whitney U | P value |
|---|---|---|---|---|
| IFG | 0.36 (0.60) | 0.47 (0.58) | 92.5 | 0.651 |
| IPL | −0.41 (0.77) | 0.36 (0.74) | 52 | 0.031 |
| mS/MTG | −0.11 (0.79) | 0.33 (0.71) | 62 | 0.086 |
| pS/MTG | −0.52 (0.64) | 0.47 (0.75) | 36 | 0.004 |
IFG = Inferior Frontal Gyrus; IPL= Inferior Parietal Lobule; mS/MTG: Middle Superior and Middle Temporal Gyrus; pS/MTG: Posterior Superior and Middle Temporal Gyrus.
Examination of the mean LIs for the P and N conditions separately in the pS/MTG and IPL suggests that these findings reflect important differences in lateralization between the two groups in both conditions. In P, the High CPI group showed left lateralization in these two regions (mean LIs = 0.374 and 0.266, respectively), whereas the Low CPI group showed right lateralization (mean LIs = -0.233 and -0.346). In contrast, the High CPI group showed right lateralized activation in these areas in N (mean LIs = -0.470 and -0.304), while the Low CPI group showed weak left/bilateral lateralization (mean LIs = 0.174 and 0.203). These group differences were significant for both regions in both conditions (pS/MTG in P, p = .038; pS/MTG in N, p = .007; IPL in P, p = .047, IPL in N, p = .043).
Correlations between the ROI active voxel counts in the P-N contrasts and both age and the behavioral variables for each group were also examined. For the full sample and the High CPI group, no correlations met both the threshold and effect size criteria used to determine significance in the current study. In contrast, in the Low CPI group (Table 3 and Fig. 7), there were significant negative correlations between activation in the right mS/MTG and all of the reading-related variables, including single word reading (ρ = -0.733, p = 0.025), phoneme deletion (ρ = -0.703, p = 0.034), and rapid letter naming (ρ = -0.826, p = 0.006). In addition there was a significant positive correlation between activation in the left pS/MTG and CPI (ρ = 0.695, p = 0.038).
Table 3.
Correlations of age and the behavioral variables with activations in the individual regions of interest in the Low CPI group. Correlations in bold type are significant.
| Region | Age | CPI | WRAT-3 Reading |
CTOPP Elision |
CTOPP RLN |
|
|---|---|---|---|---|---|---|
| Left IFG | ρ | 0.261 | 0.067 | 0.367 | 0.390 | 0.247 |
| p | 0.498 | 0.865 | 0.332 | 0.300 | 0.522 | |
| Right IFG | ρ | −0.252 | 0.300 | −0.050 | −0.636 | −0.179 |
| p | 0.513 | 0.433 | 0.898 | 0.066 | 0.645 | |
| Left IPL | ρ | 0.546 | 0.200 | 0.350 | 0.271 | 0.392 |
| p | 0.128 | 0.606 | 0.356 | 0.480 | 0.297 | |
| Right IPL | ρ | −0.042 | 0.033 | −0.183 | −0.466 | −0.519 |
| p | 0.915 | 0.932 | 0.637 | 0.206 | 0.152 | |
| Left mS/MTG | ρ | 0.325 | 0.117 | 0.611 | 0.234 | 0.594 |
| p | 0.394 | 0.794 | 0.081 | 0.544 | 0.092 | |
| Right mS/MTG | ρ | −0.210 | 0.233 | −0.733 | −0.703 | −0.826 |
| p | 0.587 | 0.546 | 0.025 | 0.034 | 0.006 | |
| Left pS/MTG | ρ | 0.253 | 0.695 | 0.360 | −0.098 | −0.034 |
| p | 0.511 | 0.038 | 0.342 | 0.802 | 0.930 | |
| Right pS/MTG | ρ | 0.202 | −0.167 | −0.450 | −0.356 | −0.460 |
| p | 0.603 | 0.668 | 0.224 | 0.347 | 0.213 | |
CPI =Categorical Perception Index; WRAT-3 = Wide Range Achievement Test-3; CTOPP = Comprehensive Test of Phonological Processing; RLN = Rapid Letter Naming; IFG = Inferior Frontal Gyrus; IPL= Inferior Parietal Lobule; mS/MTG: Middle Superior and Middle Temporal Gyrus; pS/MTG: Posterior Superior and Middle Temporal Gyrus.
Figure 7.

Scatterplots of the rank-transformed behavioral and activation data for each of the significant Spearman’s ρ correlations in the Low Categorical Perception Index (CPI) group: (A) correlation between activation in the right middle superior/middle temporal gyri (mS/MTG) and the Wide Range Achievement Test-3 (WRAT-3) Reading subtest, (B) correlation between activation in the right mS/MTG and the Comprehensive Test of Phonological Processing (CTOPP) Elision subtest, (C) correlation between activation in the right mS/MTG and the CTOPP Rapid Letter Naming subtest, and (D) correlation between activation in the left posterior superior/middle temporal gyri (pS/MTG) and the CPI.
4. Discussion
Contrary to expectations, in the full sample, we found stronger activation in large regions of left frontal cortex for P relative to N. In the previous adult study, the left frontal cortex was activated to the same extent in both P and N relative to rest, thus activation in this region was interpreted as reflecting nonspecific executive processes such as working memory and response selection. The finding of greater left frontal activation in P relative to N in the children suggests that it may reflect processes associated specifically with phonemic perception, although the possibility of differential effort in the two conditions must be considered. Importantly, several findings suggest that the lesser frontal activation in N does not simply reflect lack of effort in this condition. First, RT, which can be regarded as a gross indicator of effort, did not differ significantly between P and N in any group. Second, the discrimination response pattern in N was not random, as one would expect if the children were simply guessing. Although this did not attain significance in the Low CPI group, the children in both the High and Low CPI groups showed the same pattern of weaker discrimination with two sets of token-pairs in the N continuum, specifically 1-3 and 3-5, than with the 5-7 pair. Third, areas within the right temporoparietal cortex were more active in N compared to both the resting baseline and P. This region has been associated with attention to local spectral properties of the sounds as opposed to more categorical properties (Brechmann and Scheich, 2005; Geiser et al., 2008). Thus, the greater activation in this region for N is consistent with expected task-specific processing.
Many of the frontoparietal regions activated in the P condition relative to N, such as the pars opercularis, insula, SMA, PrCG, PoCG, and the RO/PO, including the Sylvian parietal temporal region (Hickok and Poeppel, 2007), have been implicated in articulation and/or auditory-articulatory interactions (Okada and Hickok, 2006). These areas are activated not only during speech production tasks but also in speech perception tasks, particularly when the speech input is noisy (Chevillet et al., 2013; Hickok and Poeppel, 2007; Liebenthal et al., in press; Meister et al., 2007; Okada and Hickok, 2006). It has been postulated that such auditory-motor interactions may be particularly important during speech development (Hickok and Poeppel, 2007), and it is possible that, prior to full mastery of phonemic categorization, auditory-motor associations may play a significant role in facilitating or guiding phoneme perception (Callan et al., 2004). The potentially greater reliance on auditory-motor associations for phoneme perception during the time of reading development may fit with findings suggesting an association between difficulty with auditorily guided, rhythmic motor tapping and both phonological processing and reading performance in children with dyslexia (Thomson and Goswami, 2008).
There was also significant activation in the P-N contrast in the IFS. A role for the left IFS in decision-making processes underlying the computation of category representations has been suggested by Myers and colleagues (2009), who used a short-interval habituation paradigm with a pitch change detection task rather than an active discrimination task. In the current study, this region was strongly activated in the P-N contrast, but two findings do not fully support the idea that this region plays a central role in categorical discrimination, at least in this age range. First, activation in this region did not significantly differ as a function of categorical discrimination performance. Second, there was no significant activation in this region for phonemic perception in the smaller group of nine good categorizers even with the less conservative voxelwise threshold.
In contrast to the findings in frontal regions, categorical discrimination performance was strongly associated with activation patterns in posterior temporoparietal regions. In the group ROI comparisons, opposite patterns of lateralization were seen in the High and Low CPI groups in the posterior temporal and inferior parietal ROIs, with left lateralization seen in the High CPI group and right lateralization in the Low CPI group for P relative to N. In P, the High CPI group showed left lateralization in these two posterior regions, whereas the Low CPI group showed right lateralization. In contrast, the High CPI group showed right lateralized activation in these areas in N, while the Low CPI group showed weak left/bilateral lateralization. The importance of right lateralized activation in posterior regions for N was also evident in the whole-brain group comparisons, in which the High CPI group showed significantly greater activation in these regions. Together, these findings strongly suggest that CP of phonemes is associated with left-lateralized processing, whereas weaker development of CP is associated with more right-lateralized processing. Moreover, the strong hemispheric dissociation between P and N processing in the High CPI group suggests that CP involves a perceptual distinction between phonemic and nonphonemic sounds and assignment of each to lateralized processing systems.
Also supporting this hypothesis, the preliminary correlation results obtained with the Low CPI group suggest the possible presence of a relationship between the CPI and the extent of activation in the left pS/MTG during P relative to N. The finding of a strong association between phonemic CP performance and the posterior rather than middle temporal cortex is interesting in the context of previous fMRI findings in adults. Multiple fMRI studies in adults have reported an association between activation in middle STS and phoneme categorization (DeWitt and Rauschecker, 2012; Liebenthal et al., 2010, 2005; Obleser et al., 2007). One of these studies (Liebenthal et al., 2010) also found increased activation in a more posterior region of the STG/STS when adults performed a categorical identification task following categorization training with speech-like nonphonemic sounds. Similarly, in other studies (Dehaene-Lambertz et al., 2005; Desai et al., 2008), activation in the posterior STG/STS was seen when adults performed a categorization task using sine wave speech after exposure to the phonetic properties of the sounds, and the level of activation in this region was correlated with the degree of categorization. Overall, these studies suggest that the left mSTG/STS may store phonemic representations, while the pSTG/STS may be recruited when the sounds are not as familiar or overlearned and categorization must still rely on detailed physical features of the sounds. The current findings linking phoneme categorization performance more strongly with the posterior temporal cortex in school-age children suggest that phonemic representations in left middle temporal regions may not be fully developed at this age. However, while the CPI was more associated with activation in the pS/MTG, activation in the right mS/MTG region in the P-N contrast was significantly inversely related to aspects of reading and reading-related abilities in the children with low CPIs, suggesting that the extent of lateralization in this region for phonemic relative to nonphonemic perception may be associated with development of these abilities at this age. The finding of an association between greater right hemisphere processing for phonemic perception and poorer reading and phonological abilities is consistent with the ERP findings obtained in control and at-risk infants conducted as part of the Jyväskylä Longitudinal Study of Dyslexia (Leppänen et al., 2011; Lyytinen et al., 2004). Additional developmental studies investigating functional and structural connectivity and activation changes occurring on a finer time scale, as well as using nonspeech sounds that are more categorically perceived (e.g., those differing in tone-onset time), may assist in further elucidating the underlying mechanisms for these findings.
In addition to these preliminary findings of correlations between activation in the P-N contrast and both reading and phonological abilities, a direct relationship between CPI and single-word reading ability was found below a CPI level of 70, suggesting that, in at least a subset of children, this ability is related to reading performance. Overall, these results suggest that, in childhood, greater specialization of the left temporal regions for the CP of speech sounds, including both greater left lateralization for phonemic perception as well as greater right lateralization for nonphonemic perception, may be important for the appropriate refinement of CP and for the optimal development of reading and phonological abilities.
Importantly, the small sample size in the Low CPI group is a significant limitation. The cohesive pattern of findings that emerged across different analyses and in the context of previous studies appears compelling, particularly given the low power in this group; however, the findings should be interpreted with caution in light of the sample size and, as noted previously, should be considered preliminary at this point in time. Replication in larger samples of children with low CPI is needed.
An unexpected set of findings was the significant activation of left ventral occipitotemporal cortex during this entirely auditory task, and the strong relationship between activation in this region and CPI as seen in both the whole-brain group comparisons and the regression analysis. The local maxima within the left pOTS/FG in the group comparisons for P (Talairach coordinates: -40 -56 -13 for the full High CPI group and -41 -57 -11 for the small High CPI group) and the regression analysis for CPI in P (-40 -55 -13) correspond well to the coordinates reported previously for the putative VWFA (Cohen et al., 2000: -43 -54 -12; Cohen et al., 2002: -42 -57 -15, -44 -55 -17). The peak activation in the P-N contrast in the High CPI group (-39 -62 -11) is slightly more posterior, but the cluster includes the classic coordinates for the VWFA (Cohen et al., 2000). While the precise role of this region and its specificity for processing orthographic input relative to nonorthographic visual stimuli is still debated, it is consistently found to be activated during tasks involving reading visually presented words or pseudowords, and damage to this area has been found to selectively disrupt visual word recognition (Binder and Mohr, 1992; Cohen et al., 2003; Leff et al., 2006). It is also frequently reported to be hypoactivated in individuals with developmental dyslexia relative to normal controls (Maisog et al., 2008; Richlan et al., 2009).
One of the proposed functions of this area is the extraction of abstract orthographic representations (Dehaene et al., 2001, 2004; Polk and Farah, 2002). Similar to phonemes in the auditory modality, different instances of the same letters or frequently encountered letter sequences must be recognized quickly, despite substantial variations in visual appearance, in order for fluent reading to occur. Activation in this region of the left pOTS is invariant to many visual characteristics that are irrelevant to letter or word identification, such as case, size, vertical or horizontal orientation, and retinal location (Cai et al., 2010; Dehaene et al., 2004, 2001; Polk and Farah, 2002), while showing significant sensitivity to statistical familiarity of letter sequences (Binder et al., 2006). It has been proposed that phonology may play an important role in the development of abstract orthographic representations (Bowers and Michita, 1998) and that another function of this region may be to link visual information with higher linguistic representations, such as phonological representations. The importance of phonology to the development of activation in left ventral occipitotemporal cortex is suggested by a study by Hashimoto and Sakai (Hashimoto and Sakai, 2004) in which activation was found in a region just lateral to the left pOTS in adults for newly learned letters but only if learned in association with speech sounds as opposed to nonspeech sounds. Beyond development, recent studies have suggested that the VWFA region is sensitive to spelling-sound consistency (Graves et al., 2010) and the presence of phonological task demands (Mano et al., 2013), providing further support for a role of this region in linking orthography and phonology.
Although activation in this region is most typically seen when visual stimuli are used, a few studies have shown activation in this region during phonological tasks using spoken stimuli such as auditory word rhyming tasks in children and adults (Booth et al., 2004; Cone et al., 2008; Desroches et al., 2010), with increased activation seen in association with greater conflict between orthographic and phonological information (cCone et al., 2008; Desroches et al., 2010). The possible greater involvement of the left pOTS in auditory language tasks in children relative to adults was suggested by a study by Church and colleagues (2008) in which activation in the vicinity of the VWFA was seen for both a word reading and an auditory word repetition task in children but only the reading task in adults. To our knowledge, however, the current study is the first to report left pOTS activation associated with an auditory task involving an early stage of sublexical speech processing and to find activation in this area modulated by expertise in phoneme perception. Such a relationship has not been reported in prior investigations of categorical perception in adults. The association of activation in this region with proficiency of categorical perception in children aged 7 to 12 suggests that strong phoneme category representations may be important for the optimal development of abstract orthographic representations and/or of the mapping between orthographic and phonological representations during reading acquisition. The reverse direction of causality is also possible, with better development of abstract orthographic representations and of grapheme-phoneme mapping resulting in stronger phonemic category representations.
Importantly, the regions that showed group differences in lateralization patterns for P-N (i.e., pS/MTG and the IPL) or in which a significant relationship was found with CPI during phonemic perception (i.e., the left pOTS) are the areas most commonly implicated in dyslexia (Breier et al., 2003; Maisog et al., 2008; Richlan et al., 2009). Furthermore, the pattern of performance on the discrimination task observed in the Low CPI group is similar to that frequently reported in dyslexia (Bogliotti et al., 2008; Serniclaes, 2001), with better than expected within-category discrimination and weaker than expected across-category discrimination. While it is possible that this simply reflects poorer effort in this group, it is important to note that, unlike the difference in response pattern in P, neither the response pattern in N nor the RTs for P and N significantly differed across the Low and High CPI groups.
The similarities to findings in individuals with dyslexia with regard to both the regions associated with phonemic perception in children in this study and the pattern of performance in the low relative to high categorizers suggest that the current findings may have significant implications for understanding dyslexia. While much attention has focused on phonological awareness and, to a lesser extent, rapid naming as areas of primary core deficits in dyslexia, our findings suggest that differences in the activation patterns in mid-temporal regions seen in poor categorizers at the much earlier processing stage of speech perception are associated with differences in performance on measures of phonological awareness, rapid naming, and reading. Furthermore, the current findings suggest a possible mechanism for the frequent finding of decreased activation in the left pOTS in dyslexia despite the apparent primacy of phonological deficits. Overall, the current results suggest that categorical speech perception and its neural substrates may play a significant role in the development of reading-related abilities and may represent a potential target for intervention for children at risk for dyslexia.
The results of this study may also have relevance for imaging genomics studies of reading. Some of the dyslexia susceptibility genes, such as KIAA0319, have been associated not only with reading disability but also with the full range of reading abilities in the general population (Paracchini et al., 2008), and risk variants involving the KIAA0319/TTRAP/THEM2 locus have been associated with reduced left lateralization in the posterior STS during a reading task in adults identifying themselves as normal readers (Pinel et al., 2012). Furthermore, reduced expression of Kiaa0319 in rats has been associated with impaired neural discrimination of speech sounds (Centanni et al., 2013), and four rare variants in the region between DCDC2 and KIAA0319 have been associated with differences in a late component of the speech mismatch negativity in children with dyslexia (Czamara et al., 2011). The current finding of a relationship between level of categorical perception, reading ability, and pattern of brain activation in temporal and parietal regions in the general population suggests that the latter might represent a useful endophenotype for future imaging genetics studies in children.
Supplementary Material
Highlights.
FMRI was used to examine categorical perception (CP) of speech in children
Activation in left ventral occipitotemporal cortex was associated with level of CP
Lateralization in posterior temporoparietal cortex differed with level of CP
In children with low CP, the level of CP was associated with reading ability
In those with low CP, activation in mid-temporal cortex was associated with reading
Acknowledgments
This work was supported by the National Institute on Deafness and Other Communication Disorders (R01 DC006287 to EL) and the National Institutes of Health General Clinical Research Center (M01 RR00058).
Footnotes
Publisher's Disclaimer: This is a PDF file of an unedited manuscript that has been accepted for publication. As a service to our customers we are providing this early version of the manuscript. The manuscript will undergo copyediting, typesetting, and review of the resulting proof before it is published in its final citable form. Please note that during the production process errors may be discovered which could affect the content, and all legal disclaimers that apply to the journal pertain.
References
- Binder JR, Frost JA, Hammeke TA, Bellgowan PS, Springer JA, Kaufman JN, Possing ET. Human temporal lobe activation by speech and nonspeech sounds. Cereb. Cortex. 2000;10:512–528. doi: 10.1093/cercor/10.5.512. [DOI] [PubMed] [Google Scholar]
- Binder JR, Mohr JP. The topography of callosal reading pathways. A case-control analysis. Brain. 1992;115:1807–1826. doi: 10.1093/brain/115.6.1807. [DOI] [PubMed] [Google Scholar]
- Binder JR, Medler DA, Westbury CF, Liebenthal E, Buchanan L. Tuning of the human left fusiform gyrus to sublexical orthographic structure. NeuroImage. 2006;33:739–748. doi: 10.1016/j.neuroimage.2006.06.053. [DOI] [PMC free article] [PubMed] [Google Scholar]
- Bogliotti C. Relation between categorical perception of speech and reading acquisition. In: Sole MJ, Recasens D, Romero J, editors. Proceedings of the 15th Annual Congress of the International Phonetic Sciences; Barcelona. Futurgraphic; 2003. pp. 885–888. [Google Scholar]
- Bogliotti C, Serniclaes W, Messaoud-Galusi S, Sprenger-Charolles L. Discrimination of speech sounds by children with dyslexia: comparisons with chronological age and reading level controls. J. Exp. Child Psychol. 2008;101:137–155. doi: 10.1016/j.jecp.2008.03.006. [DOI] [PubMed] [Google Scholar]
- Booth JR, Burman DD, Meyer JR, Gitelman DR, Parrish TB, Mesulam MM. Development of brain mechanisms for processing orthographic and phonologic representations. J. Cogn. Neurosci. 2004;16:1234–1249. doi: 10.1162/0898929041920496. [DOI] [PMC free article] [PubMed] [Google Scholar]
- Bowers J, Michita Y. An investigation into the structure and acquisition of orthographic knowledge: Evidence from cross-script Kanji-Hiragana priming. Psychon. Bull. Rev. 1998;5:259–264. [Google Scholar]
- Brechmann A, Scheich H. Hemispheric shifts of sound representation in auditory cortex with conceptual listening. Cereb. Cortex. 2005;15:578–587. doi: 10.1093/cercor/bhh159. [DOI] [PubMed] [Google Scholar]
- Breier JI, Simos PG, Fletcher JM, Castillo EM, Zhang W, Papanicolaou AC. Abnormal activation of temporoparietal language areas during phonetic analysis in children with dyslexia. Neuropsychology. 2003;17:610–621. doi: 10.1037/0894-4105.17.4.610. [DOI] [PubMed] [Google Scholar]
- Burgund ED, Kang HC, Kelly JE, Buckner RL, Snyder AZ, Petersen SE, Schlaggar BL. The feasibility of a common stereotactic space for children and adults in fMRI studies of development. NeuroImage. 2002;17:184–200. doi: 10.1006/nimg.2002.1174. [DOI] [PubMed] [Google Scholar]
- Cai Q, Paulignan Y, Brysbaert M, Ibarrola D, Nazir TA. The left ventral occipitotemporal response to words depends on language lateralization but not on visual familiarity. Cereb. Cortex. 2010;20:1153–1163. doi: 10.1093/cercor/bhp175. [DOI] [PubMed] [Google Scholar]
- Callan DE, Jones JA, Callan AM, Akahane-Yamada R. Phonetic perceptual identification by native- and second-language speakers differentially activates brain regions involved with acoustic phonetic processing and those involved with articulatory-auditory/orosensory internal models. NeuroImage. 2004;22:1182–1194. doi: 10.1016/j.neuroimage.2004.03.006. [DOI] [PubMed] [Google Scholar]
- Centanni TM, Booker AB, Sloan AM, Chen F, Maher BJ, Carraway RS, Khodaparast N, Rennaker R, Loturco JJ, Kilgard MP. Knockdown of the dyslexia-associated gene Kiaa0319 impairs temporal responses to speech stimuli in rat primary auditory cortex. Cereb. Cortex. 2013 doi: 10.1093/cercor/bht028. http://dx.doi.org/10.1093/cercor/bht028. [DOI] [PMC free article] [PubMed] [Google Scholar]
- Cheour M, Ceponiene R, Lehtokoski A, Luuk A, Allik J, Alho K, Näätänen R. Development of language-specific phoneme representations in the infant brain. Nat. Neurosci. 1998;1:351–353. doi: 10.1038/1561. [DOI] [PubMed] [Google Scholar]
- Chevillet MA, Jiang X, Rauschecker JP, Riesenhuber M. Automatic phoneme category selectivity in the dorsal auditory stream. J. Neurosci. 2013;33:5208–5215. doi: 10.1523/JNEUROSCI.1870-12.2013. [DOI] [PMC free article] [PubMed] [Google Scholar]
- Chiappe P, Chiappe DL, Siegel LS. Speech perception, lexicality, and reading skill. J. Exp. Child Psychol. 2001;80:58–74. doi: 10.1006/jecp.2000.2624. [DOI] [PubMed] [Google Scholar]
- Cohen L, Dehaene S, Naccache L, Lehéricy S, Dehaene-Lambertz G, Hénaff MA, Michel F. The visual word form area: spatial and temporal characterization of an initial stage of reading in normal subjects and posterior split-brain patients. Brain. 2000;123:291–307. doi: 10.1093/brain/123.2.291. [DOI] [PubMed] [Google Scholar]
- Cohen L, Martinaud O, Kener C, Lehericy S, Samson Y, Obadia M, Slachevsky A, Dehaene S. Visual Word Recognition in the Left and Right Hemispheres: Anatomical and Functional Correlates of Peripheral Alexias. Cereb. Cortex. 2003;13:1313–1333. doi: 10.1093/cercor/bhg079. [DOI] [PubMed] [Google Scholar]
- Cohen L, Lehéricy S, Chochon F, Lemer C, Rivaud S, Dehaene S. Language-specific tuning of visual cortex? Functional properties of the Visual Word Form Area. Brain. 2002;125:1054–1069. doi: 10.1093/brain/awf094. [DOI] [PubMed] [Google Scholar]
- Cone NE, Burman DD, Bitan T, Bolger DJ, Booth JR. Developmental changes in brain regions involved in phonological and orthographic processing during spoken language processing. NeuroImage. 2008;41:623–635. doi: 10.1016/j.neuroimage.2008.02.055. [DOI] [PMC free article] [PubMed] [Google Scholar]
- Cox RW. AFNI: software for analysis and visualization of functional magnetic resonance neuroimages. Comput. Biomed. Res. 1996;29:162–173. doi: 10.1006/cbmr.1996.0014. [DOI] [PubMed] [Google Scholar]
- Czamara D, Bruder J, Becker J, Bartling J, Hoffmann P, Ludwig KU, Müller-Myhsok B, Schulte-Körne G. Association of a rare variant with mismatch negativity in a region between KIAA0319 and DCDC2 in dyslexia. Behav. Genet. 2011;41:110–9. doi: 10.1007/s10519-010-9413-6. [DOI] [PubMed] [Google Scholar]
- Davis MH, Johnsrude IS. Hierarchical Processing in Spoken Language Comprehension. J. Neurosci. 2003;23:3423–3431. doi: 10.1523/JNEUROSCI.23-08-03423.2003. [DOI] [PMC free article] [PubMed] [Google Scholar]
- Dehaene S, Jobert A, Naccache L, Ciuciu P, Poline J-B, Le Bihan D, Cohen L. Letter binding and invariant recognition of masked words: behavioral and neuroimaging evidence. Psychol. Sci. 2004;15:307–313. doi: 10.1111/j.0956-7976.2004.00674.x. [DOI] [PubMed] [Google Scholar]
- Dehaene S, Naccache L, Cohen L, Bihan DL, Mangin JF, Poline JB, Rivière D. Cerebral mechanisms of word masking and unconscious repetition priming. Nat. Neurosci. 2001;4:752–758. doi: 10.1038/89551. [DOI] [PubMed] [Google Scholar]
- Dehaene-Lambertz G, Dehaene S, Hertz-Pannier L. Functional neuroimaging of speech perception in infants. Science. 2002;298:2013–2015. doi: 10.1126/science.1077066. [DOI] [PubMed] [Google Scholar]
- Dehaene-Lambertz G, Pallier C, Serniclaes W, Sprenger-Charolles L, Jobert A, Dehaene S. Neural correlates of switching from auditory to speech perception. NeuroImage. 2005;24:21–33. doi: 10.1016/j.neuroimage.2004.09.039. [DOI] [PubMed] [Google Scholar]
- Desai R, Liebenthal E, Waldron E, Binder JR. Left posterior temporal regions are sensitive to auditory categorization. J. Cogn. Neurosci. 2008;20:1174–1188. doi: 10.1162/jocn.2008.20081. [DOI] [PMC free article] [PubMed] [Google Scholar]
- Desroches AS, Cone NE, Bolger DJ, Bitan T, Burman DD, Booth JR. Children with reading difficulties show differences in brain regions associated with orthographic processing during spoken language processing. Brain Res. 2010;1356:73–84. doi: 10.1016/j.brainres.2010.07.097. [DOI] [PMC free article] [PubMed] [Google Scholar]
- DeWitt I, Rauschecker JP. Phoneme and word recognition in the auditory ventral stream. Proc. Natl. Acad. Sci. U. S. A. 2012;109:E505–E514. doi: 10.1073/pnas.1113427109. [DOI] [PMC free article] [PubMed] [Google Scholar]
- Edmister WB, Talavage TM, Ledden PJ, Weisskoff RM. Improved auditory cortex imaging using clustered volume acquisitions. Hum. Brain Mapp. 1999;7:89–97. doi: 10.1002/(SICI)1097-0193(1999)7:2<89::AID-HBM2>3.0.CO;2-N. [DOI] [PMC free article] [PubMed] [Google Scholar]
- Eickhoff SB, Stephan KE, Mohlberg H, Grefkes C, Fink GR, Amunts K, Zilles K. A new SPM toolbox for combining probabilistic cytoarchitectonic maps and functional imaging data. NeuroImage. 2005;25:1325–1335. doi: 10.1016/j.neuroimage.2004.12.034. [DOI] [PubMed] [Google Scholar]
- Eimas PD. Auditory and phonetic coding of the cues for speech: discrimination of the [r l] distinction by young infants. Percept. Psychophys. 1975;18:341–347. [Google Scholar]
- Elliott LL, Longinotti C, Meyer D, Raz I, Zucker K. Developmental differences in identifying and discriminating CV syllables. J. Acoust. Soc. Am. 1981;70:669–677. doi: 10.1121/1.386929. [DOI] [PubMed] [Google Scholar]
- Fernández G, De Greiff A, Von Oertzen J, Reuber M, Lun S, Klaver P, Ruhlmann J, Reul J, Elger CE. Language mapping in less than 15 minutes: real-time functional MRI during routine clinical investigation. NeuroImage. 2001;14:585–594. doi: 10.1006/nimg.2001.0854. [DOI] [PubMed] [Google Scholar]
- Gaillard WD, Hertz-Pannier L, Mott SH, Barnett AS, LeBihan D, Theodore WH. Functional anatomy of cognitive development: fMRI of verbal fluency in children and adults. Neurology. 2000;54:180–185. doi: 10.1212/wnl.54.1.180. [DOI] [PubMed] [Google Scholar]
- Gaillard WD, Sachs BC, Whitnah JR, Ahmad Z, Balsamo LM, Petrella JR, Braniecki SH, McKinney CM, Hunter K, Xu B, Grandin CB. Developmental aspects of language processing: fMRI of verbal fluency in children and adults. Hum. Brain Mapp. 2003;18:176–185. doi: 10.1002/hbm.10091. [DOI] [PMC free article] [PubMed] [Google Scholar]
- Geiser E, Zaehle T, Jancke L, Meyer M. The neural correlate of speech rhythm as evidenced by metrical speech processing. J. Cogn. Neurosci. 2008;20:541–552. doi: 10.1162/jocn.2008.20029. [DOI] [PubMed] [Google Scholar]
- Godfrey JJ, Syrdal-Lasky AK, Millay KK, Knox CM. Performance of dyslexic children on speech perception tests. J. Exp. Child Psychol. 1981;32:401–424. doi: 10.1016/0022-0965(81)90105-3. [DOI] [PubMed] [Google Scholar]
- Graves WW, Desai R, Humphries C, Seidenberg MS, Binder JR. Neural systems for reading aloud: a multiparametric approach. Cereb. Cortex. 2010;20:1799–1815. doi: 10.1093/cercor/bhp245. [DOI] [PMC free article] [PubMed] [Google Scholar]
- Guttorm TK, Leppanen PHT, Richardson U, Lyytinen H. Event-related potentials and consonant differentiation in newborns with familial risk for dyslexia. J. Learn. Disabil. 2001;34:534–544. doi: 10.1177/002221940103400606. [DOI] [PubMed] [Google Scholar]
- Guttorm TK, Leppänen PHT, Hämäläinen JA, Eklund KM, Lyytinen HJ. Newborn event-related potentials predict poorer pre-reading skills in children at risk for dyslexia. J. Learn. Disabil. 2010;43:391–401. doi: 10.1177/0022219409345005. [DOI] [PubMed] [Google Scholar]
- Hashimoto R, Sakai KL. Learning letters in adulthood: direct visualization of cortical plasticity for forming a new link between orthography and phonology. Neuron. 2004;42:311–322. doi: 10.1016/s0896-6273(04)00196-5. [DOI] [PubMed] [Google Scholar]
- Hazan V, Barrett S. The development of phonemic categorization in children aged 6-12. J. Phon. 2000;28:377–396. [Google Scholar]
- Hickok G, Poeppel D. The cortical organization of speech processing. Nat. Rev. Neurosci. 2007;8:393–402. doi: 10.1038/nrn2113. [DOI] [PubMed] [Google Scholar]
- Hollingshead AB. Four Factor Index of Social Status. Yale University; New Haven, CT: 1975. Unpublished Manuscript. [Google Scholar]
- Hurford D. Training phonemic segmentation ability with a phonemic discrimination intervention in second-and third-grade children with reading disabilities. J. Learn. Disabil. 1990;23:564–569. doi: 10.1177/002221949002300906. [DOI] [PubMed] [Google Scholar]
- Jansen A, Menke R, Sommer J, Förster AF, Bruchmann S, Hempleman J, Weber B, Knecht S. The assessment of hemispheric lateralization in functional MRI--robustness and reproducibility. NeuroImage. 2006;33:204–217. doi: 10.1016/j.neuroimage.2006.06.019. [DOI] [PubMed] [Google Scholar]
- Kang HC, Burgund ED, Lugar HM, Petersen SE, Schlaggar BL. Comparison of functional activation foci in children and adults using a common stereotactic space. NeuroImage. 2003;19:16–28. doi: 10.1016/s1053-8119(03)00038-7. [DOI] [PubMed] [Google Scholar]
- Kuhl P, Miller J. Speech perception by the chinchilla: voiced-voiceless distinction in alveolar plosive consonants. Science. 1975;190:69–72. doi: 10.1126/science.1166301. [DOI] [PubMed] [Google Scholar]
- Leff AP, Spitsyna G, Plant GT, Wise RJS. Structural anatomy of pure and hemianopic alexia. J. Neurol. Neurosurg. Psychiatr. 2006;77:1004–1007. doi: 10.1136/jnnp.2005.086983. [DOI] [PMC free article] [PubMed] [Google Scholar]
- Leppänen PHT, Hämäläinen JA, Guttorm TK, Eklund KM, Salminen H, Tanskanen A, Torppa M, Puolakanaho A, Richardson U, Pennala R, Lyytinen H. Infant brain responses associated with reading-related skills before school and at school age. Clin. Neurophysiol. 2011;42:35–41. doi: 10.1016/j.neucli.2011.08.005. [DOI] [PubMed] [Google Scholar]
- Leppänen PH, Pihko E, Eklund KM, Lyytinen H. Cortical responses of infants with and without a genetic risk for dyslexia: II. Group effects. Neuroreport. 1999;10:969–973. doi: 10.1097/00001756-199904060-00014. [DOI] [PubMed] [Google Scholar]
- Leppänen PHT, Richardson U, Pihko E, Eklund KM, Guttorm TK, Aro M, Lyytinen H. Brain responses to changes in speech sound durations differ between infants with and without familial risk for dyslexia. Dev. Neuropsychol. 2002;22:407–422. doi: 10.1207/S15326942dn2201_4. [DOI] [PubMed] [Google Scholar]
- Liberman AM, Harris KS, Hoffman HS, Griffith BC. The discrimination of speech sounds within and across phoneme boundaries. J. Exp. Psychol. 1957;54:358–368. doi: 10.1037/h0044417. [DOI] [PubMed] [Google Scholar]
- Lidzba K, Schwilling E, Grodd W, Krägeloh-Mann I, Wilke M. Language comprehension vs. language production: Age effects on fMRI activation. Brain Lang. 2011;119:6–15. doi: 10.1016/j.bandl.2011.02.003. [DOI] [PubMed] [Google Scholar]
- Liebenthal E, Binder JR, Spitzer SM, Possing ET, Medler DA. Neural substrates of phonemic perception. Cereb. Cortex. 2005;15:1621–1631. doi: 10.1093/cercor/bhi040. [DOI] [PubMed] [Google Scholar]
- Liebenthal E, Desai R, Ellingson MM, Ramachandran B, Desai A, Binder JR. Specialization along the left superior temporal sulcus for auditory categorization. Cereb. Cortex. 2010;20:2958–2970. doi: 10.1093/cercor/bhq045. [DOI] [PMC free article] [PubMed] [Google Scholar]
- Liebenthal E, Sabri M, Beardsley S, Mangalathu-Arumana J, Desai A. Neural dynamics of phonological processing in the dorsal auditory stream. J. Neurosci. doi: 10.1523/JNEUROSCI.1511-13.2013. in press. [DOI] [PMC free article] [PubMed] [Google Scholar]
- Lieberman P, Meskill RH, Chatillon M, Schupack H. Phonetic speech perception deficits in dyslexia. J. Speech Hear. Res. 1985;28:480–486. doi: 10.1044/jshr.2804.480. [DOI] [PubMed] [Google Scholar]
- Lyytinen H, Ahonen T, Eklund K, Guttorm T, Kulju P, Laakso ML, Leiwo M, Leppänen P, Lyytinen P, Poikkeus AM, Richardson U, Torppa M, Viholainen H. Early development of children at familial risk for dyslexia--follow-up from birth to school age. Dyslexia. 2004;10:146–178. doi: 10.1002/dys.274. [DOI] [PubMed] [Google Scholar]
- Maassen B, Groenen P. Identification and discrimination of voicing and place-of-articulation in developmental dyslexia. Clin. Linguist. Phon. 2001;15:319–339. [Google Scholar]
- Maisog JM, Einbinder ER, Flowers DL, Turkeltaub PE, Eden GF. A meta-analysis of functional neuroimaging studies of dyslexia. Ann. N. Y. Acad. Sci. 2008;1145:237–259. doi: 10.1196/annals.1416.024. [DOI] [PubMed] [Google Scholar]
- Mano QR, Humphries C, Desai RH, Seidenberg MS, Osmon DC, Stengel BC, Binder JR. The role of left occipitotemporal cortex in reading: Reconciling stimulus, task, and lexicality effects. Cereb. Cortex. 2013;23:988–1001. doi: 10.1093/cercor/bhs093. [DOI] [PMC free article] [PubMed] [Google Scholar]
- McBride-Chang C. Models of speech perception and phonological processing in reading. Child Dev. 1996;67:1836–1856. [PubMed] [Google Scholar]
- Meister IG, Wilson SM, Deblieck C, Wu AD, Iacoboni M. The essential role of premotor cortex in speech perception. Curr. Biol. 2007;17:1692–1696. doi: 10.1016/j.cub.2007.08.064. [DOI] [PMC free article] [PubMed] [Google Scholar]
- Moore DR, Rosenberg JF, Coleman JS. Discrimination training of phonemic contrasts enhances phonological processing in mainstream school children. Brain Lang. 2005;94:72–85. doi: 10.1016/j.bandl.2004.11.009. [DOI] [PubMed] [Google Scholar]
- Myers E, Blumstein S, Walsh E, Eliassen J. Inferior frontal regions underlie the perception of phonetic category invariance. Psycholog. Sci. 2009;20:895–903. doi: 10.1111/j.1467-9280.2009.02380.x. [DOI] [PMC free article] [PubMed] [Google Scholar]
- Obleser J, Zimmermann J, Van Meter J, Rauschecker JP. Multiple stages of auditory speech perception reflected in event-related FMRI. Cereb. Cortex. 2007;17:2251–2257. doi: 10.1093/cercor/bhl133. [DOI] [PubMed] [Google Scholar]
- Okada K, Hickok G. Left posterior auditory-related cortices participate both in speech perception and speech production: Neural overlap revealed by fMRI. Brain Lang. 2006;98:112–117. doi: 10.1016/j.bandl.2006.04.006. [DOI] [PubMed] [Google Scholar]
- Paracchini S, Steer CD, Buckingham L-L, Morris AP, Ring S, Scerri T, Stein J, Pembrey ME, Ragoussis J, Golding J, Monaco AP. Association of the KIAA0319 dyslexia susceptibility gene with reading skills in the general population. Am. J. Psychiatr. 2008;165:1576–1584. doi: 10.1176/appi.ajp.2008.07121872. [DOI] [PubMed] [Google Scholar]
- Pastore RE, Li XF, Layer JK. Categorical perception of nonspeech chirps and bleats. Percept. Psychophys. 1990;48:151–156. doi: 10.3758/bf03207082. [DOI] [PubMed] [Google Scholar]
- Pinel P, Fauchereau F, Moreno A, Barbot A, Lathrop M, Zelenika D, Le Bihan D, Poline J-B, Bourgeron T, Dehaene S. Genetic variants of FOXP2 and KIAA0319/TTRAP/THEM2 locus are associated with altered brain activation in distinct language-related regions. J. Neurosci. 2012;32:817–825. doi: 10.1523/JNEUROSCI.5996-10.2012. [DOI] [PMC free article] [PubMed] [Google Scholar]
- Pisoni DB. Identification and discrimination of the relative onset time of two component tones: implications for voicing perception in stops. J. Acoust. Soc. Am. 1977;61:1352–1361. doi: 10.1121/1.381409. [DOI] [PubMed] [Google Scholar]
- Polk TA, Farah MJ. Functional MRI evidence for an abstract, not perceptual, word-form area. J. Exp. Psychol. Gen. 2002;131:65–72. doi: 10.1037//0096-3445.131.1.65. [DOI] [PubMed] [Google Scholar]
- Richardson U, Leppänen PHT, Leiwo M, Lyytinen H. Speech perception of infants with high familial risk for dyslexia differ at the age of 6 months. Dev. Neuropsychol. 2003;23:385–397. doi: 10.1207/S15326942DN2303_5. [DOI] [PubMed] [Google Scholar]
- Richlan F, Kronbichler M, Wimmer H. Functional abnormalities in the dyslexic brain: a quantitative meta-analysis of neuroimaging studies. Hum. Brain Mapp. 2009;30:3299–3308. doi: 10.1002/hbm.20752. [DOI] [PMC free article] [PubMed] [Google Scholar]
- Richlan F, Kronbichler M, Wimmer H. Structural abnormalities in the dyslexic brain: A meta-analysis of voxel-based morphometry studies. Hum. Brain Mapp. 2012 doi: 10.1002/hbm.22127. http://dx.doi.org/10.1002/hbm.22127. [DOI] [PMC free article] [PubMed] [Google Scholar]
- Scott SK, Blank CC, Rosen S, Wise RJ. Identification of a pathway for intelligible speech in the left temporal lobe. Brain. 2000;123:2400–2406. doi: 10.1093/brain/123.12.2400. [DOI] [PMC free article] [PubMed] [Google Scholar]
- Seghier ML. Laterality index in functional MRI: methodological issues. Magn. Reson. Imaging. 2008;26:594–601. doi: 10.1016/j.mri.2007.10.010. [DOI] [PMC free article] [PubMed] [Google Scholar]
- Serniclaes W. Perceptual discrimination of speech sounds in developmental dyslexia. J. Speech Lang. Hear. Res. 2001;44:384–399. doi: 10.1044/1092-4388(2001/032). [DOI] [PubMed] [Google Scholar]
- Springer JA, Binder JR, Hammeke TA, Swanson SJ, Frost JA, Bellgowan PSF, Brewer CC, Perry HM, Morris GL, Mueller WM. Language dominance in neurologically normal and epilepsy subjects: A functional MRI study. Brain. 1999;122:2033–2046. doi: 10.1093/brain/122.11.2033. [DOI] [PubMed] [Google Scholar]
- Szaflarski JP, Holland SK, Schmithorst VJ, Byars AW. FMRI study of language lateralization in children and adults. Hum. Brain Mapp. 2006;27:202–212. doi: 10.1002/hbm.20177. [DOI] [PMC free article] [PubMed] [Google Scholar]
- Talairach J, Tournoux P. Co-Planar Stereotaxic Atlas of the Human Brain: 3-Dimensional Proportional System : An Approach to Cerebral Imaging. Thieme; New York: 1988. [Google Scholar]
- Tatsuno Y, Sakai KL. Language-related activations in the left prefrontal regions are differentially modulated by age, proficiency, and task demands. J. Neurosci. 2005;25:1637–1644. doi: 10.1523/JNEUROSCI.3978-04.2005. [DOI] [PMC free article] [PubMed] [Google Scholar]
- Thomson JM, Goswami U. Rhythmic processing in children with developmental dyslexia: auditory and motor rhythms link to reading and spelling. J. Physiol. (Paris) 2008;102:120–129. doi: 10.1016/j.jphysparis.2008.03.007. [DOI] [PubMed] [Google Scholar]
- Turkeltaub PE, Coslett HB. Localization of sublexical speech perception components. Brain Lang. 2010;114:1–15. doi: 10.1016/j.bandl.2010.03.008. [DOI] [PMC free article] [PubMed] [Google Scholar]
- Wagner RK, Torgesen JK, Rashotte CI. The Comprehensive Test of Phonological Processing. Pro-Ed; Austin: 1999. [Google Scholar]
- Wechsler D. Wechsler Abbreviated Scale of Intelligence. The Psychological Corporation; San Antonio: 1999. [Google Scholar]
- Werker JF, Tees RC. Phonemic and phonetic factors in adult cross-language speech perception. J. Acoust. Soc. Am. 1984;75:1866–1878. doi: 10.1121/1.390988. [DOI] [PubMed] [Google Scholar]
- Wilkinson GS. Wide Range Achievement Test - Third Edition. Wide Range, Inc.; Wilmington, DE: 1993. [Google Scholar]
Associated Data
This section collects any data citations, data availability statements, or supplementary materials included in this article.