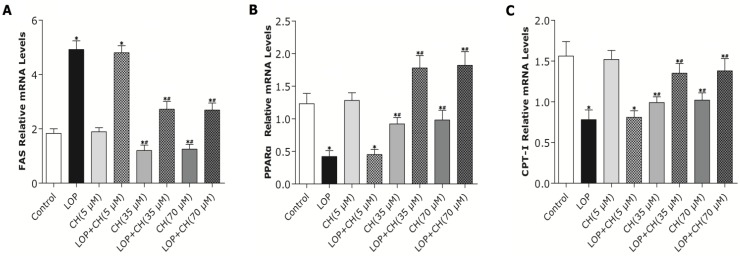
Figure 4.
The effects of LOP and choline on mRNA expression of FAS, PPARα and CPT-I genes. C3A cells were cultured in MEME with or without LOP and choline (5, 35, 70 μM) treatment for 72 h. (A–C) The mRNA expression of FAS, PPARα and CPT-I genes was determined by a fast, real-time PCR system. CH, choline; LOP, lactate (10 mM), octanoate (2 mM) and pyruvate (1 mM). Values represent the mean ± SD of three independent experiments performed in duplicate. * p < 0.05 vs. control. # p < 0.05 vs. LOP.

