

Abstract
Background:
Low birth weight (LBW) is an important risk factor for childhood morbidity and mortality, consequently an important public health concern.
Aim:
This study aims to identify significant socio-economic and nutritional determinants associated with LBW in India.
Materials and Methods:
Data from 2005 to 2006 National Family Health Survey-3 (NFHS-3) of India was analyzed. A total of 20,946 women (15-49 years) who gave birth at least once 5 years preceding the NFHS-3 were included in this study. Infant's LBW (<2500 grams) as outcome variable was examined in association with all independent predictors as infant's sex, maternal household wealth status, caste, age, education, body mass index (BMI), stature, anemia level, parity, inter-pregnancy interval, antenatal care received, and living place.
Results:
Almost 20% of the infants were born with LBW. Mother's low education level, BMI <18.5, short stature (height <145 centimeters) and lack of antenatal visits (<4 visits) were significant predictors of LBW. Male gender has a protective effect against LBW.
Conclusion:
Maternal education, nutritional status and antenatal care received are key determinants that need to be addressed to reduce prevalence of LBW in India. Continue implementation of multifaceted health promotion interventions are needed to address these factors effectively.
Keywords: Child's birth weight, Infant, India, Low birth weight, Pregnancy
Introduction
Low birth weight (LBW) is an important determinant of childhood morbidity and mortality.[1,2] Child's birth weight is a significant factor which determines vulnerability for risk of childhood illnesses and childhood survival. Consequently, children who are born with weight less than 2.5 kg are vulnerable for dying during their early childhood.[2,3] Moreover, research highlight strong associations between LBW and increased risk of infections, malnutrition, poor academic performance and problems related to mental, behavior and learning difficulties during childhood.[3,4] Consequences of LBW trek into adulthood and can cause range of chronic diseases, e.g., ischemic heart disease, stroke, hypertension, diabetes, metabolic syndrome, malignancies, dementia, and osteoarthritis.[3,5]
Low-income countries account for majority share of LBW. Half of the children with a LBW were born in South Asia and among these countries India and Bangladesh has the highest prevalence of LBW (30%).[6] Consequently, strategies to reduce prevalence of LBW is important in order to achieve the forth Millennium Development Goals (MDG 4)-reduce child mortality.[6]
Contributing factors for LBW are multifaceted and include factors such as maternal age, poor maternal nutritional status, and non-pregnant weight, gestational age, intervals between pregnancies, parity, educational status, violence during pregnancy, lack of antenatal care (ANC) and very low socio-economic status.[7,8,9,10] In India, low body mass index (BMI), short stature, anemia and/or other micronutrient deficiencies are known to increase the risk of giving birth to a baby with LBW.[9,10] For example, low BMI is a reliable indicator for protein-energy malnutrition, which affects fetal growth during pregnancy.[11] The nutritional status of a pregnant woman can be affected by many factors including low socio-economic status, higher parity and short inter-pregnancy interval.[10] Women with low socio-economic status are more likely to have inadequate food intake, unhygienic housing and lack of sanitation, reduced ability to seek medical care and purchase medicine/supplements, which then affects the birth weight of their infants.[10,12] The incidences of placenta previa and malpresentation increases with high parity and these complications may predispose a women to give birth to an infant with LBW.[13] An association between short (<18 months) and long (>59 months) inter-pregnancy intervals and LBW was highlighted in literatures.[14,15,16] Maternal nutrient stores may deplete as a result of short inter-pregnancy intervals thus may reduce the birth weight of an infant.[15]
There is a strong association between lack of ANC and adverse pregnancy outcomes.[8,17] Antenatal Clinics are an essential element of the health services provided during pregnancy. These clinics provide services such as screening, prevention, and treatment of pregnancy-related complications. The World Health Organization (WHO) recommends at least four standard quality antenatal care visits comprising interventions such as tetanus toxoid vaccination, screening and treatment for infections, and identification of warning signs during pregnancy.[18]
Evidence highlighting determinants of LBW are discussed above, but most studies were conducted in specific settings, e.g., rural or hospital-based studies.[8,9] Study populations were relatively small and/or major determinants of LBW across a country may not have taken into account in some of these studies. Therefore, current study aims to address these methodological issues by including a large population across India and inclusion of multifaceted risk factors known to influence LBW. Accordingly, this study aims to investigate the association between maternal socio-economic status, nutritional status, and use of ANC and risk of LBW in India. Findings may benefit to highlight key modifiable risk factors and implement multifaceted health promotion interventions to reduce to prevalence of LBW.
Materials and Methods
Study area and population
Data from the 2005-2006 National Family Health Survey-3 (NFHS-3) was used.[19] Data was collected from a representative sample of households across 29 states across India, including 109,041 households with 124,385 women aged between 15 and 49 years and 74,369 men aged between 15 and 54 years. The NFHS-3 study population represented 99% of India's population in 2005-2006. Main objective of this large-scale multi-round survey was to provide state and national-level estimates of fertility, mortality, family planning, adolescent reproductive health, higher-risk sexual behavior, HIV-related knowledge and important aspects of nutrition, health, and use of healthcare services.
Sample selection
Women who were married at the time of survey and in reproductive age (15-49 years) with at least one childbirth during 5 years preceding NFHS-3 were included in this study. Birth weights for 20,946 infants (34%) were recorded in the NFHS-3 dataset by extracting information from a health card, written record or from mother's self-reported data (recall). Therefore, 20,946 infants with complete information on birth weight were included in the data analysis.
Socio-demographic, anthropometric and nutritional variables
A set of theoretically relevant and well established risk factors for LBW was adapted for the analysis.[8,10] Major factors such as socio-demographic, anthropometric, nutritional status, and health service received during pregnancy (discussed below) were included in the analysis.
Birth weight
Birth weights were recorded in the NFHS-3 questionnaire for births during the 5 years preceding the survey either from a written record or a health card (if they are available). If not, by asking mothers to recall their child's birth weight. Birth weights were recorded for 34% of the infants (n = 20,946) with complete gestational age (>37 weeks). In India, over 50% of deliveries occur at home and often newborns are not weighed at birth (NFHS-3).
According to the WHO's classification of LBW, birth weight <2500.0 g was classified as LBW.[6] The NFHS-3 data was coded using this criterion into “LBW” and “normal weight” categories.
Socio-economic status and caste/tribe
Household socio-economic status was measured using a validated assessment of household assets. Every household was assigned a standardized score for each asset depending on whether or not the household owned that asset. Sum of the scores of all assets in a household was used to generate the household's wealth index score which were categorized into five socio-economic quintiles and given a rank from one (poorest) to five (richest) used in NFHS-3, as discussed elsewhere.[19] They were further categorized as poor, middle class, and better off in the present study. The caste woman was classified as “scheduled caste”, “scheduled tribe”, “other backward class”, and “none (general caste)”. This classification of caste focuses more on the socially disadvantaged castes, and all privileged caste groups are coded in the “general caste” group.
Antenatal care (ANC) visits
WHO recommends minimum of four antenatal visits for a woman with normal pregnancy.[18] Therefore, women were categorized into to two groups, “<4 visits” and “≥4 visits”
Anthropometric, nutritional and other variables
The height and weight of women were measured using a solar-powered electronic (SECA) scale with a digital screen. These SECA scales were designed and manufactured under the guidance of the United Nations Children's Fund (UNICEF). A cutoff point of 145 centimeters (cm) was used to define short stature as per NFHS-3.[19] Body mass index was calculated using the standard formula-Weight (kg)/Height2 (m2)[20] The cut-off point of BMI <18.5 was set as underweight as per WHO.[20]
The NFHS-3 performed blood tests to obtain hemoglobin levels of the women survey participants. Then the hemoglobin levels of these women were adjusted for altitude, smoking, and pregnancy by the NFHS-3 team using CDC formulas and then categorized into severe, moderate, mild and not anemic groups.[21] For the purpose of this study, these categories were recoded into “moderate to severe”, “mild” and “not anemic”. BMI, stature and level of anemia were used as proxy to measure maternal nutritional status.
Age of mother was coded into “<20 years”, “20-35 years”, and “>35 years” based on findings from previous studies. For example, women aged <20 years[22] and women delaying their first pregnancy beyond 35 years[23] were at increased risk for giving birth to babies with LBW.
Maternal education was measured in years of schooling and categorized into “no education”, “primary education” (1-5 years), “secondary education”, (6-12 years), and “higher education” (more than 12 years). Parity was categorized into “first birth” (nulliparous), “parity 2-4” (multiparous) and “parity ≥5” (grand-and great grand multiparous).[24] An association between short (<18 months) and long (>59 months) inter-pregnancy intervals and LBW was highlighted in many studies.[14,15,16] Therefore, inter-pregnancy intervals were coded into “<18 months”, “18-59 months” and “>59 months”. Place of residence was grouped into “urban” and “rural”.
Statistical analysis
Associations between socio-economic status, nutritional predictors and low birth weight of infants were analyzed by bivariate analysis using Pearson's Chi-square tests. All the significant predictors (P < 0.05) from Pearson's Chi-square tests were further analyzed using binary logistic regression models to establish associations between all independent predictors and the outcome variable (LBW). In the first instance, binary logistic regression models were used to obtain unadjusted odds ratios (OR) between each predictor and LBW separately. Then all variables were entered into the final model to establish adjusted OR for these variables and LBW. The OR with 95% confidence intervals (CI) was computed to estimate the association between variables. All P-values reported were based on two-tailed comparisons and the level of significance set at 0.05. All statistical analyses were performed using Statistical Package of Social Sciences (SPSS), Version 21.0 (IBM SPSS Inc., Somer, NY).
Ethical considerations
The survey received ethical permission from the Institutional Review Board of Opinion Research Corporation (ORC), Macro International Incorporated. Informed consent was obtained from the participants prior to interview, and the right to withdraw was emphasized throughout the survey.
Results
The mean age the women were 25.9 ± 4.9 years, height 151.8 ± 5.8 cm, parity 2.7 ± 1.14 and the mean BMI was 21.3 ± 4.5. The average birth weight of the infants was 2844 ± 683 g and 20.3% of the infants were born with LBW.
Table 1 represents basic characteristics of the participants by two groups; 1) women with infants who were normal birth weight (NBW) (≥2500 g) and 2) women with infants who were LBW (<2500 g). Pearson's Chi-square tests identified differences between the maternal socio-economic and nutritional status in both groups. Child's sex, maternal wealth status, caste/tribe, age, education, BMI, stature, level of anemia, inter- pregnancy interval, antenatal visits and level of urbanization were significantly associated with LBW of infants (P < 0.05). Association between LBW and parity was statistically insignificant.
Table 1.
Basic characteristics of the women by normal birth weight-NBW (≥2500 g) and low birth weight-LBW (<2500 g)
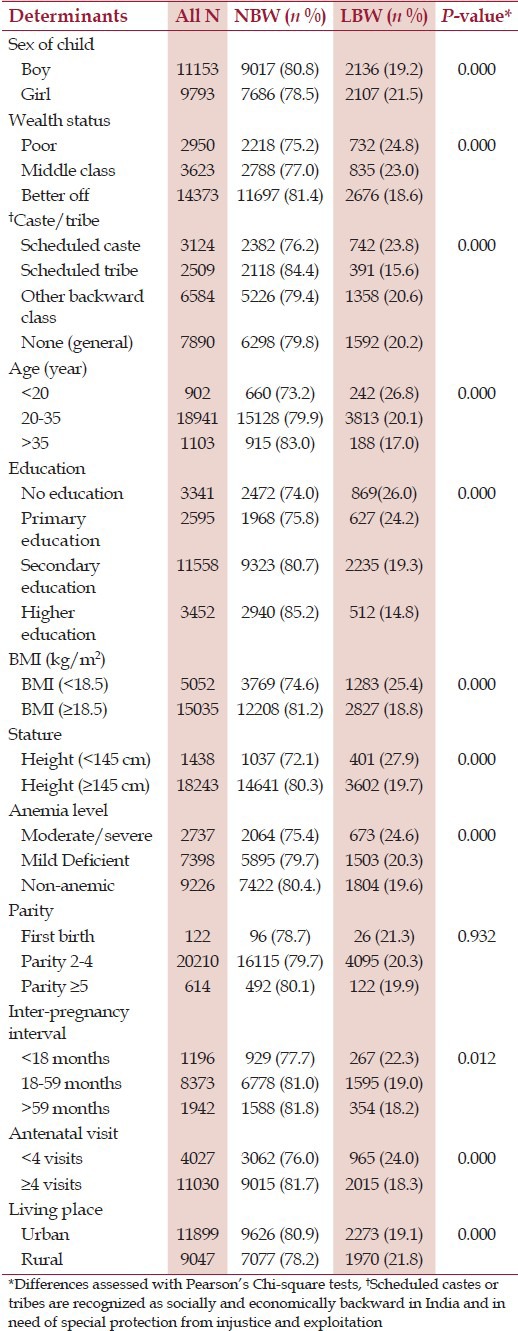
Table 2 shows adjusted and unadjusted OR for LBW (in logistic regression models). After adjusting for all of the variables included in the study (adjusted model); infant's sex, women's education, BMI, stature, and antenatal visits were statistically significant. The adjusted OR for women with “no education” had the largest effect in explaining the prevalence of LBW (OR = 1.87; 95% CI: 1.48-2.37, P < 0.001). Women with “primary education” had 62% higher odds of giving birth to an infant with LBW (OR = 1.62, CI: 1.27-2.06, P < 0.001) than women with “higher education”.
Table 2.
Logistic regression for adjusted and unadjusted odds ratio (OR) of low birth weight (LBW)
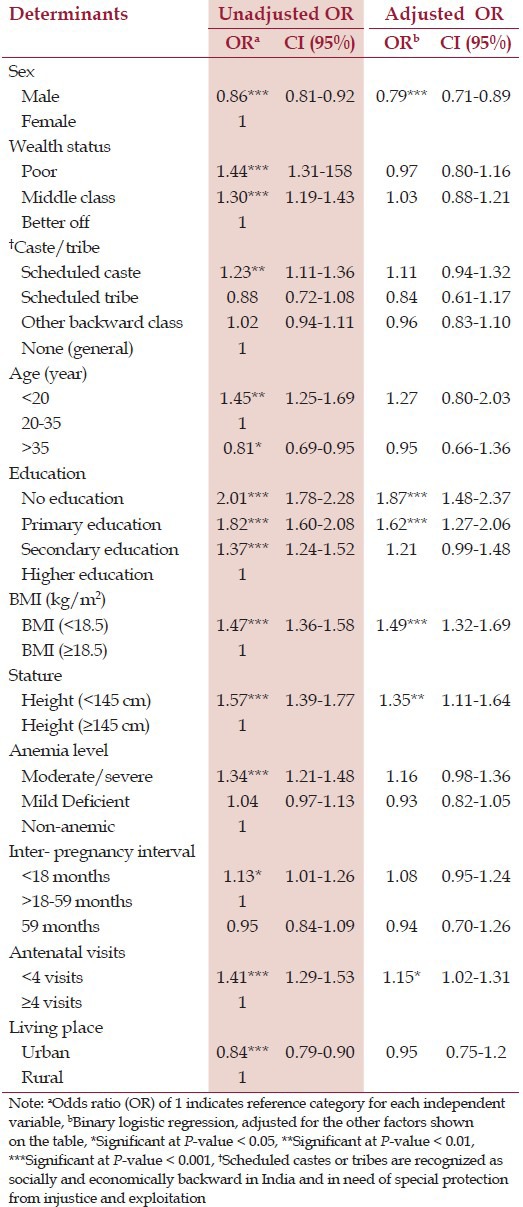
If a women's BMI was <18.5, then the odds of having LBW infants was 49% higher (OR = 1.49, 95% 1.32-1.69, P < 0.001) than the women with BMI >18.5. Women who have a shorter stature (height <145 cm) were 35% more likely to give birth of an infant with LBW (OR = 1.35, 95% CI: 1.11-1.64, P < 0.01). Moreover, fewer than four ANC visits was associated with LBW (OR = 1.15, CI: 1.02-1.31, P < 0.05) and being a male infant was found to be protective of LBW (OR = 0.79, CI: 0.71-0.89, P < 0.001).
In the unadjusted model, maternal age <20 years, having moderate to severe anemia, shorter inter-pregnancy interval (<18 months), ‘poor’ and ‘middle-class’ socio-economic status, “scheduled caste” and living in urban area were significant risk factors for giving birth to an infant with LBW. However, in the adjusted model, influences of these factors greatly attenuated and statistically insignificant.
Discussion
Maternal education, BMI <18.5, short stature (height <145 cm) and lack of antenatal visits (<4 visits) are significant predictors of LBW. In agreement with previous studies, maternal education emerged as a strong determinant for LBW. Women with ‘no education’ had the greatest odds of giving birth to an infant with LBW followed by women with “primary education”.[9,25] Agreeing with previous studies, birth weight of the bay is greatly influenced by mother's level of education and having some kind of maternal education (oppose to no education) have a protective effect against LBW.[9,25] It is likely that women with no or low level of education and/or knowledge may practice poor health habits (e.g., smoking, drug or substance uses, etc.). Additionally they may be very poor and lacks access to adequate healthcare resources (e.g., antenatal care, iron supplements, etc.) which consequently may influence fetal growth. Therefore, interventions to improve the education level of women and female children are important to reduce prevalence LBW in India.
Women with poor nutritional status, reflected in low BMI (<18.5) had 49% higher odds of having LBW infants. These findings are in agreement with previous studies where low pre-pregnancy BMI was significantly associated with LBW of an infant.[11,26] Low maternal BMI is a marker for marginal tissue nutrient reserves and a predictor of protein-energy malnutrition, which may affect fetal growth.[11,27]
The risk estimates for having an infant with LBW was significantly elevated for women with short stature (height <145 cm). Height of a mother is an outcome of several factors including nutrition during her childhood and adolescence. Targeted public health interventions to improve nutrition status of women in childbearing age as well as female children are imperative to reduce prevalence of LBW in India. The cut-off point for height below which a woman can be identified as nutritionally at risk varies across populations and ethnic origins. For example, previously identified cut-off points were 145 cm in India,[28] 155 cm in United Kingdom,[29] 156 cm in Sudan,[12] and 165 cm in Israel.[30]
This study found a strong association between lack of antenatal care and low birth weight and the results are in agreement with previous studies.[17,25] Antenatal care provide routine monitoring of height and weight gain, identification of medical maternal or fetal problems, counseling against tobacco or substance use, provide psychosocial support, nutritional advice, and early intervention which may reduction adverse pregnancy outcomes including LBW.[18] Lack of access to ANC could be influenced by many factors including lower socio-economic status and poor knowledge. Therefore, utilization of ANC should be further investigated to understand obstacles and opportunities to improve services.
Low socio-economic status is one of the strongest predictors of LBW in low-income countries.[10,12,28] In contrast to previous findings, low socio-economic status was not significantly associated with LBW in this study. Perhaps in spite of poor socio-economic status if a woman could maintain a good nutritional status and avoid potential medical complications during pregnancy, giving birth to a normal weight baby might be a possibility.
Short inter-pregnancy intervals may result in depletion of maternal nutrient stores and lead to reduced birth weight.[15] However, significant association between short inter-pregnancy intervals and LBW was not evident in this study. Perhaps it is logical to assume that if a woman regain her nutritional status before conception of another fetus, even in a short period it may possible to have a normal weight baby.
No statistically significant differences were evident for birth weight in children born to anemic women. A meta-analysis of 10 studies by Xiong et al. (2000) reported similar findings,[31] and a plausible explanation could be that anemia due to physiological fall in hemoglobin levels during late pregnancy may due to normal plasma volume expansions.[32,33] Some studies found that pregnant women with large plasma volumes have given birth to babies with higher birth weight than average.[34,35] In fact, Higgins et al. (1982) reported an inverse association between birth weight and hemoglobin levels during late pregnancy (P < 0.01). Birth weights of the newborns were significantly larger in anemic women (3424 ± 454 g) compared with non-anemic women (3338 ± 485 g).[34] The relationship between maternal hemoglobin level and birth weight was established in many studies and hemoglobin was identified as an important biomarker contributing to birth weight.[7,28,36] In this study, information is lacking to ascertain when the hemoglobin levels were measured (e.g., during early or late pregnancy). Thus, it is not possible to draw any conclusion in relation to anemia level and LBW. Relationship between anemia and LBW seems to be complex and further investigations are needed to investigate associations between anemia and LBW in India.
This study found that male gender has a protective effect against LBW. The biological mechanism by which the sex of the fetus influences birth weight is not clear. On average, the weight of a male infant is 150 g greater than that of a female infant and this difference in weight starts to appear after 28 weeks of gestation. It is hypothesized that the activity of androgen causes difference in maternal fetal antigen, or genetic material on the Y chromosome carrying genetic material for fetal growth.[37]
Strengths and limitations
One major strength of this study is the large sample size. Data from the NFHS 3, 2005-2006 represented whole of India and findings can be generalized for the Indian subcontinent. Women with missing information relating to birth weight of their infants were found to be equally spread in across variables such as socio-economic status, education, and geographical location; thus, minimal selection bias in the study sample. Use of mother's self-reported data (recall) should be notes as one of the limitations. The prevalence of LBW was higher in the National Family Health Survey-2 (NFHS-2), 1998-1999, where birth weights were recalled from memory rather than reported from a health card.[38]
Conclusions
Maternal socio-economic status, nutritional status and antenatal are received were identified in this study as important determinants of LBW in India. These key mediating factors that need to be considered to improve birth weight of infants and targeted public health interventions are needed to improve these factors.
Footnotes
Source of Support: Nil.
Conflict of Interest: None declared.
References
- 1.Lawn JE, Cousens S, Zupan J. Lancet Neonatal Survival Steering Team. 4 million neonatal deaths: When? Where? Why? Lancet. 2005;365:891–900. doi: 10.1016/S0140-6736(05)71048-5. [DOI] [PubMed] [Google Scholar]
- 2.Alexander GR, Wingate MS, Bader D, Kogan MD. The increasing racial disparity in infant mortality rates: Composition and contributors to recent US trends. (e1-9).Am J Obstet Gynecol. 2008;198:51. doi: 10.1016/j.ajog.2007.06.006. [DOI] [PubMed] [Google Scholar]
- 3.Berkowitz GS, Papiernik E. Epidemiology of preterm birth. Epidemiol Rev. 1993;15:414–43. doi: 10.1093/oxfordjournals.epirev.a036128. [DOI] [PubMed] [Google Scholar]
- 4.Dunin-Wasowicz D, Rowecka-Trzebicka K, Milewska-Bobula B, Kassur-Siemienska B, Bauer A, Idzik M, et al. Risk factors for cerebral palsy in very low-birthweight infants in the 1980s and 1990s. J Child Neurol. 2000;15:417–20. doi: 10.1177/088307380001500612. [DOI] [PubMed] [Google Scholar]
- 5.Barker DJ, Forsen T, Uutela A, Osmond C, Eriksson JG. Size at birth and resilience to effects of poor living conditions in adult life: Longitudinal study. BMJ. 2001;323:1273–6. doi: 10.1136/bmj.323.7324.1273. [DOI] [PMC free article] [PubMed] [Google Scholar]
- 6.Low birth weight: Country, regional and global estimates. New York: UNICEF; 2004. United Nations Children's Fund and World Health Organization. [Google Scholar]
- 7.Hosain GM, Chatterjee N, Begum A, Saha SC. Factors associated with low birthweight in rural Bangladesh. J Trop Pediatr. 2006;52:87–91. doi: 10.1093/tropej/fmi066. [DOI] [PubMed] [Google Scholar]
- 8.Valero De Bernabe J, Soriano T, Albaladejo R, Juarranz M, Calle ME, Martinez D, et al. Risk factors for low birth weight: A review. Eur J Obstet Gynecol Reprod Biol. 2004;116:3–15. doi: 10.1016/j.ejogrb.2004.03.007. [DOI] [PubMed] [Google Scholar]
- 9.Som S, Jr, Pal M, Adak DK, Gharami AK, Bharati S, Bharati P. Effect of socio-economic and biological variables on birth weight in Madhya Pradesh. Malays J Nutr. 2004;10:159–71. [PubMed] [Google Scholar]
- 10.Ohlsson A, Shah P. Edmonton: Institute of Health Economics (IHE); 2008. Determinants and prevention of low birth weight: A synopsis of the evidence. [Google Scholar]
- 11.Schieve LA, Cogswell ME, Scanlon KS, Perry G, Ferre C, Blackmore-Prince C, et al. The NMIHS Collaborative Study Group. Prepregnancy body mass index and pregnancy weight gain: Associations with preterm delivery. Obstet Gynecol. 2000;96:194–200. doi: 10.1016/s0029-7844(00)00883-8. [DOI] [PubMed] [Google Scholar]
- 12.Elshibly EM, Schmalisch G. The effect of maternal anthropometric characteristics and social factors on gestational age and birth weight in Sudanese newborn infants. BMC Public Health. 2008;8:244. doi: 10.1186/1471-2458-8-244. [DOI] [PMC free article] [PubMed] [Google Scholar]
- 13.Aliyu MH, Jolly PE, Ehiri JE, Salihu HM. High parity and adverse birth outcomes: Exploring the maze. Birth. 2005;32:45–59. doi: 10.1111/j.0730-7659.2005.00344.x. [DOI] [PubMed] [Google Scholar]
- 14.Conde-Agudelo A, Rosas-Bermudez A, Kafury-Goeta AC. Birth spacing and risk of adverse perinatal outcomes: A meta-analysis. JAMA. 2006;295:1809–23. doi: 10.1001/jama.295.15.1809. [DOI] [PubMed] [Google Scholar]
- 15.Zhu BP, Rolfs RT, Nangle BE, Horan JM. Effect of the interval between pregnancies on perinatal outcomes. N Engl J Med. 1999;340:589–94. doi: 10.1056/NEJM199902253400801. [DOI] [PubMed] [Google Scholar]
- 16.Zhu BP, Haines KM, Le T, McGrath-Miller K, Boulton ML. Effect of the interval between pregnancies on perinatal outcomes among white and black women. Am J Obstet Gynecol. 2001;185:1403–10. doi: 10.1067/mob.2001.118307. [DOI] [PubMed] [Google Scholar]
- 17.Coria-soto IL, Bobadilla JL, Notzon F. The effectiveness of antenatal care in preventing intrauterine growth retardation and low birth weight due to preterm delivery. Int J Qual Health Care. 1996;8:13–20. doi: 10.1093/intqhc/8.1.13. [DOI] [PubMed] [Google Scholar]
- 18.World Health Organization [WHO] Geneva: 1994. Technical Working Group on Antenatal Care. [Google Scholar]
- 19.National Family Health Survey (NFHS-3) 2005-06: India. I. Mumbai: IIPS; 2007. International Institute for Population Sciences (IIPS) and Macro International. [Google Scholar]
- 20.Physical status: The use and interpretation of anthropometry. Report of a WHO Expert Committee. World Health Organ Tech Rep Ser. 1995;854:1–452. [PubMed] [Google Scholar]
- 21.Recommendations to Prevent and Control Iron Deficiency in the United States. Centers for Disease Control and Prevention. MMWR Recomm Rep. 1998;47:1–29. [PubMed] [Google Scholar]
- 22.Slap GB, Schwartz JS. Risk factors for low birth weight to adolescent mothers. J Adolesc Health Care. 1989;10:267–74. doi: 10.1016/0197-0070(89)90056-9. [DOI] [PubMed] [Google Scholar]
- 23.Yang Q, Greenland S, Flanders WD. Associations of maternal age- and parity-related factors with trends in low-birthweight rates: United States, 1980 through 2000. Am J Public Health. 2006;96:856–61. doi: 10.2105/AJPH.2004.049312. [DOI] [PMC free article] [PubMed] [Google Scholar]
- 24.Shah PS. Knowledge Synthesis Group on Determinants of LBW/PT births. Parity and low birth weight and preterm birth: A systematic review and meta-analyses. Acta Obstet Gynecol Scand. 2010;89:862–75. doi: 10.3109/00016349.2010.486827. [DOI] [PubMed] [Google Scholar]
- 25.Khatun S, Rahman M. Socio-economic determinants of low birth weight in Bangladesh: A multivariate approach. Bangladesh Med Res Counc Bull. 2008;34:81–6. doi: 10.3329/bmrcb.v34i3.1857. [DOI] [PubMed] [Google Scholar]
- 26.Frederick IO, Williams MA, Sales AE, Martin DP, Killien M. Pre-pregnancy body mass index, gestational weight gain, and other maternal characteristics in relation to infant birth weight. Matern Child Health J. 2008;12:557–67. doi: 10.1007/s10995-007-0276-2. [DOI] [PubMed] [Google Scholar]
- 27.Neggers Y, Goldenberg RL. Some thoughts on body mass index, micronutrient intakes and pregnancy outcome. J Nutr. 2003;133:1737–40s. doi: 10.1093/jn/133.5.1737S. [DOI] [PubMed] [Google Scholar]
- 28.Mumbare SS, Maindarkar G, Darade R, Yenge S, Tolani MK, Patole K. Maternal risk factors associated with term low birth weight neonates: A matched-pair case control study. Indian Pediatr. 2012;49:25–8. doi: 10.1007/s13312-012-0010-z. [DOI] [PubMed] [Google Scholar]
- 29.Prasad M, Al-Taher H. Maternal height and labour outcome. J Obstet Gynaecol. 2002;22:513–5. doi: 10.1080/0144361021000003654. [DOI] [PubMed] [Google Scholar]
- 30.Blumenfeld Z, Lowenstein L, Brook O, Gonen R, Ophir E, Samueloff A. Does maternal height affect triplets’ birth weight? Med Sci Monit. 2006;12:CR40–3. [PubMed] [Google Scholar]
- 31.Xiong X, Buekens P, Alexander S, Demianczuk N, Wollast E. Anemia during pregnancy and birth outcome: A meta-analysis. Am J Perinatol. 2000;17:137–46. doi: 10.1055/s-2000-9508. [DOI] [PubMed] [Google Scholar]
- 32.Hytten F. Blood volume changes in normal pregnancy. Clin Haematol. 1985;14:601–12. [PubMed] [Google Scholar]
- 33.Suitor CW. Perspectives on nutrition during pregnancy: Part I, Weight gain; Part II, Nutrient supplements. J Am Diet Assoc. 1991;91:96–8. [PubMed] [Google Scholar]
- 34.Higgins AC, Pencharz PB, Strawbridge JE, Maughan GB, Moxley JE. Maternal haemoglobin changes and their relationship to infant birth weight in mothers receiving a program of nutritional assessment and rehabilitation. Nutr Res. 1982;2:641–9. [Google Scholar]
- 35.Gibson HM. Plasma volume and glomerular filtration rate in pregnancy and their relation to differences in fetal growth. J Obstet Gynaecol Br Commonw. 1973;80:1067–74. doi: 10.1111/j.1471-0528.1973.tb02981.x. [DOI] [PubMed] [Google Scholar]
- 36.Hirve SS, Ganatra BR. Determinants of low birth weight: A community based prospective cohort study. Indian Pediatr. 1994;31:1221–5. [PubMed] [Google Scholar]
- 37.Amory JH, Adams KM, Lin MT, Hansen JA, Eschenbach DA, Hitti J. Adverse outcomes after preterm labor are associated with tumor necrosis factor-alpha polymorphism -863, but not -308, in mother-infant pairs. Am J Obstet Gynecol. 2004;191:1362–7. doi: 10.1016/j.ajog.2004.05.067. [DOI] [PubMed] [Google Scholar]
- 38.Channon AA, Padmadas SS, McDonald JW. Measuring birth weight in developing countries: Does the method of reporting in retrospective surveys matter? Matern Child Health J. 2011;15:12–8. doi: 10.1007/s10995-009-0553-3. [DOI] [PubMed] [Google Scholar]