

Abstract
Hypothalamic proopiomelanocortin (POMC) neurons have traditionally been defined by their peptide transmitters, which are important regulators of energy balance and reward. Recent work shows that POMC neurons can also release the amino acid transmitters γ-aminobutyric acid (GABA) and glutamate, although studying GABAergic and glutamatergic populations of POMC neurons has been hindered by the difficulty in reliably identifying amino acid (AA) transmitter phenotypes. In the present study, fluorescent in situ hybridization and immunohistochemistry were used to identify POMC neurons and to detect the presence of mRNA for the transporters responsible for packaging either GABA (vesicular GABA transporter [vGAT]) or glutamate (vesicular glutamate transporter [vGLUT]) into vesicles, as well as the enzymes responsible for GABA synthesis, glutamic acid decarboxylase (GAD)65 and GAD67. Approximately 7% of POMC neurons expressed vGlut2 and the highest percentage of vGlut2-positive POMC cells were located in the rostral arcuate nucleus. Despite the reports of GABA release from POMC neurons, vGat was not detected in POMC neurons, although Gad65 and Gad67 were present in ~40% of POMC neurons. Approximately half of the vGlut2-expressing POMC cells also expressed Gad65. Markers of neurotransmitter phenotype were better detected by using in situ hybridization techniques rather than transgenic expression of fluorophores under the control of the vGat or Gad67 promoters. It is now clear that the expression of markers of AA phenotype provides a useful means to identify distinct subpopulations of POMC neurons. Additionally, the method described will be useful to explore the possibility that plasticity of AA phenotype is an important aspect of POMC neuron function.
INDEXING TERMS: GAD67, GAD65, vGLUT2, in situ hybridization
Proopiomelanocortin (POMC) neurons in the arcuate nucleus of the hypothalamus regulate aspects of feeding behavior and reward, making them an important target for eating disorders and addiction therapies (Coll, 2007; Roth-Deri et al., 2008). These neurons have traditionally been defined by their expression of the Pomc gene and the presence of the peptides that it encodes, including α-melanocyte–stimulating hormone (α-MSH) and the endogenous opioid β-endorphin. There is growing evidence, however, that subpopulations of POMC neurons are also capable of releasing the amino acids (AA) glutamate and γ-aminobutyric acid (GABA) (Collin et al., 2003; Hentges et al., 2004, 2009), although a comprehensive study to characterize these subpopulations has not previously been undertaken.
The possibility that POMC neurons may release glutamate as a cotransmitter was originally suggested when the vesicular glutamate transporter vGLUT2 was detected in POMC neurons (Collin et al., 2003), which appeared to lack the inhibitory transmitter GABA (Ovesjo et al., 2001). However, another study indicated that POMC neurons release GABA, express mRNA for the GABA synthetic enzyme glutamic acid decarboxylase (GAD)67, and display immunoreactivity for GABA and the vesicular GABA transporter, vGAT (Hentges et al., 2004) indicating a GABAergic phenotype. Subsequently, it was shown that one portion of murine POMC neurons can release GABA and another portion can release glutamate when the cells are maintained in primary culture (Hentges et al., 2009).
To determine the roles of GABAergic and glutamatergic POMC neurons, it is necessary to be able to reliably identify these subpopulations. Traditionally, protein markers indicative of AA phenotype are used to identify GABAergic and glutamatergic cells because GABA and glutamate are not as amenable to detection as enzymes and transporters. To date, there are conflicting reports of AA marker expression in POMC neurons. The discrepancies may arise from the use of a variety of detection methods and reliance on transgenically expressed reporters. The present study was undertaken to identify markers that can be used to reliably detect GABAergic and glutamatergic subpopulations of POMC neurons, which will allow for detailed studies of these POMC neuron subpopulations. Furthermore, the development of in vivo approaches to address the function of AA transmitters in POMC neurons requires a thorough understanding of the markers expressed in these cells. By using fluorescent in situ hybridization for AA phenotype markers, the present results show that ~40% of POMC neurons express Gad65 and −67 mRNA, ~7% express vGlut2 mRNA, and a small population of POMC neurons expresses mRNA for both Gad65 and vGlut2. The highest percentage of vGlut2-expressing POMC cells occurs in the rostral arcuate nucleus. The data also indicate that vGat is not a reliable marker of the GABAergic nature of POMC neurons.
MATERIALS AND METHODS
Animals
A total of 26 8–12-week-old male mice were used for all experiments. GAD67-green fluorescent protein (GFP) knock-in mice (Tamamaki et al., 2003; originally supplied by Dr. Yuchio Yanagawa, Gunma University, Kiryu, Japan), mice expressing enhanced green fluorescent protein (EGFP) in vGAT neurons (Gong et al., 2003; supplied by the Mutant Mouse Regional Resource Center; Tg(Slc32a1-EGFP) EN128Gsat/Mmcd), and mice expressing either EGFP (Cowley et al., 2001; Jackson Laboratory [Bar Harbor, ME] stock #009593) or discosoma red (DsRed; Hentges et al., 2009; supplied by Dr. Malcolm J. Low, University of Michigan, Ann Arbor, MI) in POMC neurons were maintained on the C57BL/6J genetic background (Jackson Laboratory). POMC-DsRed mice were crossed with GAD67-GFP mice to create transgenic mice with double-labeled POMC and GAD67-expressing cells as previously described (Hentges et al., 2009). All mice were given standard chow and tap water ad libitum and housed under controlled temperatures (22–24°C) at a constant 12-hour light/dark cycle. All animal protocols were approved by the Institutional Animal Care and Use Committee at Colorado State University and were in accordance with the United States Public Health Service guidelines for animal use.
Tissue preparation
For tissue collection, mice were deeply anesthetized with sodium pentobarbital and transcardially perfused with a 10% sucrose solution, followed by 4% paraformaldehyde in phosphate-buffered saline (PBS; pH 7.4). Brains were postfixed overnight at 4°C in 4% paraformaldehyde solution in PBS. Then 50-μm sections containing the arcuate nucleus were cut on a Vibratome, collected in cold PBS, and either mounted on slides or processed for in situ hybridization.
Probes for fluorescent in situ hybridization
Antisense and sense RNA probes were synthesized by using T3, SP6, or T7 RNA polymerase in the presence of dNTPs containing digoxigenin (DIG) or fluorescein isothiocyanate (FITC)-labeled UTPs (Roche Applied Sciences, Indianapolis, IN). Template DNA was digested for 30 minutes with DNAse I, and probes were ethanol-precipitated by using lithium chloride and glycogen. Then 70% ethanol was used to wash the RNA before it was resuspended in diethylpyrocarbonate (DEPC)-treated water, and probes were stored at −80°C. All of the probe sequences were made from mouse cDNA and have 100% homology with the appropriate mRNA unless otherwise noted. Specific probe information can be found in Table 1.
TABLE 1.
Probe Information1
| Gene | Probe concentration | Hybridization temperature(°C) | Accession ID no. | Probe position (bp) |
|---|---|---|---|---|
| Pomc | 750 pg/μl | 70 | NM_008895.3 | 532–1,007 |
| Gad67 | 150 pg/μl | 60 | NM_008077.4 | 749–1,527 |
| Gad65 (628 bp) | 150 pg/μl | 52 | NM_008078.2 | 537–1,207 |
| Gad65 (824 bp) | 150 pg/μl | 52 | NM_008078.2 | 1,201–2,032 |
| vGat | 1 ng/μl | 70 | NM_009508.2 | 1,321–1,713 |
| vGlut2 | 1 ng/μl | 70 | NM_080853.3 | 1,854–2,440 |
| vGlut1 | 250 pg/μl | 70 | NM_182993.2 | 714–1,320 |
RNA probes corresponding to each gene were used at the specified concentration, and the hybridization reaction took place at the temperatures listed. The accession ID for the Genbank database is provided for each probe sequence, as well as the corresponding base pairs the probes binds to on the mRNA sequence.
The plasmid containing the Pomc probe was a gift from Dr. Malcolm J. Low (University of Michigan, Ann Arbor, MI). Plasmids containing vGlut2 and vGlut1 were kindly provided by Klas Kullander (Uppsala University, Uppsala, Sweden). Two Gad65 probes corresponding to different sections of the Gad65 gene were run simultaneously to maximize the sensitivity of detection of the mRNA. Plasmids containing these probes were provided by Sandra L. Petersen (University of Massachusetts, Amherst, MA). These sequences were originally made from rats, but have a 96 and 97% homology with mouse cDNA. The vGat probe containing plasmid was kindly provided by Tomomi Shimogori (Riken Institute, Saitama, Japan). To detect Gad67, a probe corresponding to a portion of human Gad67 cDNA was inserted into pBluescriptII SK(+/−). The plasmid containing the full Gad67 cDNA was provided by Macdonald J. Christie (Brain and Mind Research Institute, University of Sidney, Australia). This sequence has 92% homology with mouse cDNA. Sense probes were used to establish specificity of antisense probes.
Antibody characterization
The patterns revealed by antibody detection of DIG and FITC for in situ hybridization were unique to each gene target, and matched previous reports. The chicken anti-GFP antibody recognizes a single band on western blot of around 27–30 kDa, whereas no band was apparent in a wild-type control (technical information provided by the manufacturer). The antibody also selectively labeled GFP-positive cells in lamina II of the spinal cord of transgenic mice (technical information provided by the manufacturer). Control tissue from a wild-type mouse lacking GFP revealed an absence of staining with the antibody in the present study (data not shown). Specific antibody information is provided in Table 2.
TABLE 2.
Antibodies Used in This Study
| Antibody | Animal | Antigen | Manufacturer and cat. no. |
|---|---|---|---|
| GFP | Chicken, polyclonal | Recombinant full-length GFP | Abcam Ab13970 |
| Digoxigenin conjugated to alkaline phosphatase | Sheep, polyclonal | Roche Applied Sciences 11093274910 | |
| Fluorescein conjugated to POD (horseradish peroxidase) | Sheep, polyclonal | Roche Applied Sciences 11426346910 | |
| Donkey anti-chicken IgY (IgG) (H+L) DyLight 649 | Jackson ImmunoResearch 703-495-155 | ||
| Streptavidin, Alexa Fluor 488 conjugate | Invitrogen S-32354 |
Fluorescent in situ hybridization
Brains were typically divided into three series, and each series was processed for different mRNA. The protocol for in situ hybridization was adapted from previous investigations (Leupen et al., 2003; de Souza et al., 2005; Watakabe et al., 2010). Free-floating sections were incubated for 15 minutes in 6% H2O2 to quench endogenous peroxidases, washed two times for 5 minutes in PBS containing 0.1% Tween 20 (PBT), digested for 15 minutes with proteinase K (10 μg/ml), and then incubated for 10 minutes in 2 mg/ml glycine. All solutions were made up in PBT. After two additional washes for 10 minutes in PBT, sections were postfixed for 20 minutes in a 4% paraformaldehyde/0.2% gluteraldehyde solution, washed, and then dehydrated in ascending ethanol dilutions made with DEPC-treated water (50, 70, 95, and 100%). Tissue was prehybridized for 1 hour at 60°C in hybridization buffer (66% [v/v] deionized formamide, 13% [w/v] dextran sulfate, 260 mM NaCl, 1.3X Denhardt’s solution, 13 mM Tris-HCl, pH 8.0, 1.3 mM EDTA, pH 8.0). Probes were denatured at 85°C for 5 minutes before being added to the hybridization buffer, along with tRNA and dithiothreitol (DTT) for a final concentration of 0.5 mg/ml tRNA and 10 mM DTT. Tissue was hybridized for 18–20 hours. The appropriate concentration and hybridization temperature for each probe was empirically determined based on characteristic staining with each probe and a lack of staining in areas of the brain previously reported to be devoid of that mRNA.
After six 30-minute stringency washes at 60°C, three in 50% formamide/5X SSC, and the subsequent three in 50% formamide/2X SSC, sections underwent a 30-minute digestion with RNAse A (20 μg/ml in 0.5 M NaCl, 10 mM Tris-HCl, pH 8.0, 1 mM EDTA) at 37°C before being washed three times for 15 minutes in TNT (0.1 M Tris-HCl, pH 7.5, 0.15, M NaCl, 0.05% Tween-20) and blocked for 1 hour in TNB (TNT plus 0.5% Blocking Reagent provided in the TSA kit; Perkin Elmer, Oak Brook, IL). Tissue was then incubated overnight at 4°C in either a horseradish peroxidase-conjugated sheep anti-FITC antibody (1:1,000; Roche Applied Sciences) or sheep anti-DIG conjugated to alkaline phosphatase (AP; 1:1,000; Roche Applied Sciences). FITC was visualized by using a TSA PLUS Biotin Kit (Perkin Elmer). After three 15-minute TNT washes, the sections were incubated for 30 minutes in a 1:50 dilution of the Biotin Amplification Reagent working solution (prepared following the manufacturer’s instructions), and then washed again before incubation for 30 minutes in 1:600 streptavidin conjugated to Alexa-Fluor 488 (Invitrogen, Carlsbad, CA). The DIG-labeled probes were detected by using an HNPP Fluorescent Detection Kit (Roche).
Briefly, sections were equilibrated for 10 minutes in detection buffer (100 mM Tris-HCl, 100 mM NaCl, 10 mM MgCl2, pH 8.0) before incubation for 1 hour in HNPP/Fast Red TR mix prepared according to the manufacturer’s instructions. Each well of tissue was ordered, mounted in PBS with 100 mM EDTA, and coverslipped by using cc/mount (Sigma, St. Louis, MO). Mounting the tissue quickly was critical, because the HNPP signal diffuses with time. Slides were stored frozen in order to prolong the HNPP signal (Watakabe et al., 2010).
Dual fluorescent in situ hybridization and immunodetection of GFP
Dual fluorescent in situ hybridization was carried out as described above with the following modifications. When using probes that hybridize at the same temperature (Pomc and vGlut2, vGlut1, or vGat), the probes were added simultaneously and hybridized for 18–20 hours at 70°C. However, the Gad65 and Gad67 probes hybridize at a different temperature (52 and 60°C, respectively), so a sequential hybridization was performed. The probe that hybridized at the higher temperature was hybridized first for 20 hours before the tissue was transferred to new hybridization buffer containing the second probe, whereupon the tissue was hybridized for an additional 20 hours at the lower temperature (see Table 3 for specific combinations of probes). Antigenicity of POMC peptides and DsRed did not survive the hybridization conditions; thus GFP transgenic animals were used for triple detection (Table 3). Although GFP fluorescence was quenched by the in situ hybridization procedure, the antigenicity was maintained. Therefore, after stringency washes, tissue was incubated at 4°C in a cocktail of primary antibodies made up in TNB. This included the anti-FITC POD and anti-DIG AP antibodies, as well as a chicken-anti-GFP antibody at 4°C (1:2,000; Abcam, Boston, MA) to detect GFP when using the transgenic animals. GFP was visualized first by incubating tissue for 2 hours at room temperature in donkey anti-chicken antibody conjugated to DyLight 649 (1:400; Jackson ImmunoResearch, West Grove, PA). FITC was detected next by using the TSA Biotin Kit, and DIG-labeled probes were always visualized last by using the HNPP Fluorescent Detection Kit as described above.
TABLE 3.
Summary of Experiments1
| Mouse phenotype | Hybridized first | Hybridized second | Method of visualization |
|---|---|---|---|
| GAD67–GFP | Pomc-DIG | n/a | IHC (dαck-649) + HNPP |
| vGAT-EGFP | Pomc-DIG + vGat-FITC | n/a | IHC (dαck-649) + TSA Biotin Plus kit (SA-488) + HNPP |
| vGAT-EGFP | Gad67-FITC | n/a | IHC (dαck-649) + TSA Biotin Plus kit (SA-488) |
| POMC–EGFP | vGlut2-FITC | Gad65-DIG | IHC (dαck-649) + TSA Biotin Plus kit (SA-488) + HNPP |
| POMC–EGFP | Gad67-FITC | n/a | IHC (dαck-649) + TSA Biotin Plus kit (SA-488) |
| Wild type | vGlut1-DIG | n/a | HNPP |
Probes labeled with either digoxigenin (DIG) or fluorescein (FITC) were hybridized individually, at the same time, or sequentially. The target mRNA is listed alongside the phenotype of the animals used for each experiment, as well as a brief summary of the immunological methods used to detect each marker (GFP, DIG, or FITC). IHC, immunohistochemistry.
Imaging
Images were taken with a Zeiss 510-Meta laser-scanning confocal microscope. Green fluorescence (Alexa-Fluor 488) was imaged by using a 488/543-nm bandpass filter, and emission was detected by using a 505/530-nm bandpass filter. HNPP was imaged by using a 488/543-nm bandpass excitation filter and a 585/615-nm bandpass emission filter, and antibody-conjugated DyLight 649 was imaged by using a 514/633-nm bandpass excitation filter and a 650-nm longpass emission filter. Images at each wavelength were taken sequentially to avoid crossover between channels. Z-stack images were taken every 3 μm, for a total of 15 μms, from all of the tissue containing POMC neurons within a series of tissue (typically five to six tissue sections representing the rostral-caudal extent of the arcuate nucleus). Images were collected beginning with the most rostral slice containing POMC neurons (~Bregma −1.2 mm) through the most caudal slice containing POMC neurons (~Bregma −2.3). Images to be used for figures were pseudo-colored by using the LSM Image Browser software (Carl Zeiss, Thornwood, NY), and then adjusted for brightness and contrast by using Photoshop (Adobe Systems, San Jose, CA).
Cell counts and analysis
A modification of the 3D counting method (Williams and Rakic, 1988) was employed to estimate cell numbers. A “counting box” was defined as a 300 × 300-μm box on the x–y plane, with a z-axis depth of 15 μm. Only cells completely within the counting box or with a clear nucleus were counted, as this provided enough of the cell body to look for colabeling. LSM Image Browser software was used to move through the z-stacks and to identify and mark cells. Cells that contained multiple labels (e.g., green and red fluorescence) in more than one section in the z-stack were defined as colabeled cells, or if a clear nucleus was apparent in both colors. Marked images were then exported into Adobe Photoshop CS4, in which the markings were counted manually by using the “count tool.” Although the counting method employed may result in some oversampling, applying corrections to accommodate for this does not alter the percentage of the cells that coexpress the various markers. Given that the number and density of POMC neurons change significantly throughout the rostral–caudal extent of the arcuate nucleus, reporting coexpression as a percentage of POMC cells is more representative than providing absolute numbers. The number of POMC cells counted is provided in Table 4, however, to illustrate the sample size.
TABLE 4.
Percentage of Pomc Cells With Glutamatergic or GABAergic Markers1
| % of POMC neurons | No. of animals | Total POMC cells counted/animal | |
|---|---|---|---|
| vGlut2 mRNA | 7.36 ± 1.21 | 7 | 263 ± 25.50 |
| Gad65 mRNA | 44.66 ± 2.76 | 7 | 263 ± 25.50 |
| Gad67 mRNA | 37.99 ± 1.03 | 3 | 407.67 ± 88.10 |
| vGlut2 + Gad65 mRNA | 3.55 ± 0.56 | 7 | 263 ± 25.50 |
| vGat mRNA | 3.77 ± 0.10 | 2 | 200 ± 45 |
| vGAT–EGFP | 0.42 ± 0.30 | 4 | 257 ± 51.10 |
| GAD67–GFP | 10.53 ± 1.33 | 3 | 208.33 ± 28.42 |
The percentage of GABAergic and/or glutamatergic markers present in POMC cells with SEM, as well as the label used to detect each marker (mRNA or the fluorescent reporter, EGFP/GFP). The number of animals used in each experiment is provided, as well as the average number of cells counted per animal per experiment with SEM.
RESULTS
Specificity of probes
Seven different probes were used to detect markers of GABAergic and glutamatergic phenotypes in POMC neurons (Table 1). The most effective order of probe binding and the optimal visualization methods were empirically determined and are outlined in Table 2. Probe concentrations and detection protocols were optimized to ensure specificity and are roughly equal intensity of signal for each of the detected mRNAs. Probe specificity was indicated by the lack of signal in regions of the brain previously shown to lack the mRNA of interest, and by the lack of sense probe binding (Fig. 1).
Figure 1.
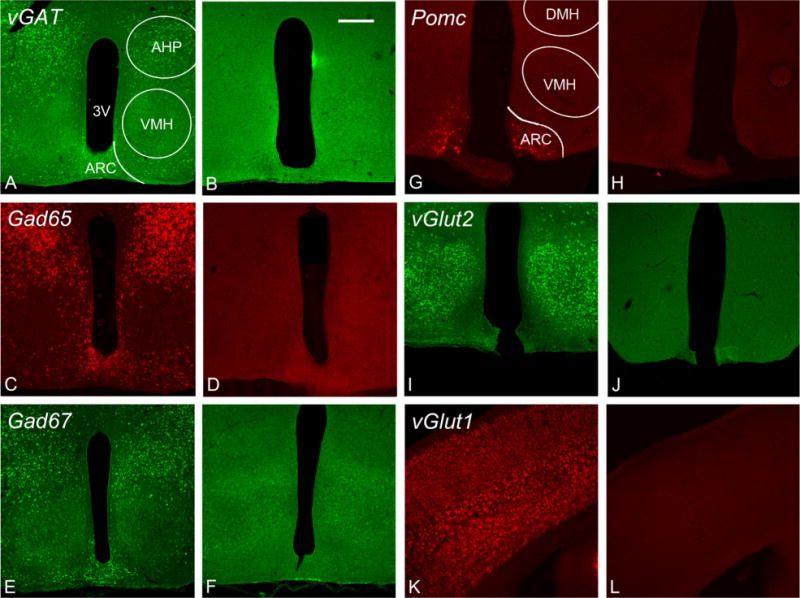
Specificity of probe binding. A–L: Tissue was treated with antisense and sense probes to control for nonspecific labeling of the probe. vGat (A), Gad65 (C), and Gad67 (E) labeling is shown in the rostral arcuate where the ventromedial hypothalamus (VMH) is apparent. The VMH contains primarily glutamatergic cells, so the lack of GABAergic markers in this nucleus is characteristic. Labeling can be seen in the arcuate nucleus and the anterior hypothalamic area (AHP). Pomc expression was present exclusively in the arcuate nucleus with robust labeling in the center of the nucleus (G). The vGlut2 probe displayed strong labeling in the VMH (I), with scattered cells throughout the arcuate nucleus. vGlut1 was not present in the arcuate nucleus. An image from cortex with strong vGlut1 labeling is shown (K). There was no labeling above background with any of the sense probes (B,D,F,H,J,L). AHP, anterior hypothalamic area (posterior); ARC, arcuate nucleus; 3V, third ventricle; DMH, dorsal medial hypothalamus; VMH, ventral medial hypothalamus. (A magenta–green version of this figure is included as a supplementary file for the assistance of color-blind authors.) Scale bar = 200 μm in B (applies to A–L).
Glutamatergic POMC neurons
Signal for vGlut2 was present throughout the brain as previously described (Fremeau et al., 2001), including strong expression in the ventromedial hypothalamus (VMH; Fig. 1G) and various nuclei throughout the thalamus (data not shown). vGlut2-positive cells detected within the arcuate nucleus appeared fainter than those in the VMH (Fig. 2A, lower and upper portion of images, respectively), suggesting that these cells may express lower levels of the mRNA. vGlut2-positive cells not expressing POMC-EGFP were scattered throughout the arcuate nucleus. Overall, the density of vGlut2-expressing cells was much lower in the arcuate nucleus compared with the VMH (Figs. 1G, 2). The retrochiasmatic arcuate and most rostral regions of the arcuate nucleus contained a higher percentage of POMC cells expressing vGlut2 than more caudal areas (Fig. 2B,C; 30.7 ± 12.2%, P < 0.01 by one-way ANOVA, n = 7) such that the majority of vGlut2-positive POMC neurons occurred within ~ 100 μm of the most rostral POMC neurons (~Bregma −1.2–1.3 mm). Within the rostral arcuate nucleus, the vGlut2-expressing POMC neurons appeared to be evenly distributed in the dorsal-ventral and medial-lateral planes. Of the total POMC-EGFP neurons present in the arcuate, 7.4 ± 1.2% (n = 7) were found to express vGlut2 (Table 4).
Figure 2.
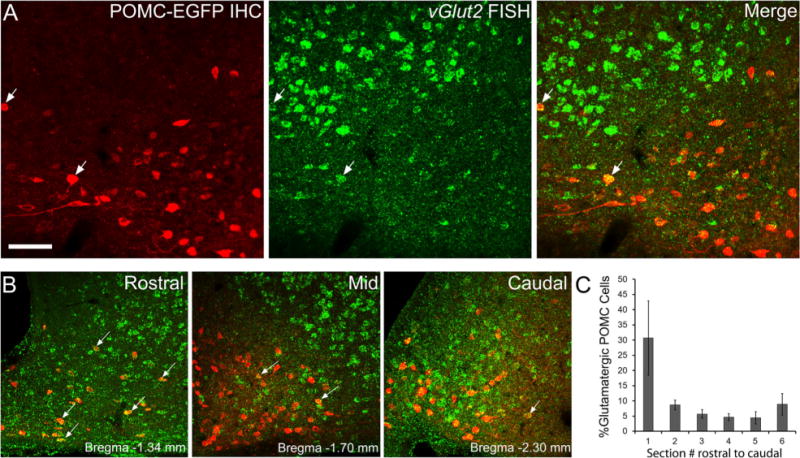
vGlut2 mRNA in POMC neurons. A,B: Example images of immunohistochemistry for POMC-EGFP (red) and fluorescent in situ hybridization for vGlut2 using an FITC-labeled probe and TSA-Biotin detection (green). Only a small portion of POMC-EGFP neurons expressed vGlut2 (A, white arrows). vGlut2-positive neurons lacking POMC-EGFP expression (A, right panel, green cells) and POMC-EGFP neurons without vGlut2 (A, right panel, red cells) are also present. Representative images of rostral (B, left panel), mid (B, center panel), and caudal (B, right panel) areas of the arcuate nucleus in coronal sections show vGlut2 present in POMC-EGFP neurons (white arrows), particularly in the rostral arcuate. 3V, third ventricle. C: Graph depicting the percentage of POMC-EGFP cells expressing vGlut2 throughout the rostral to caudal extent of the arcuate nucleus (n = 7). (A magenta–green version of this figure is included as a supplementary file for the assistance of color-blind authors.) Scale bar = 50 μm in A (applies to A,B).
No vGlut1 expression was detected in POMC neurons or in any other cells in the arcuate nucleus, although labeling was detected in the cortex (Fig. 1K), the lateral and basolateral amygdaloid nuclei, and to a lesser extent in various thalamic nuclei, as has been previously reported (Fremeau et al., 2001; Poulin et al., 2008).
GABAergic POMC neurons
Strong Gad65 and Gad67 expression was apparent throughout the brain, including the arcuate nucleus, reticular thalamic nucleus, and several amygdaloid complexes, as previously described (Esclapez et al., 1993; Ovesjo et al., 2001; Poulin et al., 2008). Gad expression was not detected in areas that have previously been shown to lack GABAergic neurons, including the VMH (Fig. 1E,I; Esclapez et al., 1993). Of POMC-EGFP neurons located in the arcuate nucleus, 44.7 ± 2.8% expressed Gad65 mRNA (Fig. 3, n = 7), and 38 ± 1% of POMC neurons expressed Gad67 (Fig. 3B, n = 3). Gad-positive cells without POMC expression were observed, consistent with the many other GABAergic cell types present within the arcuate nucleus. The percentage of Gad65 or −67-positive POMC neurons was fairly uniform throughout the rostral two-thirds of the arcuate nucleus, whereas fewer POMC cells in the caudal portion of the arcuate nucleus expressed Gad65 or −67 (Fig. 3C,D, P < 0.01 by one-way ANOVA). The Gad65 probe was used to label putative GABAergic neurons in the majority of later double- and triple-labeling experiments because this probe gave more robust and distinct labeling than the Gad67 probe.
Figure 3.
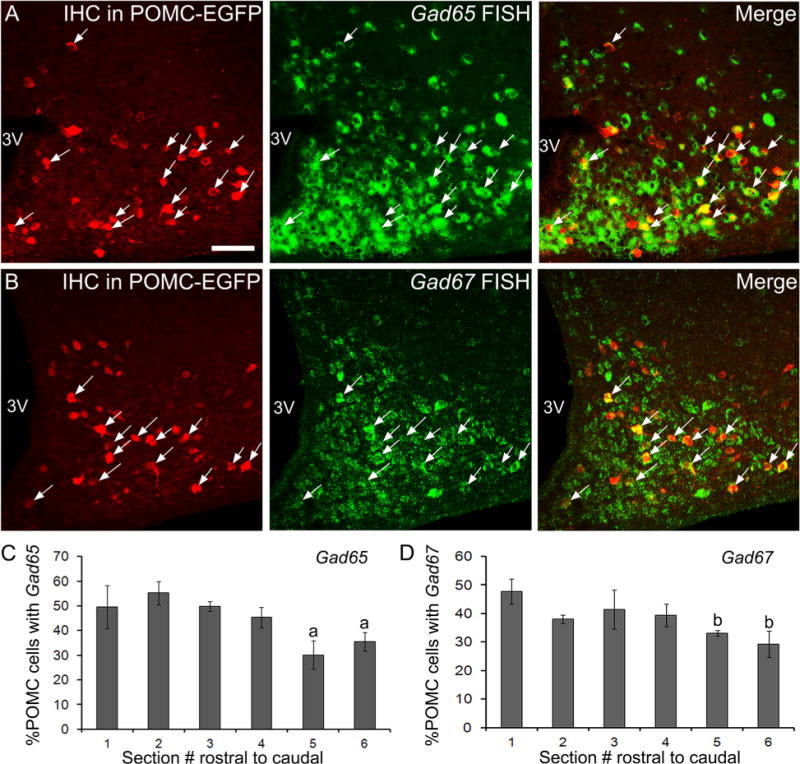
Gad65 and −67 mRNA in POMC neurons. A,B: Example images of POMC–EGFP detected by immunohistochemistry (A,B, red) and fluorescent in situ hybridization for Gad65 using a DIG-labeled probe and HNPP detection (A, green) or Gad67 using an FITC-labeled probe and TSA-Biotin detection (B, green). POMC–EGFP cells with (white arrows, yellow cells in right panels) and without Gad label, as well as Gad-positive cells lacking POMC–EGFP (green cells in right panels) can be seen. C,D: The percentage of POMC cells expressing Gad65 (C, n = 7) and Gad67 (D, n = 3) throughout the arcuate nucleus is depicted in the bar graphs. Error bars represent the SEM. a, significantly different from sections 1–4; b. significantly different from section 1. 3V, third ventricle. (A magenta–green version of this figure is included as a supplementary file for the assistance of color-blind authors.) Scale bar = 50 μm in A (applies to A,B).
The expression of vGat in POMC neurons was examined because this vesicular transporter is also considered an indicator of the GABAergic phenotype (McIntire et al., 1997). In situ hybridization revealed vGat mRNA in a very low percentage of Pomc-containing neurons even at saturating probe concentrations (3.7 and 3.9% in the two brains counted; Fig. 4A). The lack of detectable vGat mRNA in POMC neurons is not likely to reflect low efficiency of the probe labeling because the signal is readily detected in many brain regions (Fig. 1A) and in non-POMC cells within the arcuate nucleus (Fig. 4A). In situ hybridization for Pomc was also carried out in tissue from mice expressing EGFP under the control of the vGat promoter. Immunodetection of EGFP revealed that less than 1% of Pomc neurons in the transgenic mice (0.4 ± 0.3%, n = 4) expressed vGAT–EGFP (Fig. 4B). The number of cells in the arcuate nucleus labeled with EGFP in the vGAT–EGFP transgenic mouse appeared to be less than the number of cells with detectable – mRNA (Fig. 4A,B, center panels), suggesting that the vGAT–EGFP transgene does not label all cells that produce vGat mRNA. All of the cells expressing the vGAT–EGFP label also expressed mRNA for Gad67, although there were many cells with Gad67 expression that were not vGAT–EGFP positive (Fig. 4C), suggesting that vGAT is not as strongly expressed in the arcuate nucleus as Gad67. The near lack of vGAT–EGFP label in POMC neurons is consistent with the lack of detectable mRNA for vGat in POMC neurons, further suggesting that POMC cells either lack vGAT or express the mRNA for vGAT at very low levels.
Figure 4.
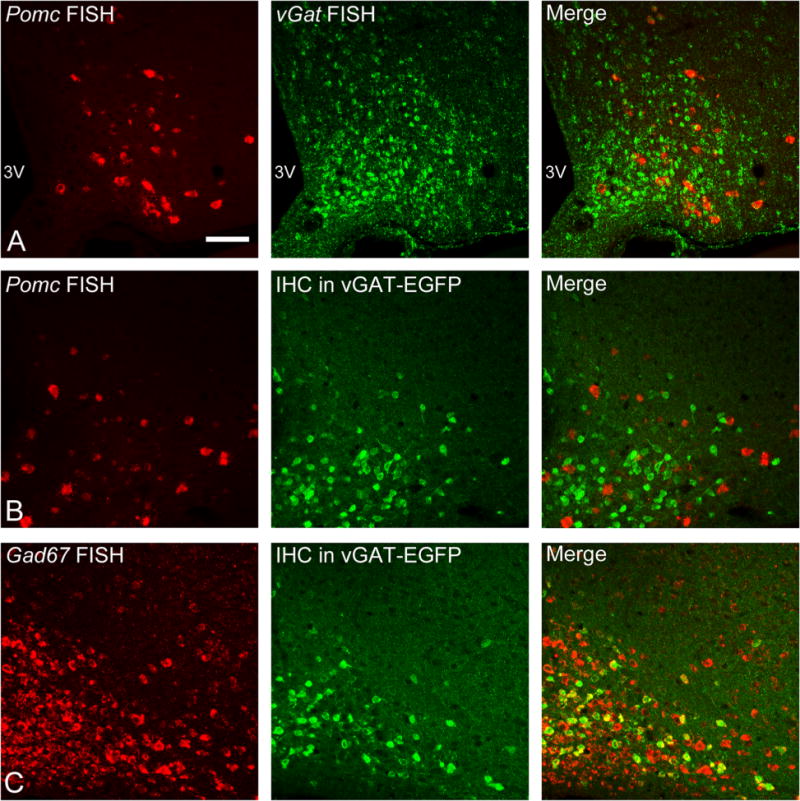
vGAT mRNA and vGAT–EGFP expression in POMC neurons. A: An example image of dual in situ hybridization for Pomc using a DIG-labeled probe and HNPP detection (red) and vGAT using an FITC-labeled probe and TSA-Biotin detection (green). B: In situ hybridization for Pomc in tissue from vGAT–EGFP transgenic mice reveals that the transgene is not expressed in a notable number of POMC neurons. C: In situ hybridization for Gad67 in tissue from vGAT–EGFP mice reveals that vGAT–EGFP is expressed only in a portion of GAD67-expressing cells (yellow cells in right panel). 3V, third ventricle. (A magenta–green version of this figure is included as a supplementary file for the assistance of color-blind authors.) Scale bar = 50 μm in A (applies to a–C).
Dual-phenotype POMC neurons
To determine the relative number and distribution of POMC neurons with GABAergic and glutamatergic markers, dual fluorescent in situ hybridization was performed to simultaneously detect vGlut2 and Gad65 in tissue from POMC–EGFP transgenic mice. Immunodetection of EGFP was used to identify the POMC cells. A clear distinction between glutamatergic and GABAergic cell populations was observed in many areas throughout the brain. Within the arcuate nucleus, most cells clearly expressed either vGlut2 or Gad65, although coexpression was occasionally observed (Fig. 5). Of the POMC–EGFP neurons, 3.6 ± 0.6% (n = 7) expressed both vGlut2 and Gad65 mRNA, suggesting that some POMC neurons may be capable of releasing both inhibitory and excitatory AA transmitters.
Figure 5.
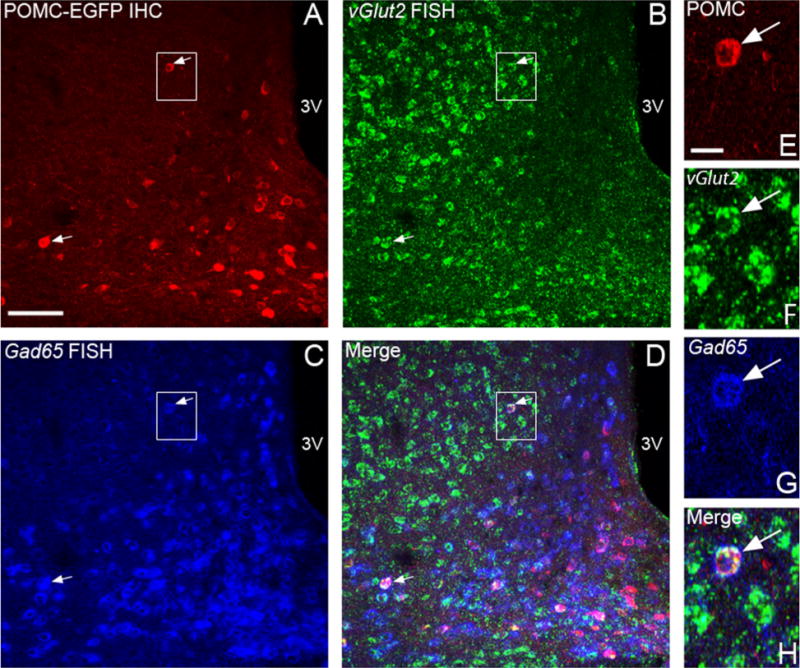
Simultaneous detection of vGlut2 and Gad65 in POMC neurons. A–C: POMC-EGFP was detected with a GFP antibody (A, red) after in situ hybridization for both vGlut2 using an FITC-labeled probe and TSA-Biotin detection (B, green) and Gad65 using DIG-labeled probes and HNPP detection (C, blue). POMC-EGFP cells expressing both vGlut2 and Gad65 are denoted with white arrows. D: Cells positive for only vGlut2, Gad65, or POMC–EGFP are apparent, especially in the merged image. E–H: The boxed areas are enlarged to highlight a cell with POMC–EGFP (E), vGlut2 (F), and Gad65 (G). 3V, third ventricle. Scale bar = 50 μm in A (applies to A–D); 10 μm in E (applies to E–H).
GAD67–GFP transgenic mouse
Earlier studies indicated that POMC neurons might be GABAergic because a cross between mice expressing red fluorescent protein under the control of the POMC promoter (POMC–DsRed transgenic mouse) and GAD67–GFP transgenic mice revealed that approximately 40% of POMC neurons contained GFP (Hentges et al., 2009). However, later experiments using POMC–DsRed and GAD67–GFP double-transgenic animals showed a steady decline in the occurrence of colocalization between the DsRed and GFP (data not shown). To determine whether the apparent decline in GAD67–GFP expression may be due to loss of transgene expression, fluorescent in situ hybridization for Pomc was performed in tissue from GAD67–GFP transgenic mice. By using this method, only 10.5 ± 1.3% (n = 3) of Pomc neurons colabeled with GAD67–GFP, considerably less than the 38 ± 1% of POMC neurons that expressed Gad67 mRNA (Table 4). Thus, the GAD67–GFP transgene is not expressed at detectable levels in all Gad67-positive cells.
DISCUSSION
To fully understand all the roles that POMC neurons play in the regulation of energy balance and reward, it is essential to identify the complete transmitter phenotype of these important neurons. Previous studies have suggested that POMC neurons are glutamatergic (Collin et al., 2003; Vong et al., 2011), GABAergic (Hentges et al., 2004), or both (Hentges et al., 2009). However, the difficulty of detecting GABA and glutamate or GAD, vGLUT, and vGAT proteins by using antibody-based detection methods in the hypothalamus has limited comprehensive analysis of POMC neuron phenotype. The present study used fluorescent in situ hybridization to demonstrate that POMC neurons express Gad65, −67, and/or vGlut2, suggesting a striking heterogeneity in AA transmitter phenotypes for POMC neurons. Interestingly, whereas Gad65 and −67 were readily detectable in POMC neurons, vGat was not, although POMC neurons release GABA from intact terminals (Dicken et al., 2012). The differing expression of phenotypic markers may need to be taken into account when determining transmitter release and designing experiments to alter GABA or glutamate release from POMC neurons. Overall, the in situ hybridization methods used here appear to provide a more sensitive and reliable means of detecting AA phenotype than transgenically expressed protein markers.
Glutamatergic POMC neurons
A small but distinct portion of POMC neurons may release the excitatory AA glutamate, as is indicated by the ~7% of POMC-EGFP neurons found in this study to express vGlut2.
vGLUT2 is one of three vesicular transporter proteins (vGLUT1–3) known to package glutamate into vesicles (Fremeau et al., 2001; Herzog et al., 2001; Schafer et al., 2002) and the only vGLUT that appears to be expressed in POMC neurons (Collin et al., 2003; present data). The presence of a vesicular transporter for glutamate in POMC neurons is consistent with the previous report of glutamate release from POMC neurons in primary cultures (Hentges et al., 2009).
Interestingly, a higher percentage of vGlut2-expressing POMC–EGFP cells were present in the retrochiasmatic and rostral arcuate nucleus compared with more central and caudal regions of the nucleus, suggesting a potential anatomical divergence in the function of POMC cells. Specific functions for POMC neurons located in distinct regions of the arcuate nucleus has previously been suggested based on the finding that administration of estradiol and testosterone can increase Pomc mRNA preferentially in neurons located in the rostral arcuate nucleus (Chowen-Breed et al., 1989; Cheung and Hammer, 1995). Although glutamate may be released from only a small portion of POMC neurons, recent tract-tracing studies suggest that small populations of POMC neurons project selectively to specific target sites (King and Hentges, 2011). Therefore, the rostrally located glutamatergic POMC neurons may mediate distinct physiologic actions.
GAD expression in POMC neurons
The GAD65 and −67 enzymes synthesize GABA, and their expression is generally indicative of GABA-releasing neurons (Erlander et al., 1991). The expression of both Gad65 and Gad67 mRNA in POMC neurons is consistent with the previous reports of GABA release from POMC neurons in primary cultures and hypothalamic slice preparations (Hentges et al., 2004; Atasoy et al., 2008; Hentges et al., 2009). In the present study Gad mRNA was detected in ~40% of POMC neurons, which is consistent with a previous report in which isotopic in situ hybridization was used to detect Gad (Hentges et al., 2004). Additionally, ~40% of POMC neurons were reported to be GABAergic on the basis of expression of GAD67 promoter-driven GFP expression in POMC neurons (Hentges et al., 2009), although another group found GAD67-GFP in only ~5% of POMC neurons (Yee et al., 2009). The low expression of GAD67-GFP reported by Yee et al. (2009) is consistent with our unpublished observation that GAD67-GFP expression has significantly declined over time, leading to the conclusion that this reporter no longer reliably labels the majority of POMC neurons that express Gad67. In situ hybridization appears to be a more reliable means of detection for Gad65 and −67 expression in POMC neurons.
Lack of vGAT in POMC neurons
In addition to the synthetic enzymes for GABA, vGAT has been considered a reliable marker for GABAergic neurons and is the only known protein capable of packaging GABA into vesicles for release (McIntire et al., 1997). The data shown here, however, suggest that neither the vGAT-EGFP transgene nor detectable levels of mRNA for vGat are present in a significant population of POMC neurons. Although both in situ hybridization and the vGAT-EGFP transgenic animal revealed very little coexpression of – in – neurons, there appeared to be a greater density of cells labeled for the mRNA than for the transgenic reporter (Fig. 4) suggesting that the vGAT-EGFP transgene does not label the entire population of vGat-expressing cells that can be detected by using in situ hybridization.
The apparent lack of vGAT in the majority of POMC neurons is consistent with a recent report from Vong et al. (2011) in which the authors used a transgenic reporter to detect vGAT expression. Interestingly, granule cells of the dentate gyrus of the hippocampus exhibit multiple markers of GABAergic cells, but either they do not express vGat (Chaudhry et al., 1998; Sperk et al., 2003), or else vGat occurs at extremely low levels, but can be upregulated under certain conditions (Lamas et al., 2001; Gómez-Lira et al., 2005). It seems possible that POMC neurons could express vGat at a low enough level that the methods used here were not sensitive enough to detect it, and perhaps the upregulation of vGat occurs during nonhomeostatic conditions that would allow for increased GABA release. Alternatively, POMC neurons may employ an alternative method of packaging GABA. In one study, an examination of the lateral oliva superior using electron microscopy revealed that ~25% of the GABA-containing terminals did not contain vGat (Chaudhry et al., 1998). Additionally, the data from another study showed that a portion of Gad67-immunoreactive cells did not express a vGat promoter-driven fluorescent reporter (Zhao et al., 2011), which agrees with the much denser labeling of Gad67 than of vGat-EGFP shown in this study.
Although an apparent lack of vGat expression could be a function of the detection methods used or indicative of mRNA not localized to the cell body (Giuditta et al, 2002), it is also possible that some cells are capable of releasing GABA independent of vGat. Reversal of the plasma membrane GABA transporter, for example, has been shown to underlie evoked GABA release in some conditions (Wu et al., 2007). However, in POMC neurons, pharmacologic inhibition of the GABA reuptake transporters does not affect GABA release from POMC terminals (our unpublished observation). Furthermore, GABA release from POMC terminals appears to be vesicular, based on the onset, amplitude, and duration of currents resulting from evoked GABA release (Hentges et al., 2004, 2009; Atasoy et al., 2008; Dicken et al., 2012). Further studies are needed to determine whether vGat levels are too low to detect under basal conditions or whether an alternative mechanism is used to package GABA in POMC neurons.
POMC neurons with Gad and vGlut2
In the present study, ~3.5% of POMC neurons were found to express both vGlut2 and Gad65 mRNA, suggesting the possibility of co-release of glutamate and GABA from these neurons. Although GABA and glutamate co-release has not been commonly reported, there is growing evidence that neurons in the adult brain can coexpress the machinery necessary for GABA and glutamate release. For example, the presence of vGat and vGlut or Gad and vGlut has been found in the hippocampus (Somogyi et al., 2004; Zander et al., 2010), cerebellum (Zander et al., 2010), and ex (Hioki et al., 2004; Somogyi et al., 2004; Fattorini et al., 2009), in terminals originating from the supramammillary nucleus (Boulland et al., 2009), and in the cat retina (Kao et al., 2004). Transmitter co-release during development has been attributed to the maturation and refinement of synapses (Anderson et al., 2004; Noh et al., 2010), whereas in adulthood it seems more likely that this is an indication of plasticity. For example, neurons in the preoptic area display hormone-dependent changes in the coexpression of vGLUT2 and vGAT (Ottem et al., 2004). It may be that AA transmitter phenotype is dynamically regulated in POMC neurons as well. Regardless of whether the AA phenotype of an individual POMC neuron is constant or plastic, the existence of excitatory and inhibitory subpopulations of POMC neurons is another indicator of heterogeneity of POMC neurons. It is now becoming clear that POMC neurons are heterogeneous in a variety of ways, and such heterogeneity is probably important to the wide range of functions attributed to these neurons (Sohn and Williams, 2012).
Advantages and technical considerations for using in situ hybridization to explore phenotype
Although the use of transgenically expressed markers to label cell types and manipulate cell function has many strengths, transgene expression may not always faithfully reflect native gene expression. The current results indicate that some transgenic markers are detectable only in a fraction of cells that can be identified by using in situ hybridization techniques. Conversely, transgenes can be ectopically expressed and genes may be expressed developmentally in a pattern not observed in the adult. A striking example is the recent demonstration that there is transient, widespread expression of the Pomc gene promoter during development, which can lead to a considerably high occurrence of off-target recombination of floxed alleles when a Pomc-cre mouse is used (Padilla et al., 2011). Thus, for some purposes, detection via in situ hybridization has clear advantages over transgenic markers.
In situ hybridization, however, can be technically challenging, and several approaches were tested to optimize the current methods. For example, after the dual fluorescent in situ hybridization procedure used here, many antibodies tested did not recognize their target proteins. POMC peptides and Ds-red lost their antigenicity and were not detectable with antibodies after the hybridization process (data not shown). Therefore, most of the studies were carried out in tissue from mice transgenically expressing EGFP because it was possible to perform immunodetection of EGFP even after the dual FISH procedure. Experiments were originally designed by using a biotin-labeled Pomc probe and antibody labeling to detect the biotin. This approach proved to be much less sensitive than TSA- or HNPP-based detection methods or immunohistochemistry for POMC-EGFP. Only ~50% of the POMC neurons were detected when immunodetection of the biotin-labeled probe was used, with ~80% of detected Pomc neurons expressing Gad65 mRNA. This highlights the importance of careful controls for in situ hybridization to ensure that maximum sensitivity has been achieved. To ensure that such maximal sensitivity was being achieved in the present study, probe concentrations were increased until background/nonspecific labeling was noted, and then the concentration of probe that gave the maximal signal without background labeling was used in the studies, as reported in Table 1. It should be noted, however, that what was considered excess signal (label in regions not previously reported to express the mRNA) with high probe concentrations could reflect not only nonspecific binding, but also detection of lower levels of message present in some cells (Hrabovszky and Petersen, 2002).
Thus, it could be that the stringent criteria used here to avoid false positives yielded an underestimate of the absolute number of cells expressing markers for GABA and/or glutamate phenotypes. Despite the potential limitations of in situ hybridization, the technique as employed here allowed for the simultaneous detection of markers for GABA and glutamate phenotypes in POMC neurons. Now it is clear that under the same conditions, in a single section of tissue, some POMC neurons are GABAergic, some are glutamatergic, and some may be capable of releasing both GABA and glutamate based on coexpression of GAD and vGLUT.
CONCLUSIONS
The present results show that POMC neurons can express vGlut2, indicating a glutamatergic phenotype, and Gad65 and Gad67, indicating a GABAergic phenotype. Together with previous studies demonstrating release of GABA and glutamate from POMC neurons, there is compelling evidence that this population of peptide-releasing neurons is heterogeneous in its AA phenotype. Gad and vGlut2, but not vGat, will provide reliable markers to further identify and study the distinct subpopulations of POMC neurons and the consequence of AA transmitter release from these neurons.
Supplementary Material
Acknowledgments
The authors thank Ms. Connie King for technical assistance in managing the mouse colony and for help in tissue processing and imaging.
Grant sponsor: National Institute of Diabetes and Digestive and Kidney Diseases; Grant number: R01DK0798749 (to S.T.H.).
Footnotes
Additional Supporting Information may be found in the online version of this article.
LITERATURE CITED
- Anderson TR, Shah PA, Benson DL. Maturation of glutamatergic and GABAergic synapse composition in hippocampal neurons. Neuropharmacology. 2004;47:694–705. doi: 10.1016/j.neuropharm.2004.07.023. [DOI] [PubMed] [Google Scholar]
- Atasoy D, Aponte Y, Su HH, Sternson SM. A FLEX switch targets Channelrhodopsin-2 to multiple cell types for imaging and long-range circuit mapping. J Neurosci. 2008;28:7025–7030. doi: 10.1523/JNEUROSCI.1954-08.2008. [DOI] [PMC free article] [PubMed] [Google Scholar]
- Boulland JL, Jenstad M, Boekel AJ, Wouterlood FG, Edwards RH, Storm-Mathisen J, Chaudhry FA. Vesicular glutamate and GABA transporters sort to distinct sets of vesicles in a population of presynaptic terminals. Cereb Cortex. 2009;19:241–248. doi: 10.1093/cercor/bhn077. [DOI] [PMC free article] [PubMed] [Google Scholar]
- Chaudhry FA, Reimer RJ, Bellocchio EE, Danbolt NC, Osen KK, Edwards RH, Storm-Mathisen J. The vesicular GABA transporter, VGAT, localizes to synaptic vesicles in sets of glycinergic as well as GABAergic neurons. J Neurosci. 1998;18:9733–9750. doi: 10.1523/JNEUROSCI.18-23-09733.1998. [DOI] [PMC free article] [PubMed] [Google Scholar]
- Cheung S, Hammer RP., Jr Gonadal steroid hormone regulation of proopiomelanocortin gene expression in arcuate neurons that innervate the medial preoptic area of the rat. Neuroendocrinology. 1995;62:283–292. doi: 10.1159/000127015. [DOI] [PubMed] [Google Scholar]
- Chowen-Breed JA, Clifton DK, Steiner RA. Regional specificity of testosterone regulation of proopiomelanocortin gene expression in the arcuate nucleus of the male rat brain. Endocrinology. 1989;124:2875–2881. doi: 10.1210/endo-124-6-2875. [DOI] [PubMed] [Google Scholar]
- Coll AP. Effects of pro-opiomelanocortin (POMC) on food intake and body weight: mechanisms and therapeutic potential? Clin Sci (Lond) 2007;113:171–182. doi: 10.1042/CS20070105. [DOI] [PubMed] [Google Scholar]
- Collin M, Backberg M, Ovesjo ML, Fisone G, Edwards RH, Fujiyama F, Meister B. Plasma membrane and vesicular glutamate transporter mRNAs/proteins in hypothalamic neurons that regulate body weight. Eur J Neurosci. 2003;18:1265–1278. doi: 10.1046/j.1460-9568.2003.02840.x. [DOI] [PubMed] [Google Scholar]
- Cowley MA, Smart JL, Rubinstein M, Cerdan MG, Diano S, Horvath TL, Cone RD, Low MJ. Leptin activates anorexigenic POMC neurons through a neural network in the arcuate nucleus. Nature. 2001;411:480–484. doi: 10.1038/35078085. [DOI] [PubMed] [Google Scholar]
- de Souza FS, Bumaschny VF, Low MJ, Rubinstein M. Subfunctionalization of expression and peptide domains following the ancient duplication of the proopiomelanocortin gene in teleost fishes. Mol Biol Evol. 2005;22:2417–2427. doi: 10.1093/molbev/msi236. [DOI] [PubMed] [Google Scholar]
- Dicken MS, Tooker RE, Hentges ST. Regulation of GABA and glutamate release from proopiomelanocortin neuron terminals in intact hypothalamic networks. J Neurosci. 2012;32:4042–4048. doi: 10.1523/JNEUROSCI.6032-11.2012. [DOI] [PMC free article] [PubMed] [Google Scholar]
- Erlander MG, Tillakaratne NJ, Feldblum S, Patel N, Tobin AJ. Two genes encode distinct glutamate decarboxylases. Neuron. 1991;7:91–100. doi: 10.1016/0896-6273(91)90077-d. [DOI] [PubMed] [Google Scholar]
- Esclapez M, Tillakaratne NJ, Tobin AJ, Houser CR. Comparative localization of mRNAs encoding two forms of glutamic acid decarboxylase with nonradioactive in situ hybridization methods. J Comp Neurol. 1993;331:339–362. doi: 10.1002/cne.903310305. [DOI] [PubMed] [Google Scholar]
- Fattorini G, Verderio C, Melone M, Giovedi S, Benfenati F, Matteoli M, Conti F. VGLUT1 and VGAT are sorted to the same population of synaptic vesicles in subsets of cortical axon terminals. J Neurochem. 2009;110:1538–1546. doi: 10.1111/j.1471-4159.2009.06251.x. [DOI] [PubMed] [Google Scholar]
- Fremeau RT, Jr, Troyer MD, Pahner I, Nygaard GO, Tran CH, Reimer RJ, Bellocchio EE, Fortin D, Storm-Mathisen J, Edwards RH. The expression of vesicular glutamate transporters defines two classes of excitatory synapse. Neuron. 2001;31:247–260. doi: 10.1016/s0896-6273(01)00344-0. [DOI] [PubMed] [Google Scholar]
- Giuditta A, Kaplan BB, van Minnen J, Alvarez J, Koenig E. Axonal and presynaptic protein synthesis: new insights into the biology of the neuron. Trends Neurosci. 2002;25:400–404. doi: 10.1016/s0166-2236(02)02188-4. [DOI] [PubMed] [Google Scholar]
- Gómez-Lira G, Lamas M, Romo-Parra H, Gutiérrez R. Programmed and induced phenotype of hippocampal granule cells. J Neurosci. 2005;25:6939–6946. doi: 10.1523/JNEUROSCI.1674-05.2005. [DOI] [PMC free article] [PubMed] [Google Scholar]
- Gong S, Zheng C, Doughty ML, Losos K, Didkovsky N, Schambra UB, Nowak NJ, Joyner A, Leblanc G, Hatten ME, Heintz N. A gene expression atlas of the central nervous system based on bacterial artificial chromosomes. Nature. 2003;425:917–925. doi: 10.1038/nature02033. [DOI] [PubMed] [Google Scholar]
- Hentges ST, Nishiyama M, Overstreet LS, Stenzel-Poore M, Williams JT, Low MJ. GABA release from proopiomelanocortin neurons. J Neurosci. 2004;24:1578–1583. doi: 10.1523/JNEUROSCI.3952-03.2004. [DOI] [PMC free article] [PubMed] [Google Scholar]
- Hentges ST, Otero-Corchon V, Pennock RL, King CM, Low MJ. Proopiomelanocortin expression in both GABA and glutamate neurons. J Neurosci. 2009;29:13684–13690. doi: 10.1523/JNEUROSCI.3770-09.2009. [DOI] [PMC free article] [PubMed] [Google Scholar]
- Herzog E, Bellenchi GC, Gras C, Bernard V, Ravassard P, Bedet C, Gasnier B, Giros B, El Mestikawy S. The existence of a second vesicular glutamate transporter specifies subpopulations of glutamatergic neurons. J Neurosci. 2001;21:RC181. doi: 10.1523/JNEUROSCI.21-22-j0001.2001. [DOI] [PMC free article] [PubMed] [Google Scholar]
- Hioki H, Fujiyama F, Nakamura K, Wu SX, Matsuda W, Kaneko T. Chemically specific circuit composed of vesicular glutamate transporter 3- and preprotachykinin B-producing interneurons in the rat neocortex. Cereb Cortex. 2004;14:1266–1275. doi: 10.1093/cercor/bhh088. [DOI] [PubMed] [Google Scholar]
- Hrabovszky E, Petersen SL. Increased concentrations of radioisotopically-labeled complementary ribonucleic acid probe, dextran sulfate, and dithiothreitol in the hybridization buffer can improve results of in situ hybridization histochemistry. J Histochem Cytochem. 2002;50:1389–1400. doi: 10.1177/002215540205001012. [DOI] [PubMed] [Google Scholar]
- Kao YH, Lassova L, Bar-Yehuda T, Edwards RH, Sterling P, Vardi N. Evidence that certain retinal bipolar cells use both glutamate and GABA. J Comp Neurol. 2004;478:207–218. doi: 10.1002/cne.20221. [DOI] [PubMed] [Google Scholar]
- King CM, Hentges ST. Relative number and distribution of murine hypothalamic proopiomelanocortin neurons innervating distinct target sites. PLoS One. 2011;6:e25864. doi: 10.1371/journal.pone.0025864. [DOI] [PMC free article] [PubMed] [Google Scholar]
- Lamas M, Gómez-Lira G, Gutiérrez R. Vesicular GABA transporter mRNA expression in the dentate gyrus and in mossy fiber synaptosomes. Brain Res Mol Brain Res. 2001;93:209–214. doi: 10.1016/s0169-328x(01)00202-9. [DOI] [PubMed] [Google Scholar]
- Leupen SM, Tobet SA, Crowley WF, Jr, Kaila K. Heterogeneous expression of the potassium-chloride cotrans-porter KCC2 in gonadotropin-releasing hormone neurons of the adult mouse. Endocrinology. 2003;144:3031–3036. doi: 10.1210/en.2002-220995. [DOI] [PubMed] [Google Scholar]
- McIntire SL, Reimer RJ, Schuske K, Edwards RH, Jorgensen EM. Identification and characterization of the vesicular GABA transporter. Nature. 1997;389:870–876. doi: 10.1038/39908. [DOI] [PubMed] [Google Scholar]
- Noh J, Seal RP, Garver JA, Edwards RH, Kandler K. Glutamate co-release at GABA/glycinergic synapses is crucial for the refinement of an inhibitory map. Nat Neurosci. 2010;13:232–238. doi: 10.1038/nn.2478. [DOI] [PMC free article] [PubMed] [Google Scholar]
- Ottem EN, Godwin JG, Krishnan S, Petersen SL. Dual-phenotype GABA/glutamate neurons in adult preoptic area: sexual dimorphism and function. J Neurosci. 2004;24:8097–8105. doi: 10.1523/JNEUROSCI.2267-04.2004. [DOI] [PMC free article] [PubMed] [Google Scholar]
- Ovesjo ML, Gamstedt M, Collin M, Meister B. GABAergic nature of hypothalamic leptin target neurones in the ventromedial arcuate nucleus. J Neuroendocrinol. 2001;13:505–516. doi: 10.1046/j.1365-2826.2001.00662.x. [DOI] [PubMed] [Google Scholar]
- Padilla SL, Reef D, Zeltser LM. Defining POMC neurons using transgenic reagents: impact of transient Pomc expression in diverse immature neuronal populations. Endocrinology. 2011;153:1219–1231. doi: 10.1210/en.2011-1665. [DOI] [PMC free article] [PubMed] [Google Scholar]
- Poulin JF, Castonguay-Lebel Z, Laforest S, Drolet G. Enkephalin co-expression with classic neurotransmitters in the amygdaloid complex of the rat. J Comp Neurol. 2008;506:943–959. doi: 10.1002/cne.21587. [DOI] [PubMed] [Google Scholar]
- Roth-Deri I, Green-Sadan T, Yadid G. Beta-endorphin and drug-induced reward and reinforcement. Prog Neurobiol. 2008;86:1–21. doi: 10.1016/j.pneurobio.2008.06.003. [DOI] [PubMed] [Google Scholar]
- Schafer MK, Varoqui H, Defamie N, Weihe E, Erickson JD. Molecular cloning and functional identification of mouse vesicular glutamate transporter 3 and its expression in subsets of novel excitatory neurons. J Biol Chem. 2002;277:50734–50748. doi: 10.1074/jbc.M206738200. [DOI] [PubMed] [Google Scholar]
- Sohn JW, Williams KW. Functional heterogeneity of arcuate nucleus pro-opioimelanocortin neurons: implications for diverging melanocortin pathways. Mol Neurobiol. 2012;45:225–233. doi: 10.1007/s12035-012-8240-6. [DOI] [PMC free article] [PubMed] [Google Scholar]
- Somogyi J, Baude A, Omori Y, Shimizu H, El Mestikawy S, Fukaya M, Shigemoto R, Watanabe M, Somogyi P. GABAergic basket cells expressing cholecystokinin contain vesicular glutamate transporter type 3 (VGLUT3) in their synaptic terminals in hippocampus and isocortex of the rat. Eur J Neurosci. 2004;19:552–569. doi: 10.1111/j.0953-816x.2003.03091.x. [DOI] [PubMed] [Google Scholar]
- Sperk G, Schwarzer C, Heilman J, Furtinger S, Reimer RJ, Edwards RH, Nelson N. Expression of plasma membrane GABA transporters but not of the vesicular GABA transporter in dentate granule cells after kainic acid seizures. Hippocampus. 2003;13:806–815. doi: 10.1002/hipo.10133. [DOI] [PubMed] [Google Scholar]
- Tamamaki N, Yanagawa Y, Tomioka R, Miyazaki J, Obata K, Kaneko T. Green fluorescent protein expression and colocalization with calretinin, parvalbumin, and somatostatin in the GAD67-GFP knock-in mouse. J Comp Neurol. 2003;467:60–79. doi: 10.1002/cne.10905. [DOI] [PubMed] [Google Scholar]
- Vong L, Ye C, Yang Z, Choi B, Chua S, Jr, Lowell BB. Leptin action on GABAergic neurons prevents obesity and reduces inhibitory tone to POMC neurons. Neuron. 2011;71:142–154. doi: 10.1016/j.neuron.2011.05.028. [DOI] [PMC free article] [PubMed] [Google Scholar]
- Watakabe A, Komatsu Y, Ohsawa S, Yamamori T. Fluorescent in situ hybridization technique for cell type identification and characterization in the central nervous system. Methods. 2010;52:367–374. doi: 10.1016/j.ymeth.2010.07.003. [DOI] [PubMed] [Google Scholar]
- Williams RW, Rakic P. Three-dimensional counting: an accurate and direct method to estimate numbers of cells in sectioned material. J Comp Neurol. 1988;278:344–352. doi: 10.1002/cne.902780305. [DOI] [PubMed] [Google Scholar]
- Wu Y, Wang W, Díez-Sampedro A, Richerson GB. Non-vesicular inhibitory neurotransmission via reversal of the GABA transporter GAT-1. Neuron. 2007;56:851–865. doi: 10.1016/j.neuron.2007.10.021. [DOI] [PMC free article] [PubMed] [Google Scholar]
- Yee CL, Wang Y, Anderson S, Ekker M, Rubenstein JL. Arcuate nucleus expression of NKX2.1 and DLX and lineages expressing these transcription factors in neuropeptide Y(+), proopiomelanocortin(+), and tyrosine hydroxylase(+) neurons in neonatal and adult mice. J Comp Neurol. 2009;517:37–50. doi: 10.1002/cne.22132. [DOI] [PMC free article] [PubMed] [Google Scholar]
- Zander JF, Munster-Wandowski A, Brunk I, Pahner I, Gomez-Lira G, Heinemann U, Gutierrez R, Laube G, Ahnert-Hilger G. Synaptic and vesicular coexistence of VGLUT and VGAT in selected excitatory and inhibitory synapses. J Neurosci. 2010;30:7634–7645. doi: 10.1523/JNEUROSCI.0141-10.2010. [DOI] [PMC free article] [PubMed] [Google Scholar]
- Zhao S, Ting JT, Atallah HE, Qiu L, Tan J, Gloss B, Augustine GJ, Deisseroth K, Luo M, Graybiel AM, Feng G. Cell type-specific channelrhodopsin-2 transgenic mice for optogenetic dissection of neural circuitry function. Nat Methods. 2011;8:745–752. doi: 10.1038/nmeth.1668. [DOI] [PMC free article] [PubMed] [Google Scholar]
Associated Data
This section collects any data citations, data availability statements, or supplementary materials included in this article.