

Abstract
The identification of bacteria by their volatilomes is of interest to many scientists and clinicians as it holds the promise of diagnosing infections in situ, particularly lung infections via breath analysis. While there are many studies reporting various bacterial volatile biomarkers or fingerprints using in vitro experiments, it has proven difficult to translate these data to in vivo breath analyses. Therefore, we aimed to create secondary electrospray ionization-mass spectrometry (SESI-MS) pathogen fingerprints directly from the breath of mice with lung infections. In this study we demonstrated that SESI-MS is capable of differentiating infected vs. uninfected mice, P. aeruginosa–infected vs. S. aureus–infected mice, as well as distinguish between infections caused by P. aeruginosa strains PAO1 vs. FRD1, with statistical significance (p < 0.05). In addition, we compared in vitro and in vivo volatiles and observed that only 25–34% of peaks are shared between the in vitro and in vivo SESI-MS fingerprints. To the best of our knowledge, these are the first breath volatiles measured for P. aeruginosa PAO1, FRD1, and S. aureus RN450, and the first comparison of in vivo and in vitro volatile profiles from the same strains using the murine infection model.
Introduction
Bacteria produce unique combinations of volatiles that can be used to identify the genus and species, and in many cases the strain or serovar [1–3]. The ability to identify bacteria by their volatilomes has generated great expectations for rapid and non-invasive clinical tests that are able to diagnose and identify infections in situ, particularly for diagnosing lung infections via breath analysis [3–7]. However, the development and implementation of clinical tests based on volatile biomarkers have been limited due to the historical reliance on small numbers of volatile compounds for detection. Tests that rely on few biomarkers suffer from poor sensitivity and/or specificity because of variations in human metabolism, infectious species and strains, and the patient’s environment [8–10]. An individual’s breath contains hundreds of compounds, with a small fraction (an estimated 10%, or less) of these volatiles being universal, i.e., found in all human breath [10–12]. The majority of breath volatiles are low-frequency compounds present in combinations that are distinctive to an individual, thereby increasing the complete human breath volatilome (positive and negative alveolar gradients) to an estimated 4000–6000 compounds [6, 12]. This high degree of variability in the composition of human breath underscores the difficulty inherent to choosing a small number of biomarkers for diagnostic purposes.
The detection of Pseudomonas aeruginosa, a common, opportunistic Gram-negative bacterium that frequently infects the cystic fibrosis (CF) lung, has been attempted via the use of several single biomarkers in breath [4, 13–15]. However, these studies and others have concluded that both external and environmental factors can confound the reliability of single biomarkers. For instance, 2-aminoacetophenone (2-AA) is a bacterial metabolite specific to P. aeruginosa [4, 16, 17] and is a sensitive biomarker of P. aeruginosa infections [4, 18]. However, this compound is also found in the breath of uninfected subjects shortly after eating certain foods [4, 19]. Hydrogen cyanide (HCN) is present in statistically-higher concentrations in the breath of children with CF-related P. aeruginosa lung infections vs. uninfected CF controls [15], but the relative abundance of HCN in the clinical environment [13] and the oropharyngeal cavity [20], and the wide range of background concentrations in adults [20, 21] negatively impact the selectivity and specificity of this biomarker. While confounding factors such as diet or environmental background concentrations of putative biomarkers can be controlled for when known, identifying all potential interferences for single biomarkers is a labor-intensive approach.
Additional problems arise when translating volatile biomarkers from the lab to the clinic, as many of the hallmark bacterial volatiles have been identified in vitro, but are absent in vivo or below the limits of detection in breath. Using in vitro analyses, Syhre and colleagues identified putative volatile biomarkers from Mycobacterium tuberculosis, but only one of the four major biomarkers have been identified in the breath of M. tuberculosis-infected subjects [22, 23]. Lastly, methyl thiocyanate has been observed in the in vitro headspace of 78% of P. aeruginosa clinical isolates, yet is not statistically more abundant in the breath of P. aeruginosa-infected CF patients vs. non-infected CF patients, nor vs. healthy controls [9]. Because of the lack of success in developing breath diagnostics from selected in vitro volatile biomarkers, several techniques are being explored that capture more complete breath volatilomes for the diagnosis of infectious disease. This approach, typically referred to as volatile profiling or fingerprinting, is being developed on chemical sensor, gas chromatographic (GC), and mass spectrometric (MS) platforms [3, 6, 14, 24–32]. Combining more than a dozen GC or GC-MS breath biomarkers has proven to be a reliable strategy for diagnosing P. aeruginosa lung infections [6, 14]. Other technologies that capture simultaneous information on a range of compounds, such as the electronic nose, are selective and specific for diagnosing respiratory diseases [3], and are being expanded toward detecting bacterial lung infections, such as tuberculosis [33, 34].
One fingerprinting technology we are developing for bacterial identification is secondary electrospray ionization mass spectrometry (SESI-MS) [1, 35], which is able to detect volatile molecules that can be protonated or deprotonated during the analysis (i.e., contains O, N, or S heteroatoms). Previous studies have demonstrated the capabilities of SESI-MS for real-time detection and identification of VOCs, with a limit of detection as low as parts per trillion [36]. Using SESI-MS volatile fingerprinting we can distinguish bacteria to the strain/serovar level and in mixed cultures when grown aerobically to stationary phase in vitro [1]. However, because flask fingerprints and biomarkers may not translate to the goals of detecting human or animal pathogens in vivo, we aimed to create SESI-MS pathogen fingerprints directly from breath. For the experiments described herein, we established murine lung infections using two species of bacteria that we have previously characterized in vitro, P. aeruginosa and Staphylococcus aureus, and compared the in vivo SESI-MS fingerprints, or “breathprints”, to the bacteria’s in vitro volatile fingerprints. We observed that there are characteristic changes to the SESI-MS breathprint that indicate the presence of infection as well as allow us to identify the infecting species and strain. We also report that the similarity between the in vivo and in vitro bacterial volatile fingerprints ranges from about one quarter to one third of the total volatiles produced.
2. Materials and method
2.1 Bacterial strains and growth condition
The strains used in this study were P. aeruginosa PAO1-UW, P. aeruginosa FRD1, and S. aureus RN450 (courtesy of Professor G. L. Archer, Virginia Commonwealth University). For in vivo test preparation, strains were incubated aerobically in tryptic soy broth (TSB; 16 h, 37°C, 200 rpm; final OD600 > 3.0). For in vitro test preparation, strains were incubated aerobically in TSB (16 h, 37°C, 200 rpm) where after 50 μL was used to inoculate 50 mL TSB for 24 h (16 h, 37°C, 200 rpm, OD600 > 3.0).
2.2 Mice
Six- to eight-week-old male C57BL/6J mice were purchased from The Jackson Laboratories (Bar Harbor, ME). All mice were housed in the Association for Assessment and Accreditation of Laboratory Animal Care-accredited animal facility at the University of Vermont (Burlington, VT). The protocol for animal infection and respiratory physiology measurements was approved by the Institutional Animal Care and Use Committee, in accordance with Association for Assessment and Accreditation of Laboratory Animal Care guidelines.
2.3 Microbial airway exposure protocol
An acute airway exposure model was applied in this study. Briefly, overnight cultures of PAO1, FRD1 and RN450 were measured for OD600, centrifuged at 13,000 rpm for 1 min, washed twice with phosphate buffer solution (PBS), and resuspended to give the desired concentration of bacteria (5×10⁶ CFU for PAO1, 1×10⁷ CFU for FRD1, and 1×10⁸ CFU for RN450) in 40 μL PBS. Mice were briefly anesthetized (isoflurane by inhalation) and infected by oropharyngeal aspiration as described previously [37, 38]. Uninfected mice were exposed to 40 μL PBS as a negative control. Five mice per group were exposed and testing was conducted on two different days. After breath collection, the lungs were harvested and homogenized, and the lung bacterial cell counts were obtained by plating on selective media, yielding averages of 1×10⁵ CFU/lung for PAO1, 5×10⁵ CFU/lung for FRD1, and 2×10⁶ CFU/lung for RN450.
2.4 Mice ventilation and breath sample collection
The mice were anesthetized with pentobarbital 24 h after infection and their tracheas were cannulated. The mice were placed on the ventilators (Flexivent, SCIREQ, Montreal, QC, Canada) and paralyzed with intraperitoneal pancuronium bromide (0.5 mg/kg), and an ECG was applied to monitor heart rate to ensure proper anesthesia. Breath coming out of the ventilator was collected in Tedlar bags (SKC, Eighty Four, PA) at 180 breaths/min with a positive end-expiratory pressure (PEEP) of 3 cm H2O for 1 h.
2.5 Secondary electrospray ionization mass spectrometry (SESI-MS) and breath sampling
Breath volatiles analyses were performed using SESI-MS. The instrumental setup has been previously described [1, 35, 39]. Briefly, the original ionization source of an API 3000 mass spectrometer (SCIEX, Concord, ON, Canada) was replaced with a stainless steel SESI-MS reaction chamber equipped with an electrospray capillary and a gas transfer line through which the breath volatiles are introduced into the reaction chamber (for a detailed schematic of the SESI-MS system, please see reference [35]. Gas flow of 5 L/min was driven by a mechanical pump that connected to the sampling gas outlet of the SESI-MS reaction chamber. The breath sample was introduced into the reaction chamber for 30 s at a flow rate of 3 L/min, supplemented with 2 L/min CO2 (99.99 %) at ambient temperature. Formic acid (0.1 % (v/v)) was used as the electrospray solution, delivered at a flow rate of 5 nL/s through a non-conductive silica capillary (40 μm ID) with a sharpened needle tip. The operation voltage was ~ 3.5 kV. Spectra were collected within 30 s as an accumulation of 10 scans in positive-ion mode. The system was flushed with CO2 between samples until the spectrum returned to background levels.
2.6 Data analysis and statistics
Analyst 1.4.2 software (Applied Biosystems) was used for spectra collection and raw data processing. Mass spectra shown in each figure are the average spectra of all replicates in each group. Full scan spectra shown in the figures have been blank-subtracted (for in vitro tests, the blank spectrum is the spectrum generated by sterile media; for in vivo tests, the blank spectrum is humidified room air collected using the same procedure as for mice breath) and normalized to the peak of greatest intensity. To evaluate the reproducibility of breathprints in each group, we used the Spearman rank correlation. Then we applied the multivariate analysis method principal component analysis (PCA) to establish statistical evidence for the uniqueness of breathprints from different lung infections. PCA is a statistical tool used to compress complex information and is typically applied when the measurements have a large number of observed variables (e.g., m/z from the mass spectra). Peaks between 20 and 200 m/z (mass-to-charge ratio) and greater than 1 % relative intensity (after blank subtraction) were used as variables, with their absolute intensities used for the calculations in PCA. All experimental replicates were used as observations. SAS version 9.2 and JMP version 9 (SAS Institute Inc., Cary, NC, USA) were used to generate Spearman rank correlation coefficient, conduct PCA, as well as to determine the statistical significance of observed PCA score differences.
3. Results and discussion
3.1 Analysis of mice breathprints
Breath was collected for one hour from fifteen mice infected with either P. aeruginosa PAO1, FRD1, or S. aureus RN450 (five per group), and from five uninfected controls. The breath volatile compounds were fingerprinted using SESI-MS (Fig. 1), yielding 32 peaks from mice infected with P. aeruginosa PAO1, 61 peaks from mice infected with P. aeruginosa FRD1, and 63 peaks from the S. aureus-infected mice. Qualitative analysis of these spectral breathprints shows that P. aeruginosa infections generate a different volatile fingerprint compared to S. aureus, and both lung infections have different breathprints compared to the uninfected control. In order to check the biological reproducibility of our data, Spearman rank correlation coefficients were calculated and the average values between the biological replicates of each infection group ranged from 0.60 to 0.84 (with standard errors less than 0.09). The first important question to address in diagnosing lung infections is whether or not healthy lungs can be distinguished from infected lungs, regardless of the infectious species. We applied principal component analysis (PCA) to assess group separation based on the spectra in Fig. 1. By using only the first principal component, the breathprints of the infected mice are statistically different from the uninfected mice (p < 0.005). There are, additionally, important chemical nuances embedded in this analysis. Five measurable peaks (m/z = 54, 65, 70, 72 and 91; Table 1) can only be measured in the breath of infected mice. In addition, there are 16 peaks (Table 1) that are only observed in the breath of the uninfected controls. In combination, the presence and absence of these 21 peaks may serve as breathprint markers of bacterial infection, but breathprints from additional lung pathogens will be required to validate the universality of these putative markers.
Fig. 1.
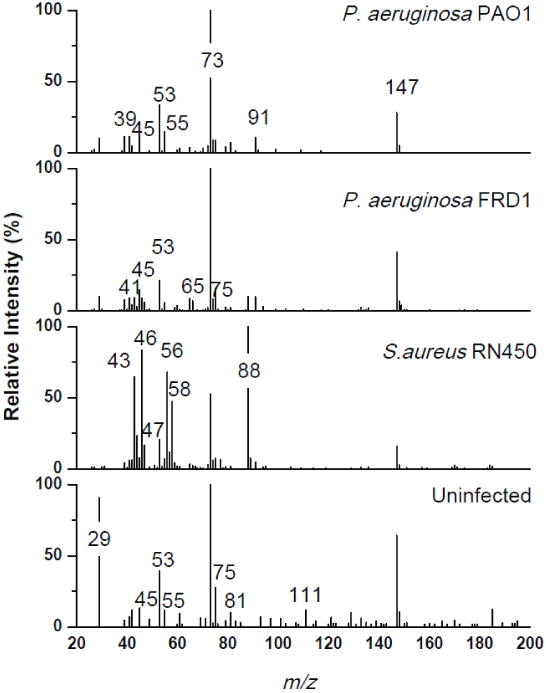
SESI-MS breathprints of mice with P. aeruginosa PAO1, P. aeruginosa FRD1, or S. aureus RN450 lung infections, or uninfected lungs. Each spectrum is the average of breath from five mice after a 24 h lung infection.
Table 1.
SESI-MS breathprint signals of infected and uninfected mice
| Peak (m/z) | UNa | Δb
|
Previously reported c | Peak (m/z) | UNa | Δb
|
Previously reported c | ||||
|---|---|---|---|---|---|---|---|---|---|---|---|
| PAO1 | FRD1 | RN450 | PAO1 | FRD1 | RN450 | ||||||
| 26 | X | X | XX | 89 | # | [14, 18, 24, 45–51] | |||||
| 27 | X | X | X | 91 | # | # | # | [24, 45] | |||
| 30 | # | # | 92 | # | |||||||
| 31 | # | [51] | 93 | + | |||||||
| 37 | # | 94 | # | # | |||||||
| 38 | # | # | 95 | # | [18, 24, 45, 46, 48, 49, 51–54] | ||||||
| 39 | XX | XXX | XXX | 97 | + | ||||||
| 40 | # | # | 99 | # | # | ||||||
| 41 | XX | XXX | XXX | 101 | + | ||||||
| 42 | X | XX | [1, 48, 54] | 103 | X | [18, 24, 46] | |||||
| 43 | # | # | 105 | # | |||||||
| 44 | # | # | 107 | + | |||||||
| 45 | X | XX | XX | [24, 51–53, 55] | 108 | + | |||||
| 46 | # | # | 109 | # | # | [1, 18, 45] | |||||
| 47 | # | # | [1, 24, 48, 50–56] | 110 | # | ||||||
| 48 | # | 111 | + | ||||||||
| 49 | X | [24, 51, 52, 54, 55] | 114 | X | |||||||
| 51 | # | 115 | + | ||||||||
| 52 | # | 117 | # | # | [24, 51] | ||||||
| 53 | X | X | XX | 119 | # | ||||||
| 54 | # | # | # | 121 | + | ||||||
| 55 | XX | X | XX | 122 | + | ||||||
| 56 | # | 123 | + | ||||||||
| 57 | # | [1, 24] | 128 | + | |||||||
| 58 | # | 131 | + | ||||||||
| 59 | # | # | [1, 24, 52–54, 56, 57] | 132 | # | ||||||
| 60 | X | XXX | XXX | [51] | 134 | # | [45] | ||||
| 65 | # | # | # | 135 | # | ||||||
| 66 | # | # | 136 | # | # | [1, 4, 6, 16, 18, 19, 45, 56] | |||||
| 67 | # | # | 137 | + | |||||||
| 68 | # | # | [24, 45, 48, 51] | 139 | + | ||||||
| 70 | # | # | # | [24] | 141 | + | |||||
| 72 | # | # | # | 146 | # | ||||||
| 73 | X | XX | XX | [6, 24, 45–47, 49, 51, 54, 55] | 147 | XX | X | ||||
| 74 | XXX | XXX | XXX | [9, 45, 46, 56] | 148 | XX | X | ||||
| 75 | X | X | [18, 24, 45, 46, 48, 49, 51] | 150 | X | ||||||
| 76 | X | 151 | X | X | |||||||
| 77 | # | [55] | 157 | # | |||||||
| 78 | # | 159 | # | ||||||||
| 79 | X | X | X | 169 | # | ||||||
| 80 | # | 170 | XX | ||||||||
| 81 | X | 171 | # | ||||||||
| 85 | + | 174 | # | # | |||||||
| 87 | # | [1, 24, 45, 46, 50, 51, 55] | 183 | # | |||||||
| 88 | # | # | [6] | 184 | # | ||||||
Peaks that were only measured in the breath of uninfected mice, indicated by +
Fold change over uninfected mice: X less than 2 fold; XX 2–4 fold; XXX more than 4 fold; # present in infected mice breath but not in uninfected mice breath.
Previous reports of bacterial VOCs with matching m/z.
Next, we explored the possibility of identifying the infectious species with SESI-MS breathprinting. As seen from Fig. 1, the breathprint from mice infected with P. aeruginosa is different from those infected with S. aureus, including 18 peaks that are unique to the breath of mice infected with S. aureus, which are not present in the breath of uninfected mice or mice infected with P. aeruginosa (Table 1). Both strains of P. aeruginosa are statistically separated from S. aureus using only the first principal component (p <0.005). We also found that SESI-MS breathprinting provides enough information to differentiate between the two strains of P. aeruginosa used in this study: PAO1 (an acute infection isolate) [40] and FRD1 (a chronic infection isolate) [41]. PAO1 and FRD1 share 19 peaks in their breathprint, but there are 10 unique peaks that distinguish between PAO1 and FRD1 (one peak, m/z = 92, belongs to PAO1 and nine belong to FRD1), as seen in Table 1. These 10 peaks are not produced by uninfected or S. aureus-infected mice. The PCA showed that the volatile breathprint from the three bacteria-infected mice groups and the uninfected control group can all be separated with two principal components (p < 0.05). Therefore, for the strains investigated in this study, SESI-MS analysis of the breath of mice can distinguish between infected and uninfected animals, and identify the infectious species to the strain level.
To our knowledge, this is the first report profiling the breath volatiles of mice infected with P. aeruginosa or S. aureus. However, there have been publications characterizing the volatiles produced by several strains of P. aeruginosa and S. aureus, and the SESI-MS peaks we report here are consistent with volatile biomarkers that have been previously reported for these species. A summary of previously published data on protonatable P. aeruginosa and S. aureus volatiles from both in vitro and in vivo studies is provided in Table 1.
3.2 Comparison of in vitro volatile fingerprints to in vivo breathprints
The majority of published studies that propose to use volatile organic compounds (VOCs) to diagnose infectious disease utilize in vitro data and assume that these data translate to the host-pathogen VOC fingerprint, and comparison of in vivo data to in vitro VOCs is rare [4, 22, 23]. We hypothesize that some VOCs produced in the headspace during in vitro experiments will be present in the breath of an infected host, but that there will also be VOCs that are unique to the host-pathogen interaction. To test this hypothesis, we grew P. aeruginosa PAO1, FRD1, and S. aureus RN450 in tryptic soy broth (TSB) and analyzed the in vitro headspace volatiles by SESI-MS (Fig. 2) for comparison to the in vivo data collected for mouse lung infections. When comparing the in vivo and in vitro data side by side (Fig. 1 vs. Fig. 2), it is obvious that the SESI-MS fingerprints are strongly influenced by the growth conditions. For example, the three most abundant peaks from the breath of P. aeruginosa PAO1-infected mice are peaks m/z = 73, 53, and 147, while the dominant peaks of flask-grown PAO1 are m/z = 109, 118, and 82. However, we also observed some shared peaks between these two experimental conditions for each bacterial strain. To quantify the relatedness of the mouse breath and flask-grown volatile fingerprints, the in vivo and in vitro SESI-MS data were pooled together to generate a SESI-MS volatilome for the three bacterial strains in this study, which yielded a total of 52 peaks for PAO1, 78 peaks for FRD1, and 131 peaks for RN450 (Table 2). For these three strains, only one quarter to one third of the total metabolome is shared between the in vitro and in vivo conditions we tested. In addition, less than half of the total SESI-MS volatile metabolome for FRD1 can be captured in vitro.
Figure 2.
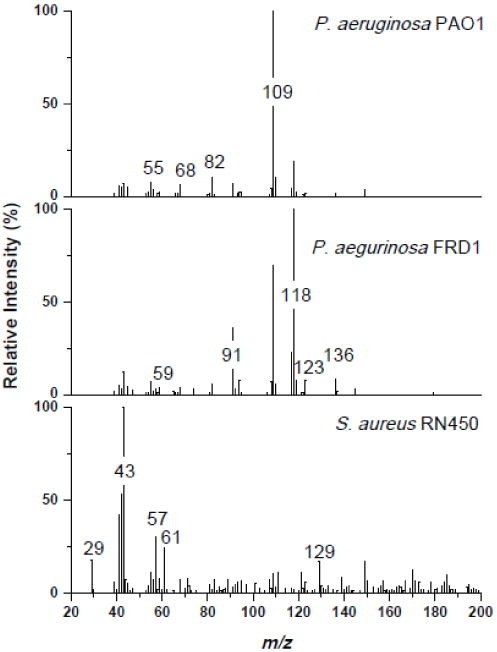
SESI-MS spectra of P. aeruginosa PAO1, FRD1, and S. aureus RN450, grown in vitro in TSB (24 h, 37°C)
Table 2.
Relationship between SESI-MS fingerprints of in vivo and in vitro bacterial volatiles
| Strains | Peaks observed
|
||
|---|---|---|---|
| In vivo only | In vitro only | In common | |
|
P. aeruginosa PAO1 |
19 (37%) | 20 (38%) | 13 (25%) |
|
P. aeruginosa FRD1 |
40 (51%) | 17 (22%) | 21 (27%) |
|
S. aureus RN450 |
18 (14%) | 68 (52%) | 45 (34%) |
The high degree of variation we observe between in vitro volatile fingerprints and in vivo breathprints could be attributed to a combination of factors. First, bacterial metabolism will change in response to a new environment [42], particularly when infecting a new host [43, 44]. For example, FRD1, a chronic lung infection isolate of P. aeruginosa, has acquired several mutations to become better suited to the host environment. Among these FRD1 adaptations are the loss of catabolic repression control (i.e., looser metabolic regulation) [45], which may account for the large number of in vivo-specific peaks it produces. In addition, hallmark volatiles that are present in vitro may not be measurable in breath. For instance, our data show that S. aureus RN450 loses almost two thirds of its in vitro SESI-MS fingerprint when compared to the murine lung infection breathprint (Table 2). A second set of factors influencing the in vivo breathprint of infection are the volatiles the host produces in response to the pathogen, which are challenging to predict based on in vitro bacterial data alone.
4. Conclusions
To the best of our knowledge, these are the first breath volatiles measured for P. aeruginosa PAO1, FRD1, and S. aureus RN450, and the first comparison of in vivo and in vitro VOC fingerprints from the same strains using the murine infection model. We have demonstrated that SESI-MS breathprinting can be used to diagnose the presence of lung infections, and can identify the pathogen down to the strain level. The in vivo breathprints, however, poorly reflect the pathogens’ in vitro volatile fingerprints, with only 25 – 34% of shared peaks between them. Our in vivo breathprinting study adds to the growing body of literature advancing the promise of successful breath-based diagnostics for infectious diseases; but also underscores the challenges of in vitro models to predict in vivo responses.
Acknowledgments
This project was supported by grants from the National Center for Research Resources (5P20RR021905-07) and the National Institute of General Medical Sciences (8 P20 GM103496-07) from the National Institutes of Health. We thank the Vermont Lung Center ventilation facility for providing the equipment for this study, Jenna Allard for her technical assistance for the mice work, and Frederick Naumann for help with breath collection.
References
- 1.Zhu J, Bean H, Kuo Y-M, Hill J. Fast detection of volatile organic compounds from bacterial cultures by secondary electrospray ionization-mass spectrometry. J Clin Microbiol. 2010;48:4426–31. doi: 10.1128/JCM.00392-10. [DOI] [PMC free article] [PubMed] [Google Scholar]
- 2.Casalinuovo I, Di Pierro D, Coletta M, Di Francesco P. Application of electronic noses for disease diagnosis and food spoilage detection. Sensors. 2006;6:1428–39. [Google Scholar]
- 3.Wilson A, Baietto M. Advances in electronic-nose technologies developed for biomedical applications. Sensors. 2011;11:1105–76. doi: 10.3390/s110101105. [DOI] [PMC free article] [PubMed] [Google Scholar]
- 4.Scott-Thomas A, Syhre M, Pattemore P, Epton M, Laing R, Pearson J, Chambers S. 2-Aminoacetophenone as a potential breath biomarker for Pseudomonas aeruginosa in the cystic fibrosis lung. BMC Pulm Med. 2010;10:56. doi: 10.1186/1471-2466-10-56. [DOI] [PMC free article] [PubMed] [Google Scholar]
- 5.Ulanowska A, Kowalkowski T, Hrynkiewicz K, Jackowski M, Buszewski B. Determination of volatile organic compounds in human breath for Helicobacter pylori detection by SPME-GC/MS. Biomed Chromatogr. 2011;25:391–7. doi: 10.1002/bmc.1460. [DOI] [PubMed] [Google Scholar]
- 6.Robroeks C, van Berkel J, Dallinga J, Jobsis Q, Zimmermann L, Hendriks H, Wouters M, van der Grinten C, van de Kant K, van Schooten F, Dompeling E. Metabolomics of volatile organic compounds in cystic fibrosis patients and controls. Pediatr Res. 2010;68:75–80. doi: 10.1203/PDR.0b013e3181df4ea0. [DOI] [PubMed] [Google Scholar]
- 7.Enderby B, Smith D, Carroll W, Lenney W. Hydrogen cyanide as a biomarker for Pseudomonas aeruginosa in the breath of children with cystic fibrosis. Pediatr Pulmonol. 2009;44:142–7. doi: 10.1002/ppul.20963. [DOI] [PubMed] [Google Scholar]
- 8.Robroeks C, Rosias P, van Vliet D, Jöbsis Q, Yntema J, Brackel H, Damoiseaux J, den Hartog G, Wodzig W, Dompeling E. Biomarkers in exhaled breath condensate indicate presence and severity of cystic fibrosis in children. Pediatr Allergy Immunol. 2008;19:652–9. doi: 10.1111/j.1399-3038.2007.00693.x. [DOI] [PubMed] [Google Scholar]
- 9.Shestivska V, Nemec A, Dřevínek P, Sovová K, Dryahina K, Španel P. Quantification of methyl thiocyanate in the headspace of Pseudomonas aeruginosa cultures and in the breath of cystic fibrosis patients by selected ion flow tube mass spectrometry. Rapid Commun Mass Spectrom. 2011;25:2459–67. doi: 10.1002/rcm.5146. [DOI] [PubMed] [Google Scholar]
- 10.Phillips M. Breath tests in medicine. Sci Am. 1992;267:74–9. doi: 10.1038/scientificamerican0792-74. [DOI] [PubMed] [Google Scholar]
- 11.Mukhopadhyay R. Don’t waste your breath. Anal Chem. 2004;76:273A–6A. [PubMed] [Google Scholar]
- 12.Phillips M, Herrera J, Krishnan S, Zain M, Greenberg J, Cataneo R. Variation in volatile organic compounds in the breath of normal humans. J Chromatogr B Biomed Appl. 1999;729:75–88. doi: 10.1016/s0378-4347(99)00127-9. [DOI] [PubMed] [Google Scholar]
- 13.Boshier P, Cushnir J, Priest O, Marczin N, Hanna G. Variation in the levels of volatile trace gases within three hospital environments: Implications for clinical breath testing. J Breath Res. 2010;4:031001. doi: 10.1088/1752-7155/4/3/031001. [DOI] [PubMed] [Google Scholar]
- 14.Savelev S, Perry J, Bourke S, Jary H, Taylor R, Fisher A, Corris P, Petrie M, De Soyza A. Volatile biomarkers of Pseudomonas aeruginosa in cystic fibrosis and noncystic fibrosis bronchiectasis. Lett Appl Microbiol. 2011;52:610–3. doi: 10.1111/j.1472-765X.2011.03049.x. [DOI] [PubMed] [Google Scholar]
- 15.Gilchrist F, Razavi C, Webb K, Jones A, Španěl P, Smith D, Lenney W. An investigation of suitable bag materials for the collection and storage of breath samples containing hydrogen cyanide. J Breath Res. 2012;6:036004. doi: 10.1088/1752-7155/6/3/036004. [DOI] [PubMed] [Google Scholar]
- 16.Cox C, Parker J. Use of 2-aminoacetophenone production in identification of Pseudomonas aeruginosa. J Clin Microbiol. 1979;9:479–84. doi: 10.1128/jcm.9.4.479-484.1979. [DOI] [PMC free article] [PubMed] [Google Scholar]
- 17.Labows J, McGinley K, Webster G, Leyden J. Headspace analysis of volatile metabolites of Pseudomonas aeruginosa and related species by gas chromatography-mass spectrometry. J Clin Microbiol. 1980;12:521–6. doi: 10.1128/jcm.12.4.521-526.1980. [DOI] [PMC free article] [PubMed] [Google Scholar]
- 18.Preti G, Thaler E, Hanson C, Troy M, Eades J, Gelperin A. Volatile compounds characteristic of sinus-related bacteria and infected sinus mucus: Analysis by solid-phase microextraction and gas chromatography-mass spectrometry. J Chromatogr B Biomed Appl. 2009;877:2011–8. doi: 10.1016/j.jchromb.2009.05.028. [DOI] [PubMed] [Google Scholar]
- 19.Scott-Thomas A, Pearson J, Chambers S. Potential sources of 2-Aminoacetophenone to confound the Pseudomonas aeruginosa breath test, including analysis of a food challenge study. J Breath Res. 2011;5:046002. doi: 10.1088/1752-7155/5/4/046002. [DOI] [PubMed] [Google Scholar]
- 20.Schmidt F, Metsälä M, Vaittinen O, Halonen L. Background levels and diurnal variations of hydrogen cyanide in breath and emitted from skin. J Breath Res. 2011;5:046004. doi: 10.1088/1752-7155/5/4/046004. [DOI] [PubMed] [Google Scholar]
- 21.Španel P, Dryahina K, Smith D. The concentration distributions of some metabolites in the exhaled breath of young adults. J Breath Res. 2007;1:026001. doi: 10.1088/1752-7155/1/2/026001. [DOI] [PubMed] [Google Scholar]
- 22.Syhre M, Chambers S. The scent of Mycobacterium tuberculosis. Tuberculosis. 2008;88:317–23. doi: 10.1016/j.tube.2008.01.002. [DOI] [PubMed] [Google Scholar]
- 23.Syhre M, Manning L, Phuanukoonnon S, Harino P, Chambers S. The scent of Mycobacterium tuberculosis – part II breath. Tuberculosis. 2009;89:263–6. doi: 10.1016/j.tube.2009.04.003. [DOI] [PubMed] [Google Scholar]
- 24.Filipiak W, Sponring A, Bauer M, Filipiak A, Ager C, Wiesenhofer H, Nagl M, Troppmair J, Amann A. Molecular analysis of volatile metabolites released specifically by Staphylococcus aureus and Pseudomonas aeruginosa. BMC Microbiol. 2012;12:113. doi: 10.1186/1471-2180-12-113. [DOI] [PMC free article] [PubMed] [Google Scholar]
- 25.Ding J, Yang S, Liang D, Chen H, Wu Z, Zhang L, Ren Y. Development of extractive electrospray ionization ion trap mass spectrometry for in vivo breath analysis. Analyst. 2009;134:2040–50. doi: 10.1039/b821497b. [DOI] [PubMed] [Google Scholar]
- 26.Martinez-Lozano P, de la Mora J. Electrospray ionization of volatiles in breath. Int J Mass Spectrom. 2007;265:68–72. [Google Scholar]
- 27.Martínez-Lozano P, Zingaro L, Finiguerra A, Cristoni S. Secondary electrospray ionization-mass spectrometry: Breath study on a control group. J Breath Res. 2011;5:016002. doi: 10.1088/1752-7155/5/1/016002. [DOI] [PubMed] [Google Scholar]
- 28.Chambers S, Scott-Thomas A, Epton M. Developments in novel breath tests for bacterial and fungal pulmonary infection. Curr Opin Pulm Med. 2012;18:228–32. doi: 10.1097/MCP.0b013e328351f98b. [DOI] [PubMed] [Google Scholar]
- 29.Thorn R, Greenman J. Microbial volatile compounds in health and disease conditions. J Breath Res. 2012;6:024001. doi: 10.1088/1752-7155/6/2/024001. [DOI] [PMC free article] [PubMed] [Google Scholar]
- 30.Smith D, Španěl P. Direct, rapid quantitative analyses of BVOCs using SIFT-MS and PTR-MS obviating sample collection. TrAC Trends in Analytical Chemistry. 2011;30:945–59. [Google Scholar]
- 31.Cao W, Duan Y. Current status of methods and techniques for breath analysis. Crit Rev Anal Chem. 2007;37:3–13. doi: 10.1080/10408347.2015.1055550. [DOI] [PubMed] [Google Scholar]
- 32.Dummer J, Storer M, Swanney M, McEwan M, Scott-Thomas A, Bhandari S, Chambers S, Dweik R, Epton M. Analysis of biogenic volatile organic compounds in human health and disease. TrAC Trends in Analytical Chemistry. 2011;30:960–7. [Google Scholar]
- 33.Fend R, Kolk A, Bessant C, Buijtels P, Klatser P, Woodman A. Prospects for clinical application of electronic-nose technology to early detection of Mycobacterium tuberculosis in culture and sputum. J Clin Microbiol. 2006;44:2039–45. doi: 10.1128/JCM.01591-05. [DOI] [PMC free article] [PubMed] [Google Scholar]
- 34.Pavlou A, Magan N, Jones J, Brown J, Klatser P, Turner A. Detection of Mycobacterium tuberculosis (TB) in vitro and in situ using an electronic nose in combination with a neural network system. Biosens Bioelectron. 2004;20:538–44. doi: 10.1016/j.bios.2004.03.002. [DOI] [PubMed] [Google Scholar]
- 35.Bean H, Zhu J, Hill J. Characterizing bacterial volatiles using secondary electrospray ionization mass spectrometry (SESI-MS) J Vis Exp. 2011;52 doi: 10.3791/2664. http://www.jove.com/details.php?id=2664. [DOI] [PMC free article] [PubMed] [Google Scholar]
- 36.Martínez-Lozano P, Rus J, Fernández de la Mora G, Hernández M, Fernández de la Mora J. Secondary electrospray ionization (SESI) of ambient vapors for explosive detection at concentrations below parts per trillion. J Am Soc Mass Spectrom. 2009;20:287–94. doi: 10.1016/j.jasms.2008.10.006. [DOI] [PubMed] [Google Scholar]
- 37.Allard J, Rinaldi L, Wargo M, Allen G, Akira S, Uematsu S, Poynter M, Hogan D, Rincon M, Whittaker L. Th2 allergic immune response to inhaled fungal antigens is modulated by TLR-4-independent bacterial products. Eur J Immunol. 2009;39:776–88. doi: 10.1002/eji.200838932. [DOI] [PMC free article] [PubMed] [Google Scholar]
- 38.Wargo M, Gross M, Rajamani S, Allard J, Lundblad L, Allen G, Vasil M, Leclair L, Hogan D. Hemolytic phospholipase c inhibition protects lung function during Pseudomonas aeruginosa infection. Am J Respir Crit Care Med. 2011;184:345–54. doi: 10.1164/rccm.201103-0374OC. [DOI] [PMC free article] [PubMed] [Google Scholar]
- 39.Martínez-Lozano P, de la Mora J. On-line detection of human skin vapors. J Am Soc Mass Spectrom. 2009;20:1060–3. doi: 10.1016/j.jasms.2009.01.012. [DOI] [PubMed] [Google Scholar]
- 40.Holloway B. Genetic recombination in Pseudomonas aeruginosa. J Gen Microbiol. 1955;13:572–81. doi: 10.1099/00221287-13-3-572. [DOI] [PubMed] [Google Scholar]
- 41.Ohman D, Chakrabarty A. Genetic mapping of chromosomal determinants for the production of the exopolysaccharide alginate in a Pseudomonas aeruginosa cystic fibrosis isolate. Infect Immun. 1981;33:142–8. doi: 10.1128/iai.33.1.142-148.1981. [DOI] [PMC free article] [PubMed] [Google Scholar]
- 42.Meyers L, Bull J. Fighting change with change: Adaptive variation in an uncertain world. Trends Ecol Evol. 2002;17:551–7. [Google Scholar]
- 43.Hooper L, Wong M, Thelin A, Hansson L, Falk P, Gordon J. Molecular analysis of commensal host-microbial relationships in the intestine. Science. 2001;291:881–4. doi: 10.1126/science.291.5505.881. [DOI] [PubMed] [Google Scholar]
- 44.Shi L, Sohaskey C, Kana B, Dawes S, North R, Mizrahi V, Gennaro M. Changes in energy metabolism of Mycobacterium tuberculosis in mouse lung and under in vitro conditions affecting aerobic respiration. Proc Natl Acad Sci U S A. 2005;102:15629–34. doi: 10.1073/pnas.0507850102. [DOI] [PMC free article] [PubMed] [Google Scholar]
- 45.Silo-Suh L, Suh S, Phibbs P, Ohman D. Adaptations of Pseudomonas aeruginosa to the cystic fibrosis lung environment can include deregulation of zwf, encoding glucose-6-phosphate dehydrogenase. J Bacteriol. 2005;187:7561–8. doi: 10.1128/JB.187.22.7561-7568.2005. [DOI] [PMC free article] [PubMed] [Google Scholar]
- 46.Bean H, Dimandja J-M, Hill J. Bacterial volatile discovery using solid phase microextraction and comprehensive two-dimensional gas chromatography–time-of-flight mass spectrometry. J Chromatogr B Biomed Appl. 2012;901:41–6. doi: 10.1016/j.jchromb.2012.05.038. [DOI] [PMC free article] [PubMed] [Google Scholar]
- 47.Rudzinski C, Herzig-Marx R, Lin J, Szpiro A, Johnson B. Pathogen detection using headspace analysis Scientific Conference on Chemical and Biological Defense Research.2004. [Google Scholar]
- 48.Wang T, Smith D, Španěl P. Selected ion flow tube, SIFT, studies of the reactions of H3O+ NO+ and O2+ with compounds released by Pseudomonas and related bacteria. Int J Mass Spectrom. 2004;233:245–51. [Google Scholar]
- 49.Dainty R, Edwards R, Hibbard C. Volatile compounds associated with the aerobic growth of some Pseudomonas species on beef. J Appl Bacteriol. 1984;57:75–81. doi: 10.1111/j.1365-2672.1984.tb02358.x. [DOI] [PubMed] [Google Scholar]
- 50.Zechman J, Labows J. Volatiles of Pseudomonas aeruginosa and related species by automated headspace concentration-gas-chromatography. Can J Microbiol. 1985;31:232–7. doi: 10.1139/m85-045. [DOI] [PubMed] [Google Scholar]
- 51.Junger M, Vautz W, Kuhns M, Hofmann L, Ulbricht S, Baumbach J, Quintel M, Perl T. Ion mobility spectrometry for microbial volatile organic compounds: A new identification tool for human pathogenic bacteria. Appl Microbiol Biotechnol. 2012;93:2603–14. doi: 10.1007/s00253-012-3924-4. [DOI] [PMC free article] [PubMed] [Google Scholar]
- 52.Thorn R, Reynolds D, Greenman J. Multivariate analysis of bacterial volatile compound profiles for discrimination between selected species and strains. in vitro J Microbiol Methods. 2011;84:258–64. doi: 10.1016/j.mimet.2010.12.001. [DOI] [PubMed] [Google Scholar]
- 53.Allardyce R, Langford V, Hill A, Murdoch D. Detection of volatile metabolites produced by bacterial growth in blood culture media by selected ion flow tube mass spectrometry (SIFT-MS) J Microbiol Methods. 2006;65:361–5. doi: 10.1016/j.mimet.2005.09.003. [DOI] [PubMed] [Google Scholar]
- 54.Allardyce R, Hill A, Murdoch D. The rapid evaluation of bacterial growth and antibiotic susceptibility in blood cultures by selected ion flow tube mass spectrometry. Diagn Microbiol Infect Dis. 2006;55:255–61. doi: 10.1016/j.diagmicrobio.2006.01.031. [DOI] [PubMed] [Google Scholar]
- 55.Carroll W, Lenney W, Wang T, Spanel P, Alcock A, Smith D. Detection of volatile compounds emitted by Pseudomonas aeruginosa using selected ion flow tube mass spectrometry. Pediatr Pulmonol. 2005;39:452–6. doi: 10.1002/ppul.20170. [DOI] [PubMed] [Google Scholar]
- 56.O’Hara M, Mayhew C. A preliminary comparison of volatile organic compounds in the headspace of cultures of Staphylococcus aureus grown in nutrient, dextrose and brain heart bovine broths measured using a proton transfer reaction mass spectrometer. J Breath Res. 2009;3 doi: 10.1088/1752-7155/3/2/027001. [DOI] [PubMed] [Google Scholar]
- 57.Shestivska V, Španěl P, Dryahina K, Sovová K, Smith D, Musílek M, Nemec A. Variability in the concentrations of volatile metabolites emitted by genotypically different strains of Pseudomonas aeruginosa. J Appl Microbiol. 2012;113:701–13. doi: 10.1111/j.1365-2672.2012.05370.x. [DOI] [PubMed] [Google Scholar]
- 58.Scotter J, Allardyce R, Langford V, Hill A, Murdoch D. The rapid evaluation of bacterial growth in blood cultures by selected ion flow tube-mass spectrometry (SIFT-MS) and comparison with the BacT/ALERT automated blood culture system. J Microbiol Methods. 2006;65:628–31. doi: 10.1016/j.mimet.2005.09.016. [DOI] [PubMed] [Google Scholar]