Abstract
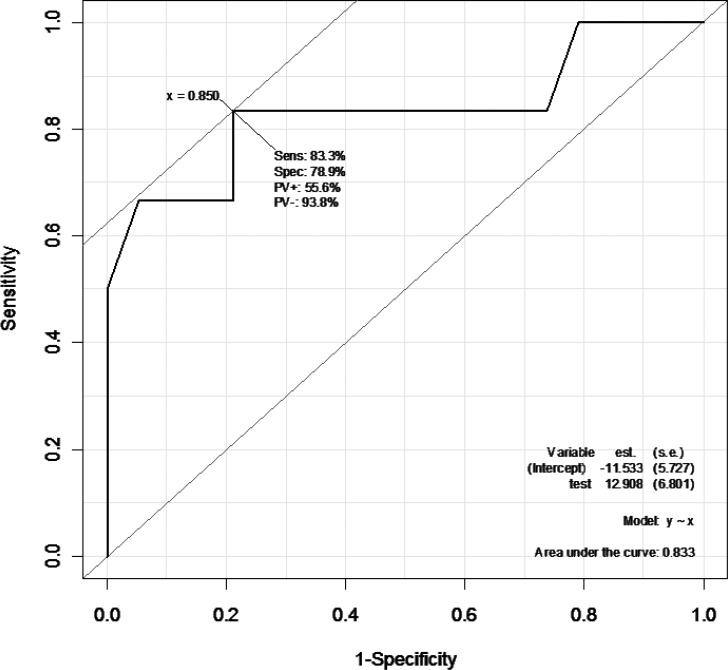
Neoadjuvant chemotherapy (NAC) is effective in down-staging a primary tumor before surgery, and quick differentiation between responders to NAC and nonresponders is needed. We investigated the utility of [18F]fluorodeoxyglucose positron emission tomography (FDG-PET) and computed tomography (CT) in evaluating the therapeutic effectiveness of NAC. We investigated 25 patients who underwent NAC for stage II and III noninflammatory breast cancer. FDG-PET/CT was undertaken before and after NAC to determine the maximum standardized uptake value (SUVmax) reduction rate. Findings were compared with postoperative histopathologic evaluation of therapeutic response. It was not possible to accurately assess tumor response to NAC using CT. However, using the SUVmax reduction rate, we noted a significant difference (P = 0.0420) between patients who were responsive and nonresponsive to NAC. The sensitivity and specificity were as high as 83.3% and 78.9%, respectively. This study demonstrated that FDG-PET/CT can differentiate responders from nonresponders. This improves patient management by avoiding unnecessary chemotherapy.
Key words: Breast cancer, Neoadjuvant chemotherapy, Diagnostic imaging, Positron emission tomography, Computed tomography
Breast cancer is currently the most prevalent malignant disease affecting women in Japan, and the incidence rate is increasing rapidly. While the mortality rate has declined slightly in the United States and Europe, it is still rising in Japan.
In recent years, neoadjuvant chemotherapy (NAC) has been increasingly used for the treatment of locally advanced breast cancer and has improved the chances of preserving the breast.1–3 Evaluation of the therapeutic effects after chemotherapy is important, and modalities used for this purpose include ultrasound, computed tomography (CT), and magnetic resonance imaging (MRI). These diagnostic imaging methods involve the use of morphologic diagnostic imaging to assess the size of the tumor.4
Positron emission tomography (PET)-CT scans have recently gained popularity as an effective functional diagnostic imaging method in the clinical management of cancer.5 [18F]fluorodeoxyglucose (FDG)-PET is superior to other morphologic diagnostic imaging methods, including ultrasound, CT, and MRI, from the perspective of tumor cell activity. This activity can be quantified and assessed by means of FDG uptake.
Evaluation of the therapeutic effects of NAC using FDG-PET/CT is useful, although in the case of breast cancer, identification of the primary lesion and diagnosis of lymph node metastasis is limited.5 This is because the number of false positives may be increased because of FDG accumulation as a result of inflammation. However, it has been hypothesized that intercomparison of standard uptake values (SUV) can be useful in evaluating the effects of chemotherapy. In the present study, we investigated the utility of FDG-PET in evaluating the therapeutic effects of initial NAC for breast cancer patients treated at our facility.
Patients and Methods
Patient background
A total of 204 patients were pathologically diagnosed with breast cancer with clinical stage II (IIA and IIB) or stage III (IIIA, IIIB, and IIIC) at the hospital between 2007 and 2010. We investigated 25 patients who underwent NAC. Patients with inflammatory breast cancer were excluded. Breast cancer was diagnosed using core needle biopsy. Clinical staging of the tumor was described according to the TNM classification. PET/CT scans were carried out before and after NAC and comparatively examined by means of postoperative histopathology. All patients gave informed consent for study participation as approved by the institutional review board of the hospital.
Chemotherapy regimens
Chemotherapy drugs were administered as follows: epirubicin and cyclophosphamide (EC), paclitaxel (TXL), or docetaxel (TXT) in 15 cases; EC + TXL + trastuzmab (anti-HER2) in 9 cases; and fluorouracil, epirubicin, and cyclophosphamide (FEC) in 1 case. Dosage was determined based on the Japanese Breast Cancer Society clinical practice guidelines for breast cancer. The doses used in the chemotherapy regimens were as follows: EC: epirubicin 100 mg/m2 and cyclophosphamide 600 mg/m2 (every 3 weeks); FEC: fluorouracil 500 mg/m2, epirubicin 100 mg/m2, and cyclophosphamide 500 mg/m2 (every 3 weeks); TXL: paclitaxel 80 mg/m2 (every week); TXT: docetaxel 75 mg/m2 (every 3 weeks); and anti-HER2: trastuzumab at an initial dose of 8 mg/kg, and second and subsequent doses of 6 mg/kg (every 3 weeks), or at an initial dose of 4 mg/kg, and second and subsequent doses of 2 mg/kg (every week).
Analysis using PET/CT
The 25 patients enrolled in our study underwent PET/CT scans before and after NAC. The fasting period prior to scanning was 6 hours. Blood glucose concentration was measured immediately before FDG administration. FDG dosage was based on body weight. Patients weighing <55 kg received FDG intravenously at a dose of 4 MBq/kg, and those weighing >55 kg received FDG intravenously at a dose of 222 MBq/kg. PET/CT scans were obtained at 1 hour after administration of FDG using a Siemens Biograph LSO/Sensation 16 (Siemens, Erlangen, Germany). Patients were placed in a supine position with both arms raised above their heads. The range of imaging included the skull through to the mid-thigh. Transverse, coronal, and sagittal section PET/CT images were interpreted by 2 radiologists.
Surgery
Following NAC, partial or radical mastectomy was performed. In the case of partial mastectomy, a rapid pathologic diagnosis of the specimen margin in 4 radial directions was conducted during surgery; in the event of a positive margin being detected, further excision was performed. If a positive margin was found on further excision, then surgery was not undertaken, and a total mastectomy was performed. Axillary dissection was carried out in 11 cases with positive sentinel lymph node biopsy results or with positive axillary lymph nodes. Axillary dissection was not performed in 14 cases with negative intraoperative sentinel lymph node biopsy results. Sentinel lymph node biopsy was conducted using the radioisotope method or indigo carmine staining.
Radiation therapy
Patients who underwent partial mastectomy received radiation therapy involving the preserved breast after surgery. Patients with thoracic wall invasion (T4a or T4c) prior to NAC underwent postoperative radiation therapy involving the chest wall. Patients with over 4 axillary lymph nodes prior to NAC underwent postoperative radiation therapy involving the armpit.
Evaluation of the effects of NAC
The therapeutic effects of NAC were evaluated by means of FDG-PET/CT and postoperative histopathologic findings. Postoperative histopathologic evaluation was carried out in accordance with the Clinical Practice Guidelines on Treating Breast Cancer published by the Japanese Breast Cancer Society. The therapeutic effects were classified as follows:
-
1.
Grade 1 (slightly effective)
Grade 1a (mildly effective: when slight changes in cancer cells are observed irrespective of surface area; when a high degree of change is observed in <1/3 of cancer cells.)
Grade 1b (moderately effective: when a high degree of change is observed in >1/3 and <2/3 of cancer cells.)
-
2.
Grade 2 (considerably effective)
Grade 2a (highly effective: when a high degree of change is observed in over 2/3 of cancer cells; however, a distinct cancer nest is observed.)
Grade 2b (extremely effective: effects are quite close to those seen in a grade 3 complete response, but with a few cancer cells remaining.)
-
3.
Grade 3 (complete response: when all cancer cells have either undergone necrosis or disappeared, and a transition to granulation tissue or nest fibrosis occurs.)
As a general rule, the therapeutic effects were determined by infiltrative changes only, without regard for the presence or absence of residual cancer cells in the lactiferous duct.
The maximum diameter of the tumor was measured before and after NAC on CT to calculate the tumor reduction rate, as follows:
 |
The maximum SUV (SUVmax) before and after NAC was measured using FDG-PET/CT to calculate the SUVmax reduction rate:
 |
The mean SUVmax reduction rate was calculated for each grade and compared. In addition, the mean tumor reduction rate on CT was calculated for each grade and compared.
Results
Characteristics of the 25 patients and primary lesions are shown in Tables 1 and 2. Histologic classification of tumors included 24 cases of invasive ductal carcinoma and 1 case of invasive lobular carcinoma. Hormone receptors comprised the following: 16 ER-positive cases; 11 PgR-positive cases; and 9 HER2-positive cases.
Table 1.
Patient characteristics
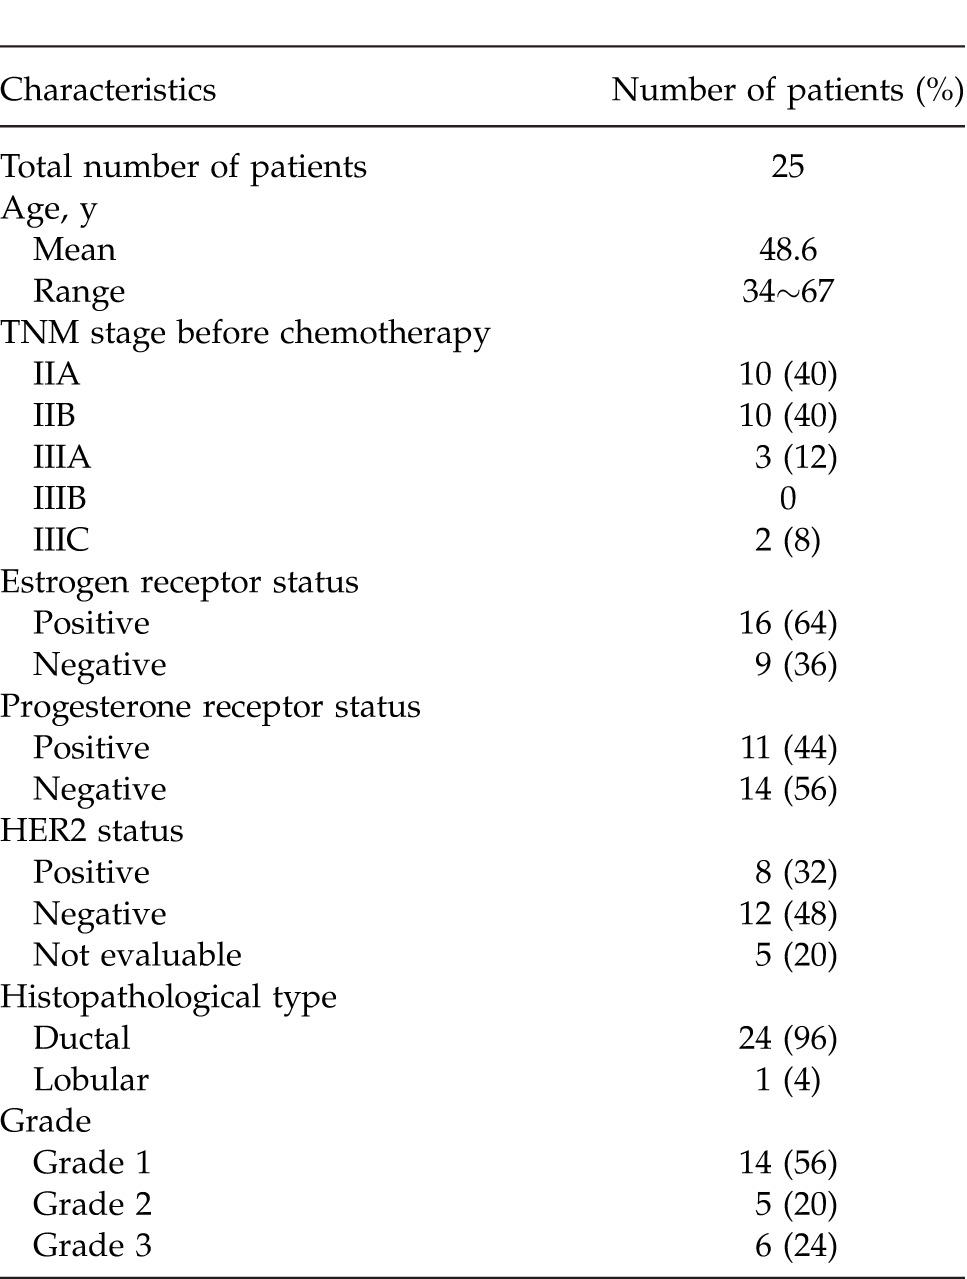
Table 2.
Details of clinical, CT, and FDG-PET parameters before and after chemotherapy and correlation with pathologic response
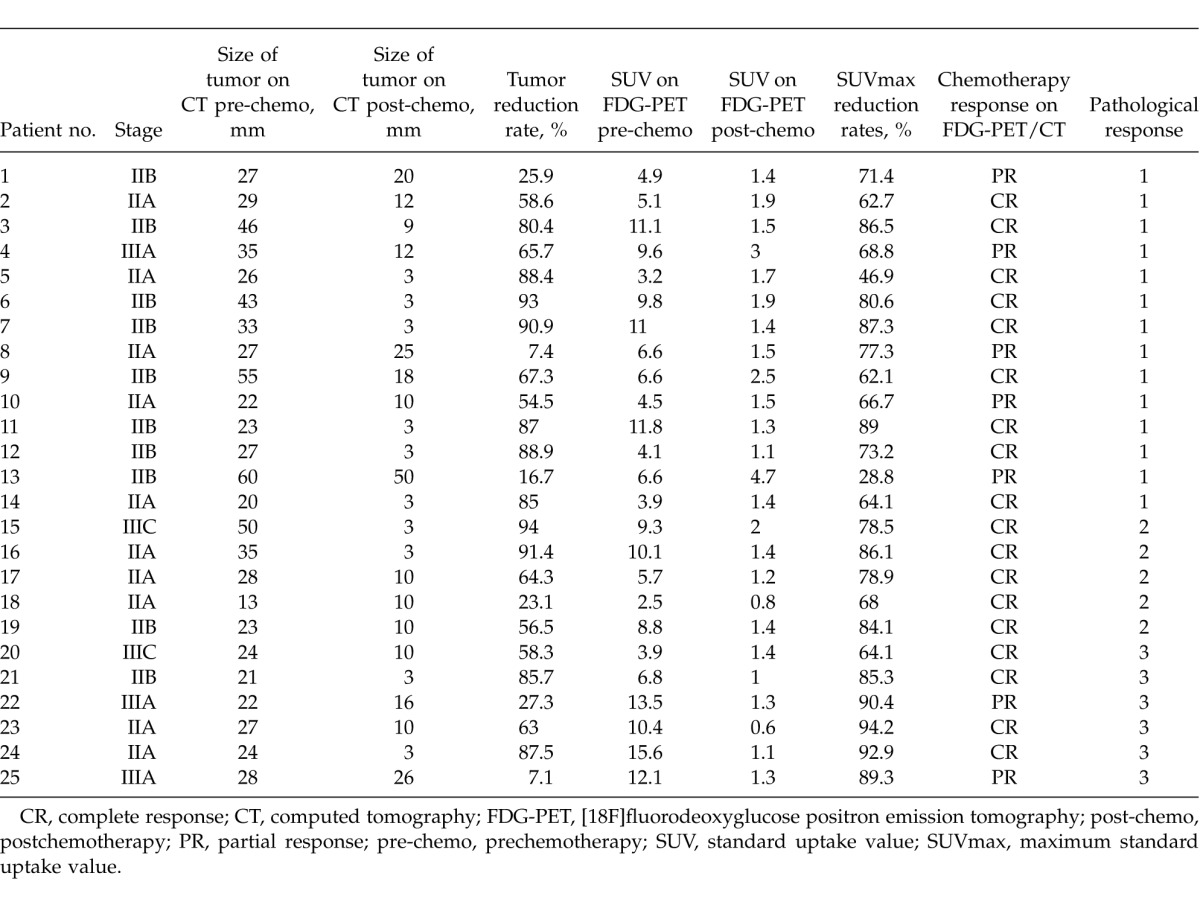
The mean maximum tumor diameter on CT was measured as being 30.7 (valve ranges, 13–60) mm prior to NAC and 6.8 (valve ranges, 10–50) mm after NAC. The SUV max for the primary lesion on PET was 7.9 (valve ranges, 2.5–15.6) mm prior to NAC and 1.6 (valve ranges, 0.8–4.7) mm after NAC (Fig. 1). The therapeutic outcomes evaluated on PET/CT included 7 cases (28%) with a partial response, 18 cases (72%) with a complete response, 0 cases with stable disease, and 0 cases with progressive disease. Clinical evaluation of chemotherapy was described according to the Response Evaluation Criteria in Solid Tumors Guidelines (RECIST). Histologic evaluation involved 14 cases (56%) with grade 1 therapeutic effects, 5 cases (20%) with grade 2 therapeutic effects, and 6 (24%) cases with grade 3 therapeutic effects.
Fig. 1.
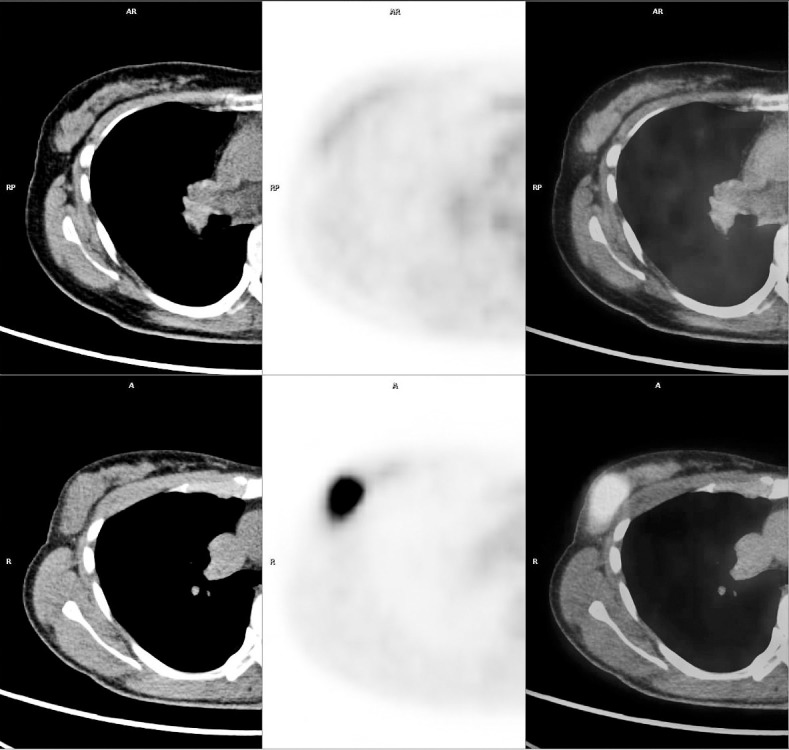
Axial CT, PET, and PET/CT images of prechemotherapy (upper row) and postchemotherapy (lower row) used in the evaluation of patient 25. Almost no change in tumor diameter was observed before (28 mm) and after (26 mm) NAC (reduction rate: 7.14), but a clear reduction in the SUVmax was observed (before NAC, 12.1; after NAC, 1.3; reduction rate, 89.25). Postoperative histologic findings revealed some inflammatory cells, the appearance of macrophages, edematous changes, and mild degeneration; the therapeutic response was determined to be grade 3. Although the tumor persisted on CT, tumor cell activity (viability) was almost nil, demonstrating the usefulness of FDG-PET.
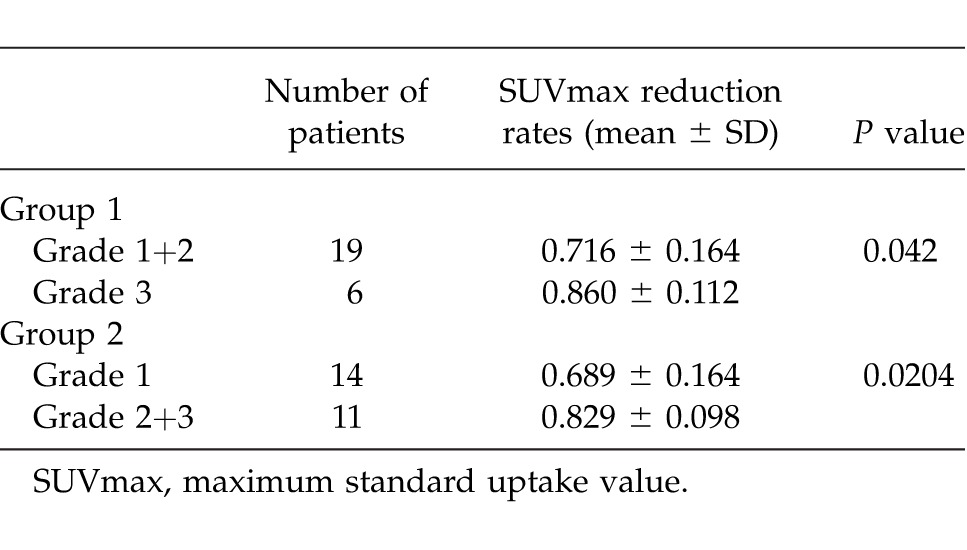
A comparison of SUVmax reduction rates between each grade (1, 2, and 3) is shown in Table 3. The SUVmax reduction rates for each grade were as follows (expressed as the mean ± SD): grade 1, 0.689 ± 0.164; grade 2, 0.791 ± 0.070; and grade 3, 0.860 ± 0.112. No significant difference was observed between grades 1 and 2 (P = 0.2018). In addition, no significant difference was observed between grades 2 and 3 (P = 0.2641), although a significant difference was observed between grades 1 and 3 (P = 0.0325). Moreover, the grades were divided into 2 groups (grades 1 + 2 and grade 3, grade 1 and grades 2 + 3) and compared (Table 4). On comparing grades 1 + 2 (19 cases) and grade 3 (6 cases), a significant difference was observed between the 2 groups (P = 0.0420). Furthermore, on comparing grade 1 (14 cases) and grades 2 + 3 (11 cases), a significant difference was also observed (P = 0.0204).
Table 3.
Comparison of SUVmax reduction rates between each grade of therapeutic response

Table 4.
Comparison of SUVmax reduction rates between the two therapeutic response groups
The tumor diameter reduction rates (expressed as mean ± SD) using CT for each grade (1, 2, and 3) were as follows: grade 1, 64.9% ± 29.1%; grade 2, 65.8% ± 28.9%; and grade 3, 54.8% ± 32.0%. No significant difference in reduction rate was observed between grades 1 and 2 (P = 0.9543), grades 2 and 3 (P = 0.5674), and grades 1 and 3 (P = 0.4960). On comparing the reduction rates for grades 1 + 2 (19 cases) and grade 3 (6 cases), no significant difference was observed (P = 0.4540); upon comparing grade 1 (14 cases) and grades 2 + 3 (11 cases), no significant difference was observed (P = 0.6681).
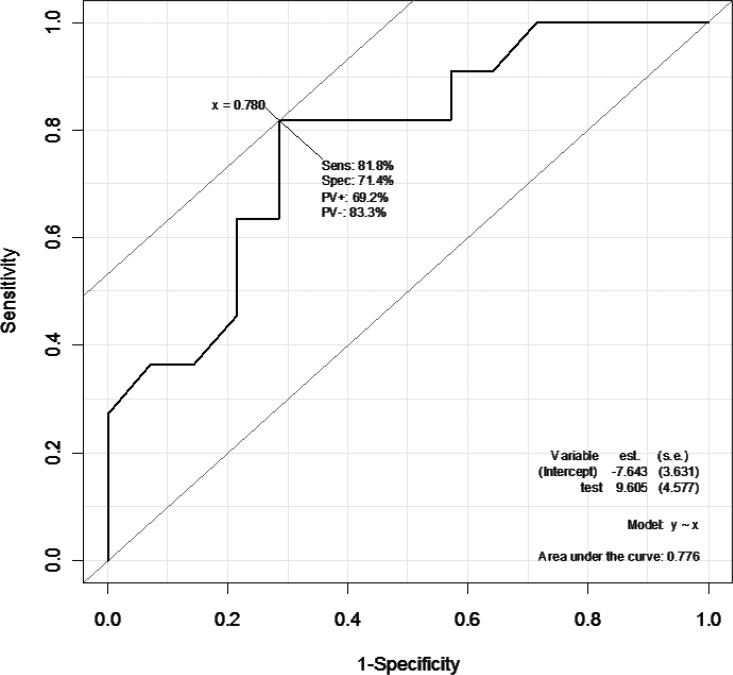
Furthermore, to predict if subjects were responders or nonresponders in terms of postoperative histologic effects using the SUVmax reduction rate, a receiver operating characteristic curve was plotted to estimate a cutoff value (Figs. 2 and 3). When grade 3 patients were identified as responders and grades 1 and 2 as nonresponders, the cutoff value was set at an SUVmax reduction rate of 85%; in detecting responders, the sensitivity and specificity were 83.3% and 78.9%, respectively, with an area under the curve (AUC) value of 0.833 (Fig. 2). When grades 2 and 3 were identified as responders and grade 1 as nonresponders, the cutoff value was set at an SUVmax reduction rate of 78%, and in detecting responders the sensitivity and specificity were 81.8% and 71.4%, respectively, with an AUC value of 0.776 (Fig. 3).
Fig. 2.
When grade 3 subjects were identified as responders and grades 1 and 2 as nonresponders, the cutoff value was set at an SUVmax reduction rate of 85%. In detecting responders, the sensitivity and specificity were 83.3% and 78.9%, respectively. The AUC was 0.833.
Fig. 3.
When grade 2 and 3 patients were identified as responders and grade 1 as nonresponders, the cutoff value was set at an SUVmax reduction rate of 78%. In detecting responders, the sensitivity and specificity were 81.8% and 71.4%, respectively. The AUC was 0.776.
Discussion
In recent years, an increase in the rate of breast preservation has come to be expected because of tumor reduction using NAC for locally advanced breast cancer.1–3 In addition, a relationship between pathologic evaluation following NAC and the postoperative survival rate has been indicated.6,7 Rastogi et al8 reported that patients that achieved a pathologic complete response (pCR) after NAC had a higher disease-free survival rate and overall survival rate than patients who did not. Thus, it is very important to accurately determine the effects of NAC.
Modalities used in the evaluation of the effects of NAC include conventional morphologic diagnostic imaging such as mammography, ultrasound, CT, and MRI. These modalities allow the tumor reduction rate to be measured following completion of NAC to determine therapeutic outcomes. Vinnicombe et al9 carried out a comparative study of the effects of NAC using pathologic evaluation, mammography, or MRI; they reported that MRI was the most accurate of the three modalities. In another comparative study of the effects of NAC using mammography, ultrasound, CT, or pathologic evaluation, Kanazawa et al10 found a significant correlation between CR and pCR using CT. However, after NAC, the disappearance of tumor cells and the transformation to granular or fibrous tissue could be seen on ultrasound examination at low echo intensities and in weakly enhancing regions on CT, and could easily give false-positive results.10
It is impossible to distinguish between tumor fibrosis caused by chemotherapy and residual lesions using morphologic diagnostic imaging.4 In recent years there have been many reports describing the evaluation of NAC using FDG-PET/CT.4,11–25 FDG-PET diagnostic imaging involves the simultaneous uptake of FDG and glucose. Unlike conventional morphologic diagnostic imaging, FDG-PET is a functional diagnostic imaging technique that quantifies and evaluates cancer cell activity by measuring the SUVmax reduction rate before and after chemotherapy.
In our study, we performed FDG-PET/CT scans before and after NAC to calculate the SUVmax reduction rate using FDG-PET and the reduction rate of the maximum tumor diameter using CT, and compared them with postoperative pathologic findings. With regard to the SUV value on FDG-PET, we noted a significant difference between patients with grades 1 and 3 therapeutic responses. Furthermore, on comparing the two groups, we observed a significant difference between grades 1 + 2 and grade 3, and between grade 1 and grades 2 + 3.
With regard to the reduction rate of the maximum tumor diameter on CT, grade 2 therapeutic responders showed the highest reduction rate. However, there was no significant difference in the reduction rate of the maximum tumor diameter observed. Thus, we believe that in FDG-PET examinations, the use of a relative value such as the SUVmax reduction rate is useful in the evaluation of chemotherapy.
Avril et al23 evaluated the accuracy of FDG-PET diagnostic imaging in breast cancer and reported a rate of 68.2% for pT1, 91.9% for pT2, and 100% for pT3, depending on the tumor size; they also noted that small tumors such as pT1 were difficult to detect on PET scans. In case 11 in their study, the tumor had almost disappeared on CT following NAC, and may not have been detectable on FDG-PET since the lesion was small.
In the current study, we plotted a receiver operating characteristic curve and set an SUV reduction rate cutoff rate to predict a histologic response. In a manner similar to the present study, Kim et al4 comparatively studied the SUV reduction rate and postoperative histologic findings before and after NAC. When the cutoff value was set at 79% in diagnosing patients as responders or nonresponders, these authors noted a sensitivity of 85.2% and specificity of 82.6%.4 Similar sensitivity and specificity findings were obtained in the present study.
The criteria for histologic evaluation of therapeutic effects differed between our study and that of Kim et al.4 These authors divided the histologic evaluation of therapeutic effects into 3 groups (pNR: no effect; pPR: gross or microscopic residual tumor; and pCR: disappearance of tumor cells), with pPR and pCR indicating a responder and pNR a nonresponder. We classified our evaluations into grades 1 to 3 in accordance with the Clinical Practice Guidelines on Treating Breast Cancer published by the Japanese Breast Cancer Society. We also determined cutoff values when grade 3 indicated a responder and grades 1 and 2 a nonresponder, and when grades 2 and 3 indicated a responder and grade 1 a nonresponder. In this way, when the histologic evaluation was consistent, the cutoff value may have differed.
In 1993, Wahl et al11 reported that tumor cell activity represented by FDG uptake was reduced before the tumor shrank in chemotherapy for breast cancer. They carried out FDG-PET and mammography on 11 breast cancer patients undergoing their first, second, and third course of chemotherapy. They comparatively studied the tumor diameter reduction rate on mammography and postoperative histologic findings regarding the SUVmax reduction rate. In the 8 patients judged as having a postoperative histologic response, it was noted that a reduction in SUV commenced from day 8 of the first course of chemotherapy.11 Subsequently, several studies have conducted FDG-PET during chemotherapy for breast cancer, and also evaluated the early effects of chemotherapy using this modality.13–16,18–22 If the effects of chemotherapy can be evaluated early, patients who do not respond to treatment can be extracted early, allowing for the regimen to be altered or discontinued so that unnecessary chemotherapy can be avoided.
Rousseau et al15 conducted a study on 64 breast cancer patients and claimed that FDG-PET/CT should be carried out after the second course of NAC. They also reported that if the SUVmax reduction rate had a cutoff value of 40% after the second course, in diagnosing responders and nonresponders the sensitivity, specificity, and accuracy rates were 89%, 95%, and 87%, respectively. A study involving 104 breast cancer patients who underwent FDG-PET scans after the first and second NAC course reported that if the SUVmax reduction rate after the first course of NAC had a cutoff value of 45%, then responder detection had a sensitivity and specificity of 73% and 63%, respectively; if the SUV reduction rate after the second course of NAC was 55%, then sensitivity and specificity were 69% and 63%, respectively.19 A study conducted on 34 breast cancer patients and involving FDG-PET scans after the second course of NAC found that if the SUV reduction rate had a cutoff value of 50%, then sensitivity, specificity, and accuracy rates were 100%, 30%, and 44%, respectively, in diagnosing responders and nonresponders.22
While there have been a considerable number of reports that have discussed whether FDG-PET should be carried out to evaluate the effects of chemotherapy after each course, the prevailing opinion is that it should only be carried out after the first and second courses. However, the cutoff value for the SUV reduction rate regarding the diagnosis of responders and nonresponders varies in different reports. The main reason for this is that the histologic criteria used to evaluate therapeutic effects vary in different studies. The Miller-Payne, Honkoop, and Stalatoff criteria are commonly used in these evaluations. Rousseau et al15 used the Sataloff criteria, Schwarz-Dose et al19 used the Honkoop criteria, and Martoni et al22 used the Miller-Payne criteria to conduct histologic evaluations of therapeutic effects. Moreover, Martoni et al22 not only evaluated the therapeutic effects on the main lesion, but also took into consideration the effects on axillary lymph nodes.
In the future, when carrying out early evaluations on the effects of NAC by means of FDG-PET scans, we will need to standardize the histologic evaluation criteria as well as whether the effects on axillary lymph nodes should be included. We should also include more subjects in future studies.
Conclusion
This study demonstrated the predictive value of FDG-PET for the assessment of the histologic response of primary breast cancer after NAC. However, the optimum cutoff value for the SUV reduction rate is still not clearly defined. So, we will need to standardize the histologic evaluation criteria.
Acknowledgments
The authors declare that there is no conflict of interest.
References
- 1.Fisher B, Brown A, Mamounas E, Wieand S, Robidoux A, Margolese RG, et al. Effect of preoperative chemotherapy on local-regional disease in women with operable breast cancer: findings from National Surgical Adjuvant Breast and Bowel Project B-18. J Clin Oncol. 1997;15(7):2483–2493. doi: 10.1200/JCO.1997.15.7.2483. [DOI] [PubMed] [Google Scholar]
- 2.Honkoop AH, van Diest PJ, de Jong JS, Linn SC, Giaccone G, Hoekman K, et al. Prognostic role of clinical, pathological and biological characteristics in patients with locally advanced breast cancer. Br J Cancer. 1998;77(4):621–626. doi: 10.1038/bjc.1998.99. [DOI] [PMC free article] [PubMed] [Google Scholar]
- 3.Vlastos G, Mirza NQ, Lenert JT, Hunt KK, Ames FC, Feig BW, et al. The feasibility of minimally invasive surgery for stage IIA, IIB and IIIA breast carcinoma patients after tumor downstaging with induction chemotherapy. Cancer. 2000;88(6):1417–1424. doi: 10.1002/(sici)1097-0142(20000315)88:6<1417::aid-cncr20>3.0.co;2-1. [DOI] [PubMed] [Google Scholar]
- 4.Kim SJ, Kim SK, Lee ES, Ro J, Kang S. Predictive value of [18F]FDG PET for pathological response of breast cancer to neo-adjuvant chemotherapy. Ann Oncol. 2004;15(9):1352–1357. doi: 10.1093/annonc/mdh345. [DOI] [PubMed] [Google Scholar]
- 5.Inokuchi M, Furukawa H, Kayahara M, Ohta T, Kawashima H, Taki J, et al. The role of 18FDG PET/CT for the initial staging and therapy in primary breast cancer [in Japanese] Gan To Kagaku Ryoho. 2009;36(13):2526–2531. [PubMed] [Google Scholar]
- 6.Eltahir A, Heys SD, Hutcheon AW, Sarkar TK, Smith I, Walker LG, et al. Treatment of large and locally advanced breast cancers using neoadjuvant chemotherapy. Am J Surg. 1998;175(2):127–132. doi: 10.1016/s0002-9610(97)00279-1. [DOI] [PubMed] [Google Scholar]
- 7.Machiavelli MR, Romero AO, Pérez JE, Lacava JA, Domínguez ME, Rodríguez R, et al. Prognostic significance of pathological response of primary tumor and metastatic axillary lymph nodes after neoadjuvant chemotherapy for locally advanced breast carcinoma. Cancer J Sci Am. 1998;4(2):125–131. [PubMed] [Google Scholar]
- 8.Rastogi P, Anderson SJ, Bear HD, Geyer CE, Kahlenberg MS, Robidoux A, et al. Preoperative chemotherapy: updates of National Surgical Adjuvant Breast and Bowel Project Protocols B-18 and B-27. J Clin Oncol. 2008;26(5):778–785. doi: 10.1200/JCO.2007.15.0235. Erratum in: J Clin Oncol 2008;26(16):2793. [DOI] [PubMed] [Google Scholar]
- 9.Vinnicombe SJ, MacVicar AD, Guy RL, Sloane JP, Powles TJ, Knee G, et al. Primary breast cancer: mammographic changes after neoadjuvant chemotherapy, with pathologic correlation. Radiology. 1996;198(2):333–340. doi: 10.1148/radiology.198.2.8596827. [DOI] [PubMed] [Google Scholar]
- 10.Kanazawa T, Akashi-Tanaka S, Iwamoto E, Takasugi M, Shien T, Kinoshita T, et al. Diagnosis of complete response to neoadjuvant chemotherapy using diagnostic imaging in primary breast cancer patients. Breast J. 2005;11(5):311–316. doi: 10.1111/j.1075-122X.2005.00003.x. [DOI] [PubMed] [Google Scholar]
- 11.Wahl RL, Zasadny K, Helvie M, Hutchins GD, Weber B, Cody R. Metabolic monitoring of breast cancer chemohormonotherapy using positron emission tomography: initial evaluation. J Clin Oncol. 1993;11(11):2101–2111. doi: 10.1200/JCO.1993.11.11.2101. [DOI] [PubMed] [Google Scholar]
- 12.Bassa P, Kim EE, Inoue T, Wong FC, Korkmaz M, Yang DJ, et al. Evaluation of preoperative chemotherapy using PET with fluorine-18-fluorodeoxyglucose in breast cancer. J Nucl Med. 1996;37(6):931–938. [PubMed] [Google Scholar]
- 13.Smith IC, Welch AE, Hutcheon AW, Miller ID, Payne S, Chilcott F, et al. Positron emission tomography using [18F]-fluorodeoxy-D-glucose to predict the pathologic response of breast cancer to primary chemotherapy. J Clin Oncol. 2000;18(8):1676–1688. doi: 10.1200/JCO.2000.18.8.1676. [DOI] [PubMed] [Google Scholar]
- 14.Schelling M, Avril N, Nährig J, Kuhn W, Römer W, Sattler D, et al. Positron emission tomography using [18F]-fluorodeoxyglucose for monitoring primary chemotherapy in breast cancer. J Clin Oncol. 2000;18(8):1689–1695. doi: 10.1200/JCO.2000.18.8.1689. [DOI] [PubMed] [Google Scholar]
- 15.Rousseau C, Devillers A, Sagan C, Ferrer L, Bridji B, Campion L, et al. Monitoring of early response to neoadjuvant chemotherapy in stage II and III breast cancer by [18F]-fluorodeoxyglucose positron emission tomography. J Clin Oncol. 2006;24(34):5366–5372. doi: 10.1200/JCO.2006.05.7406. [DOI] [PubMed] [Google Scholar]
- 16.McDermott GM, Welch A. Staff RT, Gilbert FJ, Schweiger L, Semple SI et al. Monitoring primary breast cancer throughout chemotherapy using FDG-PET. Breast Cancer Res Treat. 2007;102(1):75–84. doi: 10.1007/s10549-006-9316-7. [DOI] [PubMed] [Google Scholar]
- 17.Li D, Yao Q, Li L, Wang L, Chen J. Correlation between hybrid 18F-FDG PET/CT and apoptosis induced by neoadjuvant chemotherapy in breast cancer. Cancer Biol Ther. 2007;6(9):1442–1448. doi: 10.4161/cbt.6.9.4621. [DOI] [PubMed] [Google Scholar]
- 18.Berriolo-Riedinger A, Touzery C, Riedinger JM, Toubeau M, Coudert B, Arnould L, et al. [18F]-FDG-PET predicts complete pathological response of breast cancer to neoadjuvant chemotherapy. Eur J Nucl Med Mol Imaging. 2007;34(12):1915–1924. doi: 10.1007/s00259-007-0459-5. [DOI] [PubMed] [Google Scholar]
- 19.Schwarz-Dose J, Untch M, Tiling R, Sassen S, Mahner S, Kahlert S, et al. Monitoring primary systemic therapy of large and locally advanced breast cancer by using sequential positron emission tomography imaging with [18F]-fluorodeoxyglucose. J Clin Oncol. 2009;27(4):535–541. doi: 10.1200/JCO.2008.17.2650. [DOI] [PubMed] [Google Scholar]
- 20.Kumar A, Kumar R, Seenu V, Gupta SD, Chawla M, Malhotra A, et al. The role of 18F-FDG PET/CT in evaluation of early response to neoadjuvant chemotherapy in patients with locally advanced breast cancer. Eur Radiol. 2009;19(6):1347–1357. doi: 10.1007/s00330-009-1303-z. [DOI] [PubMed] [Google Scholar]
- 21.Duch J, Fuster D, Muñoz M, Fernández PL, Paredes P, Fontanillas M, et al. 18F-FDG PET/CT for early prediction of response to neoadjuvant chemotherapy in breast cancer. Eur J Nucl Med Mol Imaging. 2009;36(10):1551–1557. doi: 10.1007/s00259-009-1116-y. [DOI] [PubMed] [Google Scholar]
- 22.Martoni AA, Zamagni C, Quercia S, Rosati M, Cacciari N, Bernardi A, et al. Early [18]F-2-fluoro-2-deoxy-d-glucose positron emission tomography may identify a subset of patients with estrogen receptor-positive breast cancer who will not respond optimally to preoperative chemotherapy. Cancer. 2010;116(4):805–813. doi: 10.1002/cncr.24820. [DOI] [PubMed] [Google Scholar]
- 23.Avril N, Rosé CA, Schelling M, Dose J, Kuhn W, Bense S, et al. Breast imaging with positron emission tomography and fluorine-18 fluorodeoxyglucose: use and limitations. Clin Oncol. 2000;18(20):3495–3502. doi: 10.1200/JCO.2000.18.20.3495. [DOI] [PubMed] [Google Scholar]
- 24.Ogston KN, Miller ID, Payne S, Hutcheon AW, Sarkar TK, Smith I, et al. A new histological grading system to assess response of breast cancers to primary chemotherapy: prognostic significance and survival. Breast. 2003;12(5):320–327. doi: 10.1016/s0960-9776(03)00106-1. [DOI] [PubMed] [Google Scholar]
- 25.Sataloff DM, Mason BA, Prestipino AJ, Seinige UL, Lieber CP, Baloch Z. Pathologic response to induction chemotherapy in locally advanced carcinoma of the breast: a determinant of outcome. J Am Coll Surg. 1995;180(3):297–306. [PubMed] [Google Scholar]


