Abstract
Ion mobility spectrometry in conjunction with liquid chromatography separations and mass spectrometry offers a range of new possibilities for analyzing complex biological samples. To fully utilize the information obtained from these three measurement dimensions, informatics tools based on the accurate mass and time tag methodology were modified to incorporate ion mobility spectrometry drift times for peptides observed in human serum. In this work a reference human serum database was created for 12,139 peptides and populated with the monoisotopic mass, liquid chromatography normalized elution time, and ion mobility spectrometry drift time(s) for each. We demonstrate that the use of three dimensions for peak matching during the peptide identification process resulted in an increased numbers of identifications and a lower false discovery rate relative to only using the mass and normalized elution time dimensions.
Keywords: ion mobility spectrometry, mass spectrometry, peptide identification, LC-MS, LC-IMS-MS, AMT tag, false discovery rate, drift time
1. Introduction
The challenges associated with identifying peptides in complex biological systems are due in part to the large number of possible tryptic peptides and posttranslational modifications in the proteome, and the often broad dynamic range of protein concentrations extending to more than 10 orders of magnitude in human blood plasma. Liquid chromatography (LC) separations have traditionally been employed to increase the depth of proteome coverage by temporally distributing peptides prior to mass spectrometry (MS) detection. LC-MS-based analyses can routinely yield thousands of protein identifications from a single sample.1
More recently, ion mobility spectrometry (IMS) has been coupled with LC-MS to further separate analytes prior to detection.2–5 IMS is based on the principle that different species traverse a gas-filled drift cell at different rates when an electric field is applied.6 By coupling IMS to time-of-flight (TOF) MS, ions can be separated quickly based on both size and mass-to-charge ratios (m/z) due to the high speed of IMS and TOF MS analyses. The incorporation of an IMS drift cell between the LC separation and TOF MS has multiple advantages for analyzing complex mixtures such as high speed measurements that allow multiple IMS-MS analyses across a given LC peak, a degree of orthogonality to both LC and MS analyses thereby increasing the overall peak capacity,7,8 and a highly reproducible drift time dimension. IMS is also able to reduce the number of ions simultaneously arriving at the MS detector, which reduces individual spectral complexity.9–11 This reduction is beneficial for increasing proteomic coverage; however, the additional dimension of separation complicates data analysis. While a number of tools exist to analyze LC-MS-based proteomics data, these approaches do not address the unique requirements of multidimensional separations.
In this study we modified our LC-MS data analysis tools on the premise that use of IMS drift time in addition to LC elution time and mass information would increase the confidence of precursor ion identification during peak matching. Originally the tools were designed to identify peptides from high resolution LC-MS data obtained using the accurate mass and time (AMT) tag approach, which was implemented to overcome MS/MS sampling limitations and improve quantification2–4. With this approach, a reference database is populated with peptide mass and LC elution time data (i.e., AMT tags) obtained from repeated LC-MS/MS measurements of representative fractionated samples from experimental and control groups. Subsequent samples from the same or comparable studies are then analyzed using high resolution LC-MS, after which observed features in the acquired datasets are aligned to AMT tags in the database to identify peptides. This high throughput approach allows for the comparison of a large number of peptide species that may not be identified in conventional data-dependent (‘shotgun’) MS/MS studies for reasons that include poor peptide fragmentation, co-elution of highly abundant species, and/or informatics limitations.
In this work, we utilized 141 tryptically digested human serum to create a reference database that included IMS drift times in addition to mass and elution time information (i.e., extended AMT tags). Peak matching to the database was then performed with 96 different serum samples, first using only two (LC, MS) dimensions and then reassessed using three (LC, IMS, MS) dimensions to quantify the discrimination afforded by the IMS separation. We report the effect of IMS drift time on high throughput analyses, multidimensional matching, and false discovery rates (FDR).
2. Materials and methods
2.1. RPLC system
A fully automated custom 4-column HPLC system12 equipped with in-house packed capillary columns was used to separate digested peptide mixtures derived from human serum samples. A 60-min LC separation was performed using 30-cm long columns with an o.d. of 360 μm, i.d. of 150 μm, and packed 3-μm C18 particles (Phenomenex, Torrance, CA).13 Mobile phase A consisted of 0.1% formic acid (Sigma-Aldrich) in nanopure water (18 MΩ) and B, of 0.1% formic acid (Sigma-Aldrich) in acetonitrile (Fisher Scientific, Waltham, MA). 10 μg of each sample was injected into the HPLC, which was operated at a constant flow rate of 1 μL/min. Mobile phase B was increased from 0 to 60% over the first 58 min and then purged at 95% during the final 2-min of the separation. A replaceable, chemically-etched 20-μm i.d. fused-silica emitter at the end of the LC system afforded electrospray ionization sample introduction14 to the IMS-TOF MS instrument.
2.2. IMS-TOF MS instrumentation and data acquisition
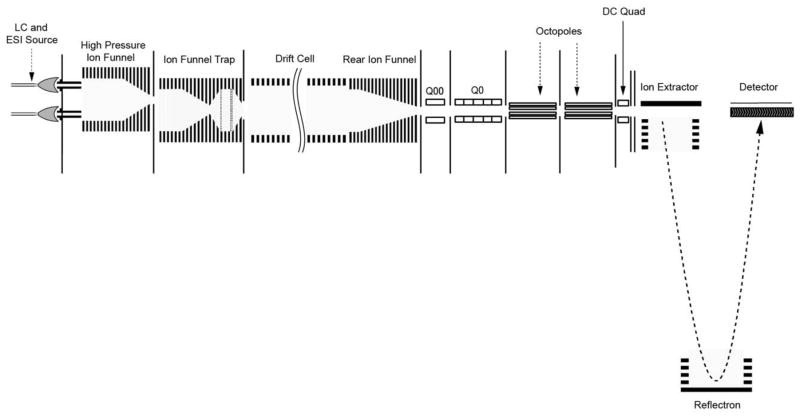
The IMS-TOF MS platform built in-house couples a 1-m IMS drift cell with an Agilent 6224 TOF MS upgraded with a 1.5 m flight tube to attain a resolution of ~25,000. The IMS-TOF MS is schematically depicted in Figure 1.15 The electrospray plume from the LC was sampled through a 64-mm long capillary inlet heated to 120°C16 and ions were transmitted off axis into a high pressure ion funnel and then into an ion funnel trap4,17,18 that focused and trapped the ions for release in discrete short ion pulses. Ejected ions passed into the 98-cm drift region (88-cm drift cell plus 10-cm rear ion funnel) filled with ~4 torr pure nitrogen buffer gas.
Fig. 1.
Schematic of the IMS-TOF MS instrument platform.
Once in the drift cell, the ions were gently pulled through the buffer gas by a uniform electric field E (~16 V/cm) where they quickly reached equilibrium between the forward acceleration force imposed by the electric field and the frictional drag force from the buffer gas. As a consequence, the ions drift at constant velocity, vd, proportional to the applied field E as shown in Equation 1:
| (1) |
where the proportionality constant, K (in cm2/V·s), is termed the mobility of the ions.6 However, because K is dependent on the density of the buffer gas, it is usually standardized (as shown in Equation 2) with respect to molecular number density. The resulting value termed the reduced mobility, Ko, is reported with T being the drift cell temperature in Kelvin and p being the buffer gas pressure in torr.
| (2) |
2.3. Samples and AMT tag database creation
Samples used to create the reference database were derived from three pools of blood serum obtained from 141 elderly men. Tryptically digested proteins from each pool were fractionated into 96 fractions using high pH RPLC. These fractions were then concatenated by combining every 8th fraction to yield 24 fractions per pool for a total of 72 fractions. The fractions were analyzed using both an LTQ Velos Orbitrap and the IMS-TOF MS platform to acquire LC-MS/MS and LC-IMS-MS datasets, respectively. With the LTQ Velos Orbitrap, data were collected from 400–2000 m/z at a resolution of 60,000 (automatic gain control target: 1 × 10⁶) followed by data dependent ion trap MS/MS spectra (automatic gain control target: 1 × 10⁴) of the ten most abundant ions, using a collision energy setting of 35%. A dynamic exclusion time of 60 s was used to discriminate against previously analyzed ions.
Peptides were identified from LC-MS/MS data as follows. First, spectra were pre-processed using DeconMSn19 to improve assignment of the monoisotopic peak and then with DtaRefinery20 to remove systematic error in parent ion mass measurements. MSGF-DB21 was then used to search the resulting MS/MS data against the UniProt human protein sequences database (release 2010_05) appended with pig trypsin peptides. A target-decoy strategy based on a reverse sequence database approach was used to estimate the FDR of peptide identifications. The search parameters were: fully tryptic peptides, static carbamidomethylation of cysteine (+57.021464) and dynamic oxidation (+15.994915) on methionine. Final peptide spectral matches were determined using the optimized ppm and spectrum probability values and the STEPS22 approach to achieve the maximum number of peptide identifications at 1.5% FDR (as estimated with the target-decoy approach). These sequences were used to create a preliminary human serum database containing peptide-specific mass and elution time information (i.e., AMT tags).
Each of the 72 fractions was also analyzed on the LC-IMS-MS platform, collecting data from 100–3200 m/z. The resulting LC-IMS-MS datasets were processed using Decon2LS23,24 and LC-IMS-MS Feature Finder25 software tools to characterize ion species in terms of mass, elution time, drift time, and charge state. Elution time and mass features from each LC-IMS-MS dataset were peak matched against the preliminary AMT tag database by using the VIPER software26 to find similar features in matched LC fractions; thus establishing links between peptides in the database and observed drift time(s) and charge state(s).
2.4. Peak matching to AMT tag database
Peptide species in datasets can be identified from the AMT tag database through a process known as peak matching.27–29 Peak matching LC-IMS-MS features from individual blood serum sample to the AMT tag database was performed using a software implementation of the STAC (statistical tools for AMT tag confidence) methodology.30 STAC provides individual posterior probabilities of correct matches, which allows a FDR to be calculated for each individual match between observed features and database information. As the STAC method was designed with sufficient flexibility to accommodate new dimensions, implementation of the IMS dimension did not require any changes to the STAC algorithm. Therefore, STAC could be used to peak match LC-IMS-MS dataset features to the reference database using either two or three dimensions. Comparing the number of peptide identifications and FDRs obtained with and without the IMS drift time information allowed us to quantify the effect of utilizing the IMS dimension on a dataset level.
3. Results and discussion
3.1. Multidimensional LC, IMS, and MS AMT tag database
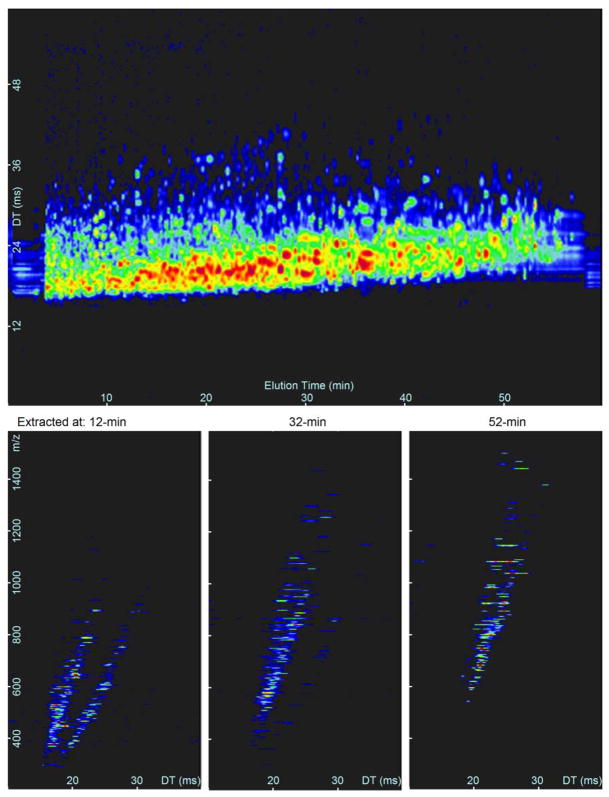
The workflow used to populate the extended AMT tag database with accurate mass, normalized LC elution time, and IMS drift time information for human serum is depicted in Fig. 2. Initially a 2-D AMT tag database containing only accurate mass and normalized elution time (NET) information was generated from LC-MS/MS spectra of 72 samples from 3 pooled groups. These samples resulted in the identification of 20,567 unique peptides (AMT tags) with an FDR of 1.5% to populate the 2-D database. LC-IMS-MS analysis of the same fractions was then performed. On average the LC-IMS-MS runs produced 20% more unidentified features/fraction compared to the LC-MS/MS analysis alone, however to create a highly confident 3-D database from both LC-MS/MS and LC-IMS-MS runs strict criteria were necessary for matching. After stringent matching of mass and NET between the runs, the resulting overlap was 12,139 AMT tags (see the Methods Section). The remaining 8,428 AMT tags from LC-MS/MS did not match the LC-IMS-MS features as a result of ambiguities among the datasets resulting in feature FDR greater than desired. Once mass and NET were matched, corresponding drift times and charge states (exemplified in Fig. 3) were added to establish extended AMT tags. Because the 12,139 peptides could be observed as multiple charge states and therefore have distinct IMS drift times, the extended 3-D AMT database contained 23,982 entries with multiple entries mapping to most peptides to allow an increase in identification confidence.
Fig. 2.
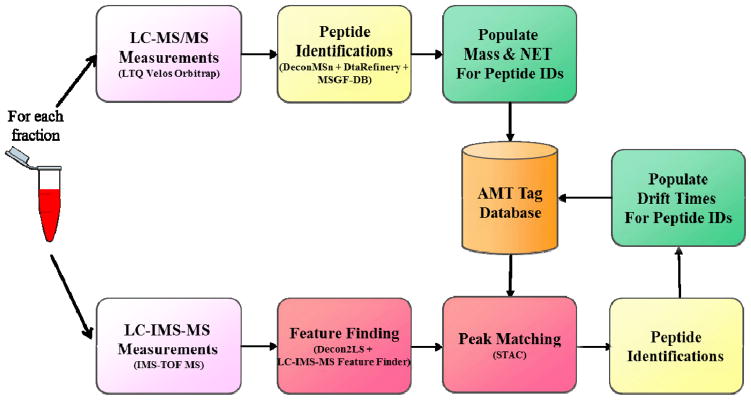
Flowchart depicting the steps involved in creating a multi-dimensional AMT tag reference peptide database of mass, normalized elution time (NET), and drift time information (Methods 2.3 and 2.4). Samples were analyzed using LC-MS (LTQ Velos Orbitrap) to establish NET and elution time information and also using LC-IMS-TOF MS so that drift time values can be associated with the peptides.
Fig. 3.
Top: 1-h LC-IMS-MS separation of human serum shown as a function of elution and drift time. Bottom: Three different nested spectra extracted from the top graph at 12, 32, and 52-min exemplify the difference in eluting peptides as a function of m/z and drift time.
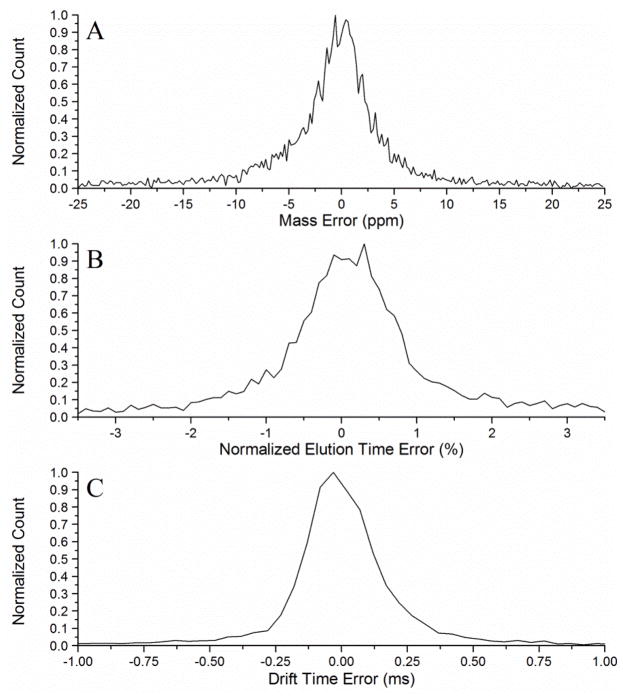
To quantify the increase in peak matching confidence with the addition of an orthogonal separation dimension (i.e., IMS drift time), 96 unfractionated, depleted human serum samples collected from an independent set of individuals (i.e., different samples than those used to create the database) were analyzed with LC-IMS-MS. The datasets from these samples were then individually matched against the extended 3-D AMT tag database to identify how many peptides could be observed at a certain FDR. The LC, IMS and MS dimensions of a single human serum sample are shown in Fig. 3 to illustrate the complexity of each dataset. These same samples were also matched to the initial 2-D database with 20,567 tags to understand how the number of identified peptides would be different if the IMS dimension was not utilized. STAC was implemented to perform peak matching on each of the 96 datasets to both the 2-D and 3-D database. As part of this step, STAC creates error histograms for each dimension of separation based on the observed error between features matching to the database. An example of the resulting mass, NET, and drift time error histograms for a single LC-IMS-MS dataset is shown in Fig. 4. Judging by the base of the histogram peaks, the observed mass, NET, and drift time error of the LC-IMS-MS datasets was estimated to be ~8 ppm, 1% NET, and 0.25 ms, respectively.
Fig. 4.
An example of A) mass error, B) NET error, and C) drift time error histograms for an LC-IMS-MS dataset matched against the AMT tag database. These histograms show a mass error of ~8 ppm, a NET error of ~1%, and a drift time error of ~0.25 ms.
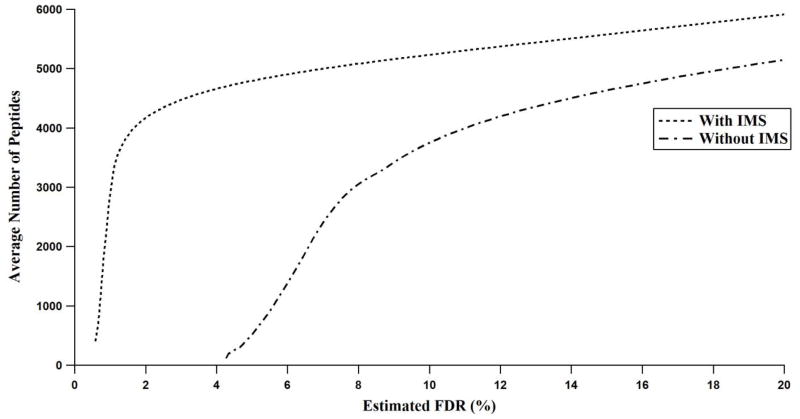
The number of peptides identified using 3-D peak matching increased significantly across all FDRs compared with 2-D peak matching even though there were more unique peptides in the 2-D database (Fig. 5). For example, at an estimated 10% FDR, an average of 3,759 peptides were identified using mass and NET, while an average of 5,233 peptides were identified at the same level of confidence when IMS drift time was included. At this relaxed confidence level, the added discriminating power of the IMS dimension yields a 37% increase in the number of identifications. However, the most significant distinction appears at more stringent confidence levels. Below 4% FDR no peptides were identified when using only mass and NET, whereas an average of 4,659 peptides were identified when IMS drift time was included. Peak matching with the inclusion of IMS drift time continued to be robust at ~2% FDR, where an average of 4,172 peptides were identified on average; however, below 2% FDR, the number of peptide identifications sharply declined and was sporadic for different datasets. At any level of FDR, the utilization of the IMS dimension leads to more identified peptides.
Fig. 5.
The average number of peptides identified versus FDR across 96 datasets both with and without the use of the IMS drift dimension.
3.2. Resolving ambiguity using drift time
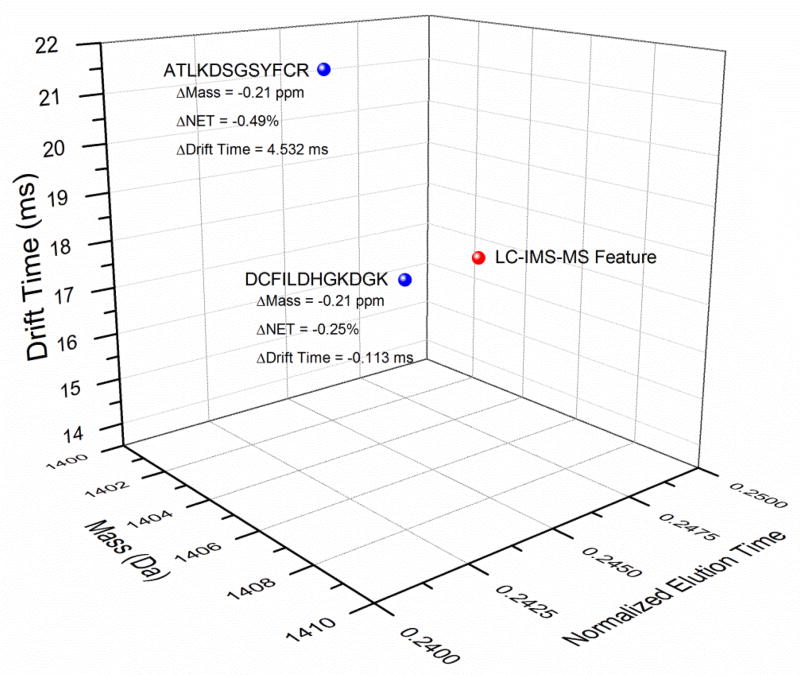
The substantial increase in the number of confidently identified peptides is derived primarily from the added discrimination afforded by the IMS dimension. This discrimination is typically noticeable in situations where two AMT tags have similar masses and elution times. For example, in Fig. 6 the mass and NET for a single LC-IMS-MS feature matches to two AMT tags that represent peptides with nearly identical masses and NETs, i.e.,: DC[+57.02]FILDHGKDGK (mass = 1403.65 Da; NET = 0.246) with a STAC score of 0.9478 and ATLKDSGSYFC[+57.02]R (mass = 1403.65 Da; NET = 0.244) with a STAC score of 0.9396. However, once drift time is considered, only one extended AMT tag matches to the LC-IMS-MS feature, i.e., DCFILDHGKDGK, and the STAC score increases to 0.9943. As the difference in drift time between the feature and the extended AMT tag for ATLKDSGSYFCR fell outside the known drift time tolerance of the instrument (0.3 ms), it was not scored by STAC and removed as a possibility.
Fig. 6.
An example of an LC-IMS-MS feature that would be matched against two different peptides if only mass and NET are considered. When the drift time is included, the LC-IMS-MS feature is clearly resolved to a single peptide match.
4. Conclusions
The inherent complexity of proteomics samples has motivated research into separations methods that can temporally simplify a sample for analysis on a mass spectrometer. We demonstrated the utility of using IMS as an additional dimension of separation for LC-MS-based analysis to obtain more confident and unambiguous peptide identifications from complex proteome samples such as blood serum. Our approach explicitly utilized peptide identifications from MS/MS data. Other methods could also be used to increase the confidence in peptide identification, such as comparing the observed IMS drift time to computational predictions. Currently, peptide drift time has been predicted using both machine learning approaches31,32 and by utilizing intrinsic amino acid size parameters.33
The addition of the IMS dimension in data analysis was made possible by expanding the AMT tag approach to include IMS drift times, extending current software to utilize drift times in characterization of MS1 features, and by instructing STAC to use a third dimension for peak matching features to entries in the reference database. This approach is general and could easily be adapted to add a different third dimension and/or other dimension(s) of separation. Provided separations are orthogonal, increases in both the number and confidence of identifications, as demonstrated in this study, should be observed.
Highlights.
Database created with mass, elution time, drift time, and charge state for peptides
IMS provides a 3rd dimension of separation for increased confidence in identifications
Addition of the IMS dimension discerns peptides that were previously impossible
Acknowledgments
Portions of this work were supported by the National Institutes of Health’s National Center for Research Resources (5P41RR018522-10), National Institute of General Medical Sciences (8 P41 GM103493-10), National Cancer Institute (R21-CA12619-01, U24-CA-160019-01, and Interagency Agreement Y01-CN-05013-29), the National Institute of Health (R01ES022190); the Washington State Life Sciences Discovery Fund; the Entertainment Industry Foundation and its Women’s Cancer Research Fund; the Laboratory Directed Research and Development Program at Pacific Northwest National Laboratory; and by the U.S. Department of Energy Office of Biological and Environmental Research Genome Sciences Program under the Pan-omics project. The research was performed in the Environmental Molecular Science Laboratory, a U.S. Department of Energy Office of Biological Research national scientific user facility at Pacific Northwest National Laboratory in Richland, WA.
Abbreviations
- AMT
Accurate Mass and Time
- FDR
False Discovery Rate
- STAC
Statistical Tools for AMT tag Confidence
Footnotes
Supplementary Information: http://omics.pnl.gov/
Publisher's Disclaimer: This is a PDF file of an unedited manuscript that has been accepted for publication. As a service to our customers we are providing this early version of the manuscript. The manuscript will undergo copyediting, typesetting, and review of the resulting proof before it is published in its final citable form. Please note that during the production process errors may be discovered which could affect the content, and all legal disclaimers that apply to the journal pertain.
References
- 1.Schwanhausser B, et al. Global quantification of mammalian gene expression control. Nature. 2011;473:337–342. doi: 10.1038/nature10098. [DOI] [PubMed] [Google Scholar]
- 2.Belov ME, et al. Ion mobility separations in high throughput proteomics: A novel approach to protein detection and quantitation. Abstr Pap Am Chem S. 2010;240 [Google Scholar]
- 3.Beagley N, et al. e-Science, 2009. e-Science’09; Fifth IEEE International Conference on; IEEE; pp. 66–71. [Google Scholar]
- 4.Clowers BH, et al. Enhanced ion utilization efficiency using an electrodynamic ion funnel trap as an injection mechanism for ion mobility spectrometry. Anal Chem. 2008;80:612–623. doi: 10.1021/Ac701648p. [DOI] [PMC free article] [PubMed] [Google Scholar]
- 5.Belov ME, Buschbach MA, Prior DC, Tang KQ, Smith RD. Multiplexed ion mobility spectrometry-orthogonal time-of-flight mass spectrometry. Anal Chem. 2007;79:2451–2462. doi: 10.1021/Ac0617316. [DOI] [PMC free article] [PubMed] [Google Scholar]
- 6.Mason EA, McDaniel EW. Transport properties of ions in gases. NASA STI/Recon Technical Report A. 1988;891:15174. [Google Scholar]
- 7.Liu ZY, Patterson DG, Lee ML. Geometric Approach to Factor-Analysis for the Estimation of Orthogonality and Practical Peak-Capacity in Comprehensive 2-Dimensional Separations. Anal Chem. 1995;67:3840–3845. doi: 10.1021/Ac00117a004. [DOI] [Google Scholar]
- 8.Ruotolo BT, Gillig KJ, Stone EG, Russell DH. Peak capacity of ion mobility mass spectrometry: Separation of peptides in helium buffer gas. J Chromatogr B. 2002;782:385–392. doi: 10.1016/S1570-0232(02)00566-4. Pii S1570-0232(02)00566-4. [DOI] [PubMed] [Google Scholar]
- 9.Valentine SJ, Counterman AE, Hoaglund CS, Reilly JP, Clemmer DE. Gas-phase separations of protease digests. J Am Soc Mass Spectr. 1998;9:1213–1216. doi: 10.1016/S1044-0305(98)00101-9. [DOI] [PubMed] [Google Scholar]
- 10.Hoaglund-Hyzer CS, Clemmer DE. Ion trap/ion mobility/quadrupole/time of flight mass spectrometry for peptide mixture analysis. Anal Chem. 2001;73:177–184. doi: 10.1021/Ac0007783. [DOI] [PubMed] [Google Scholar]
- 11.Lee YJ, et al. Development of high-throughput liquid chromatography injected ion mobility quadrupole time-of-flight techniques for analysis of complex peptide mixtures. J Chromatogr B. 2002;782:343–351. doi: 10.1016/S1570-0232(02)00569-X. Pii S1570-0232(02)00569-X. [DOI] [PubMed] [Google Scholar]
- 12.Livesay EA, et al. Fully automated four-column capillary LC-MS system for maximizing throughput in proteomic analyses. Anal Chem. 2008;80:294–302. doi: 10.1021/Ac701727r. [DOI] [PMC free article] [PubMed] [Google Scholar]
- 13.Shen YF, et al. Packed capillary reversed-phase liquid chromatography with high-performance electrospray ionization Fourier transform ion cyclotron resonance mass spectrometry for proteomics. Anal Chem. 2001;73:1766–1775. doi: 10.1021/Ac0011336. [DOI] [PubMed] [Google Scholar]
- 14.Kelly RT, et al. Chemically etched open tubular and monolithic emitters for nanoelectrospray ionization mass spectrometry. Anal Chem. 2006;78:7796–7801. doi: 10.1021/Ac061133r. [DOI] [PMC free article] [PubMed] [Google Scholar]
- 15.Baker ES, et al. Ion mobility spectrometry-mass spectrometry performance using electrodynamic ion funnels and elevated drift gas pressures. J Am Soc Mass Spectr. 2007;18:1176–1187. doi: 10.1016/j.jasms.2007.03.031. [DOI] [PMC free article] [PubMed] [Google Scholar]
- 16.Kim T, et al. Design and implementation of a new electrodynamic ion funnel. Anal Chem. 2000;72:2247–2255. doi: 10.1021/Ac991412x. [DOI] [PubMed] [Google Scholar]
- 17.Ibrahim Y, Tang KQ, Tolmachev AV, Shvartsburg AA, Smith RD. Improving mass spectrometer sensitivity using a high-pressure electrodynamic ion funnel interface. J Am Soc Mass Spectr. 2006;17:1299–1305. doi: 10.1016/j.jasms.2006.06.005. [DOI] [PMC free article] [PubMed] [Google Scholar]
- 18.Ibrahim Y, Belov ME, Tolmachev AV, Prior DC, Smith RD. Ion funnel trap interface for orthogonal time-of-flight mass spectrometry. Anal Chem. 2007;79:7845–7852. doi: 10.1021/Ac071091m. [DOI] [PMC free article] [PubMed] [Google Scholar]
- 19.Mayampurath AM, et al. DeconMSn: a software tool for accurate parent ion monoisotopic mass determination for tandem mass spectra. Bioinformatics. 2008;24:1021–1023. doi: 10.1093/bioinformatics/btn063. [DOI] [PMC free article] [PubMed] [Google Scholar]
- 20.Petyuk VA, et al. DtaRefinery, a Software Tool for Elimination of Systematic Errors from Parent Ion Mass Measurements in Tandem Mass Spectra Data Sets. Mol Cell Proteomics. 2010;9:486–496. doi: 10.1074/mcp.M900217-MCP200. [DOI] [PMC free article] [PubMed] [Google Scholar]
- 21.Kim S, et al. The Generating Function of CID, ETD, and CID/ETD Pairs of Tandem Mass Spectra: Applications to Database Search. Mol Cell Proteomics. 2010;9:2840–2852. doi: 10.1074/mcp.M110.003731. [DOI] [PMC free article] [PubMed] [Google Scholar]
- 22.Piehowski PD, et al. STEPS: A grid search methodology for optimized peptide identification filtering of MS/MS database search results. Proteomics. 2013 doi: 10.1002/pmic.201200096. [DOI] [PMC free article] [PubMed] [Google Scholar]
- 23.Jaitly N, et al. Decon2LS: An open-source software package for automated processing and visualization of high resolution mass spectrometry data. Bmc Bioinformatics. 2009;10 doi: 10.1186/1471-2105-10-87. Artn 87. [DOI] [PMC free article] [PubMed] [Google Scholar]
- 24.Slysz GW, et al. The DeconTools framework: an application programming interface enabling flexibility in accurate mass and time tag workflows for proteomics and metabolomics. ASMS; Salt Lake City, UT: 2010. [Google Scholar]
- 25.Crowell KL, et al. LC-IMS-MS Feature Finder: Detecting Multidimensional Features in LC-IMS-TOF MS Data. ASMS; Denver, CO: 2011. [DOI] [PMC free article] [PubMed] [Google Scholar]
- 26.Monroe ME, et al. VIPER: an advanced software package to support high-throughput LC-MS peptide identification. Bioinformatics. 2007;23:2021–2023. doi: 10.1093/bioinformatics/btm281. [DOI] [PubMed] [Google Scholar]
- 27.Conrads TP, Anderson GA, Veenstra TD, Pasa-Tolic L, Smith RD. Utility of accurate mass tags for proteome-wide protein identification. Anal Chem. 2000;72:3349–3354. doi: 10.1021/Ac0002386. [DOI] [PubMed] [Google Scholar]
- 28.Smith RD, et al. An accurate mass tag strategy for quantitative and high-throughput proteome measurements. Proteomics. 2002;2:513–523. doi: 10.1002/1615-9861(200205)2:5<513::Aid-Prot513>3.0.Co;2-W. [DOI] [PubMed] [Google Scholar]
- 29.May D, et al. A platform for accurate mass and time analyses of mass spectrometry data. J Proteome Res. 2007;6:2685–2694. doi: 10.1021/pr070146y. [DOI] [PubMed] [Google Scholar]
- 30.Stanley JR, et al. A Statistical Method for Assessing Peptide Identification Confidence in Accurate Mass and Time Tag Proteomics. Anal Chem. 2011;83:6135–6140. doi: 10.1021/Ac2009806. [DOI] [PMC free article] [PubMed] [Google Scholar]
- 31.Wang B, Valentine S, Raghuraman S, Plasencia M, Zhang X. Prediction of peptide drift time in ion mobility-mass spectrometry. Bmc Bioinformatics. 2009;10 doi: 10.1186/1471-2105-10-S7-A1. Artn A1. [DOI] [PMC free article] [PubMed] [Google Scholar]
- 32.Shah AR, et al. Machine learning based prediction for peptide drift times in ion mobility spectrometry. Bioinformatics. 2010;26:1601–1607. doi: 10.1093/bioinformatics/btq245. [DOI] [PMC free article] [PubMed] [Google Scholar]
- 33.Valentine SJ, et al. Using Ion Mobility Data to Improve Peptide Identification: Intrinsic Amino Acid Size Parameters. J Proteome Res. 2011;10:2318–2329. doi: 10.1021/Pr1011312. [DOI] [PMC free article] [PubMed] [Google Scholar]


