

Abstract
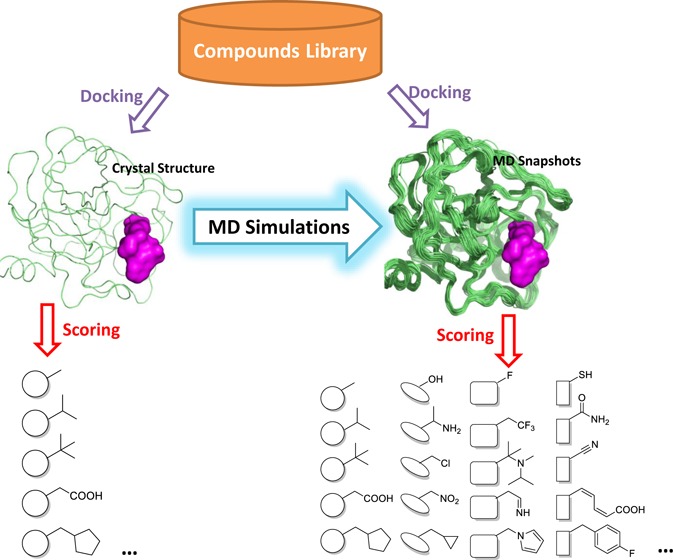
Molecular recognition is a complex process that involves a large ensemble of structures of the receptor and ligand. Yet, most structure-based virtual screening is carried out on a single structure typically from X-ray crystallography. Explicit-solvent molecular dynamics (MD) simulations offer an opportunity to sample multiple conformational states of a protein. Here we evaluate our recently developed scoring method SVMSP in its ability to enrich chemical libraries docked to MD structures of seven proteins from the Directory of Useful Decoys (DUD). SVMSP is a target-specific rescoring method that combines machine learning with statistical potentials. We find that enrichment power as measured by the area under the ROC curve (ROC-AUC) is not affected by increasing the number of MD structures. Among individual MD snapshots, many exhibited enrichment that was significantly better than the crystal structure, but no correlation between enrichment and structural deviation from crystal structure was found. We followed an innovative approach by training SVMSP scoring models using MD structures (SVMSPMD). The resulting models were applied to two difficult cases (p38 and CDK2) for which enrichment was not better than random. We found remarkable increase in enrichment power, particularly for p38, where the ROC-AUC increased by 0.30 to 0.85. Finally, we explored approaches for a priori identification of MD snapshots with high enrichment power from an MD simulation in the absence of active compounds. We found that the use of randomly selected compounds docked to the target of interest using SVMSP led to notable enrichment for EGFR and Src MD snapshots. SVMSP rescoring of protein–compound MD structures was applied for the search of small-molecule inhibitors of the mitochondrial enzyme aldehyde dehydrogenase 2 (ALDH2). Rank-ordering of a commercial library of 50 000 compounds docked to MD structures of ALDH2 led to five small-molecule inhibitors. Four compounds had IC50s below 5 μM. These compounds serve as leads for the design and synthesis of more potent and selective ALDH2 inhibitors.
Introduction
Structure-based virtual screening is widely used in the search for small molecules to probe the function of proteins and nucleic acids in chemical biology and drug discovery.1,2 Typically, a chemical library is docked to a pocket on the target structure, followed by the ranking of the resulting protein–compound complexes in a process known as scoring. The top candidates are acquired or prepared for experimental validation. Several scoring methods have been developed over the years; these include empirical,3−11 knowledge-based,12−21 and force field-based.22−29 We recently developed a new scoring approach that combines machine learning and statistical knowledge-based potentials for rank-ordering Support Vector Regression Knowledge-Based (SVRKB)30 and database enrichment Support Vector Machine SPecific (SVMSP).31 The former is regression-based and trained on crystal structures using corresponding experimental binding affinities, while the latter is based on classification and is trained strictly on three-dimensional structures of protein–ligand complexes using both actives and decoys.
Part of the challenge with the use of structure-based virtual screening is protein flexibility.32−34 It is ignored in the majority of cases by docking compounds strictly to a crystal structure,35−37 although there are examples that have used multiple crystal structures,38−40 NMR structures,41−44 or a combination of the two.451,461 Albeit less common, the use of molecular dynamics (MD) simulations to generate an ensemble of structures has also been reported in virtual screening efforts that have led to active compounds.45−49 Our own recent study led to the discovery of small-molecule inhibitors of a tight protein–protein interaction by docking a chemical library to protein structures collected from explicit-solvent MD simulations.50 Several studies have attempted to gain a deeper understanding of the role of MD structures on chemical database enrichment.33,34,51
Here, we conduct an in-depth study to investigate the SVMSP scoring approach in chemical database enrichment using structures collected from explicit-solvent MD simulations. We explore enrichment for individual and ensembles of structures. In addition, we follow an innovative approach that explores the use of MD structures for the development of scoring functions for virtual screening. Also, we investigate the a priori identification of MD snapshots with high enrichment power from an MD simulation. Finally, SVMSP scoring of protein–compound MD structures is applied in the virtual screening of commercial libraries against the mitochondrial aldehyde dehydrogenase 2 enzyme (ALDH2). ALDH2 catalyzes the NAD+-dependent oxidation of a broad spectrum of endogenous and biogenic aldehydes to their corresponding carboxylic acids. ALDH2 is commonly associated with its role in alcohol metabolism, but it has been suggested as a potential target for a variety of diseases that include addiction and cancer. Top candidates that emerged from virtual screening were acquired and tested for inhibition of enzyme activity.
Materials and Methods
Data Set Preparation
For the enrichment study, 7 protein structure from the Directory of Useful Decoys (DUD)52 and one from our in-house validation set, namely, MDM2 (mouse double minute 2 homolog) (PDB code: 1RV1), were used to assess the performance of scoring functions. The DUD proteins include acetycholinesterase AChE (PDB code: 1EVE), human androgen receptor AR (PDB code: 1XQ2), human cyclin-dependent kinase 2 CDK2 (PDB code: 1CKP), human epidermal growth factor receptor EGFR (PDB code: 1M17), human mitogen-activated protein kinase 14 known as p38 (PDB code: 1KV2), human proto-oncogene tyrosine-protein kinase Src (PDB code: 2SRC), and cationic trypsin (PDB code: 1BJU).
To ensure diversity among the active compounds in DUD, the compounds were clustered by chemical similarity. FP3 fingerprints were generated for every ligand with Open Babel.53 A Tanimoto coefficient matrix was calculated for each target by Open Babel. Hierarchical clustering method was applied with the cluster package in python2.6 to cluster compounds. The getlevel threshold in the cluster package was set to 0.1, which means that any two compounds with Tanimoto coefficient deviation less than 0.1 will be included into the same cluster. The number of compounds after clustering for each target is shown in Table 1. The ratio of active ligands to decoys (Nligands/Ndecoys) was kept to 1:36 following the convention adopted in DUD.
Table 1. Validation Set for Enrichment Studies.
| target protein | number of ligands in DUD | number of ligands after clustering | number of decoys |
|---|---|---|---|
| AChE | 105 | 18 | 648 |
| AR | 74 | 18 | 648 |
| CDK2 | 50 | 27 | 972 |
| EGFR | 444 | 33 | 1188 |
| MDM2 | 19 | 19 | 684 |
| p38 | 256 | 31 | 1116 |
| Src | 162 | 21 | 756 |
| trypsin | 44 | 15 | 540 |
MD Simulations
Explicit-solvent MD simulations were carried out for 8 proteins (Table 1). Crystal structures were obtained from the RCSB Protein Data Bank (PDB).54 Preparation of the structures was performed by adding hydrogen atoms and modeling missing gaps with BIOPOLYMER module in SYBYL 8.0 (Tripos International, St. Louis, MO, U.S.A.). Water molecules from crystal structures within 5 Å of any atoms on the protein were retained. Residue orientation and protonation states were further adjusted using the REDUCE55 program to optimize the hydrogen bonding network. The structures were immersed in a box of TIP3P56 water molecules. No atom on the protein was within 14 Å from any side of the box. The solvated box was further neutralized with Na+ or Cl– counterions using the leap program from the AMBER9 package.57
MD simulations were performed using the pmemd program in AMBER9 with ff03 force field58 in periodic boundary conditions. All bonds involving hydrogen atoms were constrained by using the SHAKE algorithm.59 The simulations were carried out using a 2 fs time step. The particle mesh Ewald (PME) method was used to treat long-range electrostatics. Simulations were run at 298 K under 1 atm in the NPT ensemble employing Langevin thermostat and Berendsen barostat. Water molecules were first energy-minimized and equilibrated by running a short simulation with the complex fixed using Cartesian restraints. A series of energy minimizations were subsequently carried out where the Cartesian restraints were gradually relaxed from 500 to 0 kcal·Å–2, and the system was subsequently gradually heated to 298 K via a 48 ps MD run. For each target, four independent 6 ns simulations were performed. MD snapshots were collected every 1 ps yielding 6 000 structures per trajectory, or 24 000 structures in total.
The first 1 ns for each trajectory was discarded for equilibration. A set of 500 snapshots was extracted at regular intervals from the resulting 20 000 snapshots for each protein. Atoms within 5 Å around the ligand in the crystal structure were considered as pocket atoms. The 500 trajectory frames were further clustered into groups based on pairwise similarity measured by root-mean-square deviation (RMSD) of pocket atoms with the ptraj program in AMBER. The hierarchical clustering algorithm was used to cluster all 500 structures into sets of 5, 10, 20, 30, 50, 100, and 250 structures.
Scoring Protein–Ligand Complexes
We previously reported the SVMSP scoring approach31 for enriching databases. SVMSP is specifically developed for each target protein. The SVMSP model was built by using protein–ligand crystal structures from the sc-PDB database (v2010)60 for the positive set and randomly selected compounds docked to the target of interest as the negative set. The positive set was refined by removing crystal structures in which the ligand contained highly charged moieties such as sulfate or phosphate groups, resulting in a set of 4677 structures. Full names and PDB codes of the crystal structure are provided in the Supporting Information. The negative set consisted of 5000 randomly selected compounds from the ChemDiv library docked to a pocket within the target of interest. The SVMSPKINASE model was developed for kinase targets only. The positive set included only kinase structures from the sc-PDB database, consisting of 763 crystal structures. The negative set for SVMSPKINASE was the same as the SVMSP model. SVMSPMD models were created by using decoy compounds docked to MD snapshots for the negative training set. A total of 5000 randomly selected compounds were docked to each MD snapshot. The positive set consisted of the same structures that were used to develop SVMSP. When the positive set employed kinase-only structures, the model was called SVMSPKINASE-MD.
To develop the SVMSP models, we extended on our previous work by using 14 distinct protein atom types and 16 ligand atom types (Supporting Information Table S1).31 This resulted in 224 atom pairs. We used 76 pair potentials for the vectors of SVMSP. A higher SVMSP score corresponds to a higher probability that the compound is an active compound.
Compounds Docking
All the molecular docking reported in this work was done using Autodock Vina.61 The exhaustiveness parameter of the Vina program was set to the default value of 8. A maximum number of 9 binding modes were generated, with maximum energy difference between the best and worst binding mode set to 3 kcal·mol–1. The docking pose with the lowest energy estimated by Vina was selected as the best binding pose for further scoring. The box size was 19 Å.
ROC and Statistical Analysis
A tool that is commonly used to assess the performance of a scoring function is the receiver operating characteristic (ROC) plot.62 An ROC curve is constructed by ranking the docked complexes, selecting a set of compounds starting from the highest scoring compounds, and counting the number of active compounds. This process is repeated a number of times for a gradually increasing set of compounds selected from the ranked list. In an ROC plot, the farther away the curve is from the diagonal, the better the performance of the scoring function. The area under the ROC curve, which we refer to as ROC-AUC, can also be used as a representation of the performance of the scoring function. A perfect scoring function has an ROC-AUC of 1, while a random classification will have an ROC-AUC of 0.5.
ALDH2 Virtual Screening
The initial coordinates of ALDH2 used in the molecular dynamics (MD) simulations were obtained from the PDB (PDB code: 1O04). The PDB file was imported into Maestro (version 9.3, Schrödinger, LLC, New York, NY, 2012), prepared using the Protein Preparation Wizard.63 Bond orders were assigned, hydrogen atoms were added, disulfide bonds were created, and selenomethionines were converted to methionines. Crystal water molecules were kept. MD simulations were carried out as described above. By assigning different initial velocities, five independent 7 ns simulations were carried out for a total length of 35 ns simulation. The first 2 ns of each trajectory were considered as part of the equilibration process and discarded. MD snapshots were saved every 1 ps yielding 5000 structures per trajectory. In total, 25 000 snapshots were collected. The snapshots were clustered into 75 sets using the ptraj program using atoms around the active site pocket. The hierarchical clustering algorithm was used for the clustering. Among 75 clusters, the top 50 clusters that had the most snapshots were selected. A representative snapshot was chosen for virtual screening from each of the 50 clusters. Around 50 000 compounds from ChemDiv8064 library were docked to each of the 50 snapshots using Vina.
Docked receptor–ligand complexes were rescored using SVMSP. The 5000 randomly picked compounds from ChemDiv library docked to ALDH2 crystal structure were used as the negative set to build the SVMSP model. For each compound, the highest score among all the snapshots within the cluster was used to rank all the compounds. Top scored 5000 compounds from the ChemDiv80 library were selected. Canvas similarity and clustering scripts65,66 in the Maestro program were applied to cluster the top compounds. Atom triplet fingerprint type with 32-bit precision was used. Atom typing scheme was the Daylight invariant atom types. The single linkage method was used to generate 150 clusters. The compounds representing the 150 cluster center were selected for further experimental validation.
ALDH Inhibition Assays
Compounds were first screened using a high-throughput dehydrogenase assay to measure the production of NADH via fluorescence (excitation λ = 340 nm, emission λ = 465 nm) on an Ultra384 plate reader over a 10 min period. The screening assay used 20 nM ALDH2, 30 μM propionaldehyde, 100 μM NAD+, and 50 μM compound in 25 mM BES, pH 7.5 with 2% (v/v) DMSO in a 96-well black plate with a final volume of 200 μL. The compounds that showed inhibition in this assay were then tested for their effect on ALDH2 dehydrogenase activity at 50 μM concentration using a Beckman DU-640. The dehydrogenase assay used 150 nM ALDH2, 100 μM propionaldehyde, and 200 μM NAD+ in 25 mM BES, pH 7.5 with 1% (v/v) DMSO. The assays were monitored at 340 nm for the increase in NADH production (extinction coefficient = 6.22 mM–1 cm–1). If compounds showed inhibition at this concentration, assays to determine the concentration dependence of inhibition (IC50) were performed. IC50 values toward inhibition of ALDH2 activity were measured with compound concentrations ranging from 0 to 100 μM. All IC50 values were determined by fitting to the 4-parameter logistics function in SigmaPlot (v12).
Results
Enrichment in the Conformational Ensemble
We were particularly interested in assessing how our scoring approach, SVMSP, affects enrichment of compound libraries docked to MD structures collected from explicit-solvent MD simulations. To that end, MD simulations were carried out for 8 proteins that included 7 proteins from the Directory of Decoys (DUD), namely, androgen receptor (AR), acetylcholinesterase (AChE), trypsin, cyclin-dependent kinase 2 (CDK2), epidermal growth factor receptor (EGFR), mitrogen-activated protein kinase (p38), and proto-oncogene protein tyrosine kinase (Src). One additional protein, MDM2, which is involved in a protein–protein interaction with p53, was added to the list (Table 1). A total of 24 ns of simulation was carried out for each protein. In each case, a set of 500 structures were collected at regular intervals from 20 000 snapshots generated by the simulations. Decoy and active compounds obtained from DUD (or generated for MDM2) were docked to the 500 MD snapshots with AutoDock Vina. The resulting complexes were scored with SVMSP,31 ChemScore,67 GoldScore,68 and GBSA.69
First, we investigated how the total number of MD structures in the ensemble affect enrichment. The 500 MD snapshots for each protein in Table 1 were clustered into sets containing 5, 10, 20, 30, 50, 100, and 250 MD structures. Compounds were ranked using the highest score among all the MD snapshots to which the compound was docked (Table 2). For the crystal structures, the ROC-AUC ranged from 0.38 for p38 to 0.90 for EGFR. The ROC-AUC for SVMSP was larger than 0.8 for five out of the eight proteins. For MD structures, there were two cases, trypsin and AChE, which showed a gradual increase in the ROC-AUC as the size of the cluster became larger (Figure 1). In the case of trypsin, the ROC-AUC nearly reached a value of 1 for the cluster for 250 structures. For AChE, an improvement of nearly 0.1 in ROC-AUC was observed when compared to the crystal structure. In the case of p38 kinase, CDK2, and AR, the performance remained constant at 0.33, 0.57, and 0.82, respectively. Src reveals an initial drop in ROC-AUC of about 0.1 units to 0.7, which does not change as the number of structures is increased. For EGFR, the ROC-AUC was constant for 5 and 10 snapshots but dropped by 0.2 units for 20 and 30 structures only to show an increase back to 0.9 for 50, 100, and 250 structures. The results suggest that a cluster of 50 snapshots is likely to result in the best performance across a set of diverse proteins for SVMSP. All data presented below uses the 50 MD snapshots unless otherwise stated.
Table 2. SVMSP Enrichment Performance of Different Cluster Size.
| AChE | AR | CDK2 | EGFR | MDM2 | p38 | Src | trypsin | |
|---|---|---|---|---|---|---|---|---|
| crystal | 0.66 | 0.82 | 0.60 | 0.90 | 0.82 | 0.38 | 0.80 | 0.85 |
| 5 | 0.65 | 0.82 | 0.60 | 0.92 | 0.73 | 0.35 | 0.73 | 0.93 |
| 10 | 0.62 | 0.82 | 0.54 | 0.90 | 0.76 | 0.37 | 0.72 | 0.93 |
| 20 | 0.77 | 0.81 | 0.57 | 0.75 | 0.76 | 0.37 | 0.76 | 0.96 |
| 30 | 0.68 | 0.82 | 0.60 | 0.77 | 0.74 | 0.37 | 0.73 | 0.96 |
| 50 | 0.72 | 0.82 | 0.55 | 0.90 | 0.75 | 0.36 | 0.79 | 0.96 |
| 100 | 0.76 | 0.83 | 0.57 | 0.88 | 0.77 | 0.33 | 0.75 | 0.96 |
| 250 | 0.78 | 0.82 | 0.57 | 0.90 | 0.76 | 0.33 | 0.76 | 0.96 |
Figure 1.

ROC-AUC scores for different clusters of MD structures. (A) SVMSP; (B) ChemScore; (C) GoldScore; and (D) GBSA.
Enrichment performance for the other three scoring functions, namely, GoldScore, ChemScore, and GBSA, were poor in all systems when the crystal structure was used. ROC-AUCs do not change significantly in all four scoring functions with respect to the size of the cluster (Figure 1 and Supporting Information Table S2). For ChemScore, GoldScore, and GBSA rescoring, performance is similar to the crystal structure in each cluster. An exception is for GBSA in AR where a drop from 0.7 to 0.4 is observed.
Enrichment for Individual Snapshots
The docking of all actives and decoys to 500 snapshots collected from the MD simulations of each protein in Table 1 provided an opportunity to explore enrichment for individual MD structures. ROC-AUC scores were determined for all 500 snapshots collected for each of the 8 target proteins in Table 1. The ROC-AUC for each snapshot was plotted against its structural deviation from the crystal structure measured by the root-mean-square derivation (RMSD) (Figure 2). No direct correlation between ROC-AUC and RMSD is observed. This suggests that greater overall structural deviation from the crystal structure does not translate into lower or higher enrichment performance (Figure 2).
Figure 2.

ROC-AUC for individual snapshots. Green line represents ROC-AUC using single crystal structure, and blue line represents ROC-AUC using 50 clustered MD snapshots.
What is notable from this data is the large fluctuation in the ROC-AUC among the 500 snapshots. Enrichment in several MD snapshots exceeded that of the corresponding crystal structure (Table 3). A total of 32, 55, 2, 81, 17, 76, 13, and 18% of the snapshots for AChE, AR, MDM2, p38, trypsin, EGFR, CDK2, and Src, respectively, exhibited better performance than the crystal structure. In some cases, there exist MD snapshots that significantly exceeded the enrichment power of the crystal structure (Table 3). For example, for AChE, the snapshot with the maximum ROC-AUC (ROC-AUCMAX) was 0.83, nearly 0.2 higher than the crystal structure. A similar snapshot was identified for AR (ROC-AUCMAX = 0.90), CDK2 (ROC-AUCMAX = 0.77), EGFR (ROC-AUCMAX = 0.97), MDM2 (ROC-AUCMAX = 0.85), trypsin (ROC-AUCMAX = 0.94), and Src (ROC-AUCMAX = 0.74). Two proteins, namely, p38 and CDK2, had poor enrichment both in the crystal (ROC-AUC of 0.38 and 0.60, respectively) and MD structures (ROC-AUC of 0.36 and 0.55, respectively). For these two proteins, ROC-AUCMAX was 0.54 and 0.77, respectively.
Table 3. SVMSP Enrichment Performance for 500 MD Snapshots.
| ROC-AUC | scoring method | AChE | AR | CDK2 | EGFR | MDM2 | p38 | Src | trypsin |
|---|---|---|---|---|---|---|---|---|---|
| crystal structure | SVMSP | 0.66 | 0.82 | 0.60 | 0.90 | 0.82 | 0.38 | 0.80 | 0.85 |
| ROC-AUCMIN | SVMSP | 0.48 | 0.56 | 0.35 | 0.67 | 0.56 | 0.32 | 0.46 | 0.58 |
| ROC-AUCMAX | SVMSP | 0.83 | 0.90 | 0.77 | 0.97 | 0.85 | 0.54 | 0.89 | 0.94 |
| range | SVMSP | 0.35 | 0.34 | 0.42 | 0.30 | 0.29 | 0.22 | 0.44 | 0.36 |
| mean | SVMSP | 0.63 | 0.82 | 0.54 | 0.92 | 0.72 | 0.42 | 0.74 | 0.79 |
| ROC-AUCMIN | SVMSPMD | - | - | 0.44 | - | - | 0.50 | - | - |
| ROC-AUCMAX | SVMSPMD | - | - | 0.77 | - | - | 0.81 | - | - |
| range | SVMSPMD | - | - | 0.33 | - | - | 0.31 | - | - |
| mean | SVMSPMD | - | - | 0.62 | - | - | 0.64 | - | - |
| ROC-AUCMAX | SVMSPKINASE-MD | - | - | 0.81 | - | - | 0.85 | - | - |
Training SVMSP with MD Structures
Our SVMSP models have been developed entirely using protein–compound cocrystal structures (positive set) and compounds docked to the target crystal structure (negative set). We explored the possibility of using MD structures to develop SVMSP scoring models. To accomplish this, we followed the same protocol for developing the SVMSP models except that compounds in the negative set were docked to MD snapshots of the target of interest. We continued to use cocrystal structures for the positive set. The resulting SVMSP models (SVMSPMD) were tested on all 500 snapshots for two targets, namely, p38 and CDK2. These targets were selected because of the poor enrichment that was observed in both X-ray and MD structures. A remarkable increase in the ROC-AUC for SVMSPMD was observed for p38, from 0.42 to 0.64 (Figure 3A and Table 3). ROC-AUCMAX was 0.81, compared to 0.54 using the crystal structure. A similar increase in performance was observed for CDK2 by 0.10. The mean ROC-AUC is 0.62, compared with 0.54 for SVMSP trained strictly with crystal structures. In fact, more than 29 snapshots were found to have an ROC-AUC greater than 0.70 for SVMSPMD in contrast to only one snapshot with the standard SVMSP approach. We also developed SVMSPKINASE-MD model applied using strictly kinase cocrystal structures for the positive set. An improvement in the mean ROC-AUC is observed in both cases by nearly 0.05 over SVMSPMD (Figure 3). In addition, a significantly greater number of snapshots with ROC-AUC greater than 0.70 were identified (6% for SVMSPMD versus 20% for SVMSPKINASE-MD). The maximum ROC-AUC also increased by 0.05 relative to SVMSPMD (Table 3).
Figure 3.
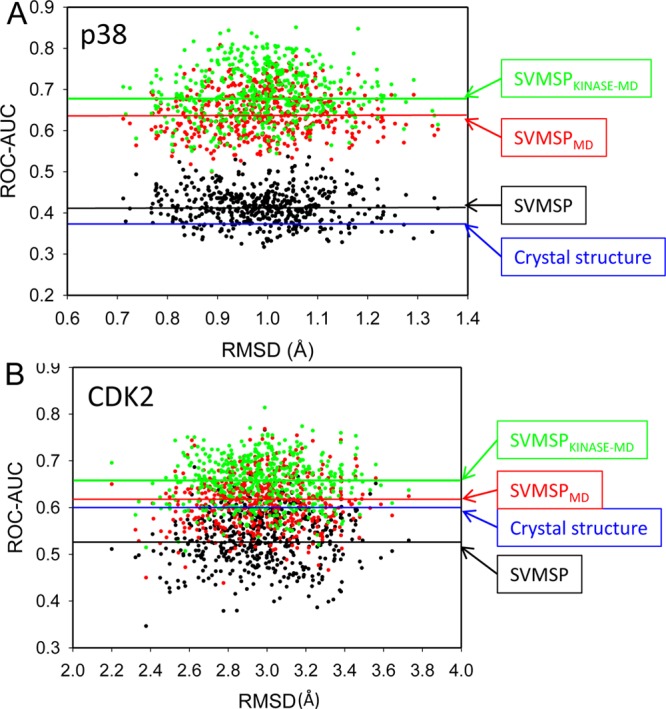
ROC-AUC for individual snapshots using SVMSP trained with MD structures. (A) p38 and (B) CDK2. Blue, black, red, and green lines correspond to the ROC-AUC score of crystal structure by SVMSP model, and average ROC-AUC scores of MD snapshots by the SVMSP model, SVMSPMD model, and SVMSPKINASE-MD model, respectively.
A Priori Selection of MD Snapshots with High Enrichment Power
The aforementioned results show that a subset of MD snapshots possess greater enrichment power than the crystal structure. A question of interest is whether one can preselect these MD structures from an MD simulation of the apo structure in the absence of actives. Our set of protein–compound structures enable us to address this question since we know the enrichment power of each snapshot. The ROC-AUC can be used as a score to rank-order the snapshots.
A plot of ROC-AUC for each snapshot of the proteins in Table 1 reveals that MD snapshots with higher enrichment power have a tendency to have lower average SVMSP scores for negative set compounds (Supporting Information Figure S1). Hence, to identify MD snapshots with high enrichment power, one could dock randomly selected compounds to the snapshots and rank the snapshots with SVMSP. The snapshots with the lowest SVMSP scores are likely to have the highest enrichment power (least likely to bind to the random compounds). To test this we docked a set of randomly selected compounds to each of the 500 snapshots of EGFR and Src. These compounds were scored with SVMSP, and a median decoy score was determined for SVMSP. In each case, snapshots were ranked with the median SVMSP score. To determine how effectively we are filtering these MD snapshots for structures with high enrichment power, we defined ROC-AUC thresholds of 50, 60, 70, 80, and 90% of the ROC-AUC range (ROC-AUCMAX – ROC-AUCMIN) score (Figure 4). So a 50% threshold means that if an MD snapshot has an ROC-AUC that is greater than 50% of the value of the maximum ROC-AUC minus the minimum ROC-AUC, it is considered a true positive. This threshold enabled us to construct ROC curves to test how effectively we are enriching for snapshots that exceed this threshold. In the case of EGFR, assuming a 50% threshold, the ability to a priori identify high enrichment structures is high as evidenced by an ROC-AUC of 0.90 (Figure 4). When a more stringent definition is used for high enrichment power (90% of the ROC-AUC of the crystal structure), the a priori identification of high enrichment power MD structures becomes more challenging as evidenced by a decrease in the ROC-AUC to 0.63. For Src, a similar performance is found with ROC-AUC of 0.71 for a 50% threshold but less significant enrichment was obtained (0.76) using a 90% threshold.
Figure 4.
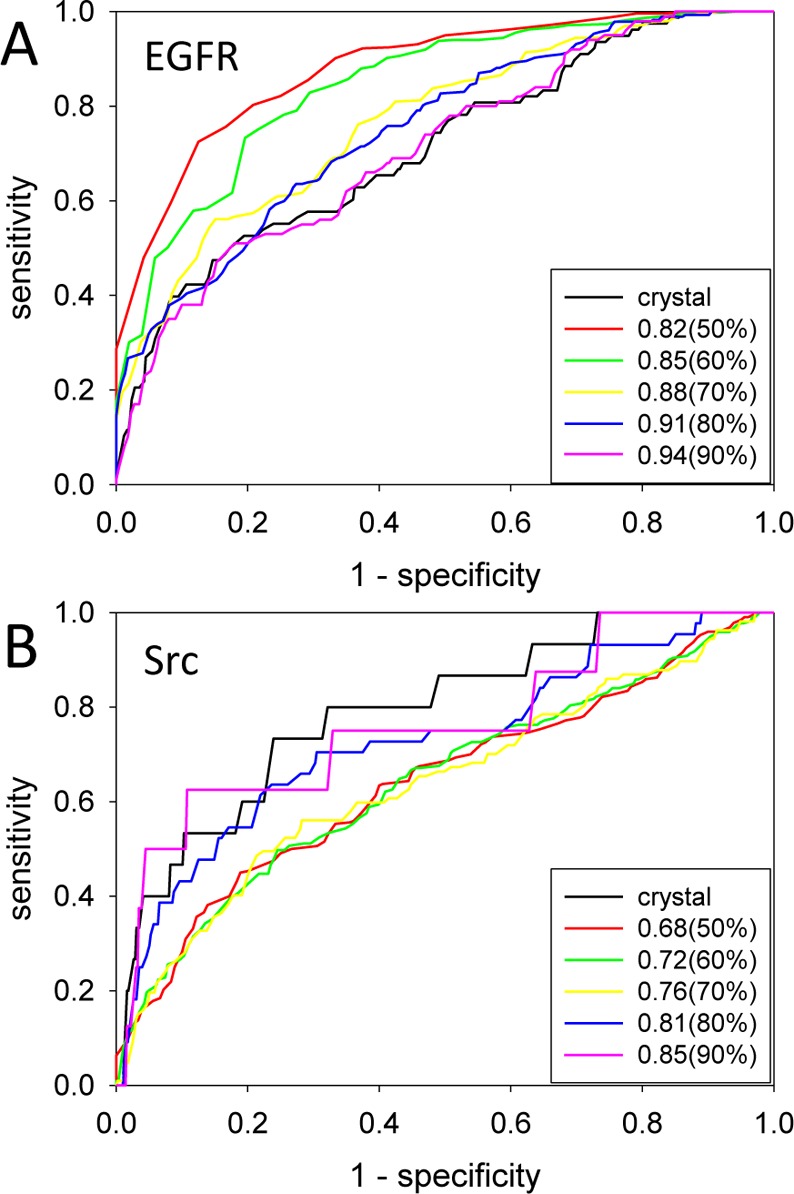
Filtering MD snapshots for a priori identification of high enrichment structures. ROC curves for (A) EGFR and (B) Src protein kinases. Black, red, green, yellow, blue, and magenta curves cutoffs that correspond to crystal structure, 50, 60, 70, 80, and 90% of ROC-AUC range defined as ROC-AUCMAX – ROC-AUCMIN. The number in the legend is the ROC-AUC for each threshold.
Rank-Ordering in Crystal and MD Structures
While ROC-AUC data gave a measure of enrichment, it did not provide insight into the rank-ordering of compounds among MD snapshots. Rank-ordering was compared for MD structures using Kendall’s τ. The correlation metric is a measure of rank correlation, which provides insight into the similarity of the ordering of the data. The correlation coefficient ranges from −1 (anticorrelated) to 1 (correlated). We used τ to compare the rank-ordering of the X-ray and 50 MD snapshot to each other. The data is illustrated in a 2D color-coded map in Figure 5. The maps reveal that changes in the rank-ordering among structures can vary substantially from one protein to the other. In the case of AChE and trypsin, for example, there was little similarity in the ordering of the compounds from snapshot to snapshot as evidenced by the relatively low τ values (Figure 5). In fact, there was a higher tendency for the rank-ordering to be anticorrelated. Src, CDK2, and MDM2, on the other hand, showed less anticorrelation than AChE and trypsin. But the three proteins had more pronounced fluctuation in their rank-ordering. Two targets, p38 and EGFR, revealed even higher τ values (greater than 0.5), suggesting less effect of conformational change on the binding of compounds. Finally, rank-ordering of AR was the least sensitive to changes in the structure of the protein as evidenced by τ values exceeding 0.6 in the majority of structures. Figure 5I shows τ comparing the rank-ordering in the crystal structure versus all the 50 snapshots. Interestingly, the correlation trends show similarity with correlation among MD snapshots. AR was the only case that showed a strong correlation between the ordering of compounds in the X-ray and MD structures. MDM2 snapshots showed the highest similarity in the ordering of compounds with one snapshot that had very similar correlation with the X-ray structure of the protein. AChE snapshots were the least similar to the X-ray structure of the protein.
Figure 5.

Correlation in the rank-ordering of compounds between different structures using Kendall’s τ for (A) AchE; (B) AR; (C) MDM2; (D) p38; (E) trypsin; (F) EGFR; (G) CDK2; (H) Src; and (I) correlation between crystal structure (x-axis) and 50 MD clustered MD snapshots (y-axis). From left to right: AchE, AR, MDM2, p38, trypsin, EGFR, CDK2, and Src. Color coding varies from τ = −0.4 (blue) and τ = 1.0 (red).
Overall, it was interesting that the ordering of compounds among MD structures did not correlate with enrichment performance. For example, the ROC-AUC in p38 was relatively poor compared to EGFR (0.36 and 0.90, respectively), but they both showed similar 2D maps in Figure 5. Conversely, ROC-AUC values were relatively similar in AChE and MDM2 (0.72 and 0.75, respectively), but their similarity maps were dramatically different.
Virtual Screening Chemical Library against MD Structures Leads to ALDH2 Small-Molecule Inhibitors
We applied SVMSP rescoring of MD structures to the aldehyde dehydrogenase 2 (ALDH2) enzyme using SVMSP as the scoring approach. The crystal structure of ALDH2 in its apo form (PDB code: 1O04) was used to carry out explicit-solvent unbiased MD simulations.70−73 Five independent simulations with 7 ns in length (35 ns total) yielded 25 000 snapshots. These were clustered by RMSD using ptraj(74) as described above. A set of 50 representative snapshots were selected from the clusters. A focused set of the ChemDiv commercial library64 containing 50 000 compounds were docked to each of the 50 snapshots by AutoDock Vina.61 Docked receptor–ligand complexes were rescored with SVMSP. For each of the 50 000 compounds, the 50 MD snapshots to which they were docked were ranked and the top score was selected. The scores were used to rank the 50 000 compounds. The top 1000 compounds were clustered into 150 sets that led to the selection of a representative compound from each set. Among the 150 compounds, 111 were commercially available and purchased for screening. A dehydrogenase assay that we have previously developed75 was used to screen all 111 compounds at an initial concentration of 50 μM (Figure 6A). Compounds that inhibited ALDH2 dehydrogenase activity by more than 50% were selected for a follow-up concentration dependent study. Among them, five compounds inhibited the enzyme in a concentration-dependent manner (Figure 6B). The IC50s were 2.32, ∼23, 0.62, 1.58, and 3.51 for ALDH400, ALDH417, ALDH423, ALDH427, and ALDH440, respectively (Figure 6C).
Figure 6.

SVMSP rescoring of MD snapshots identifies ALDH2 inhibitors. The dehydrogenase activity was screened by measuring the rate of increase in the fluorescence of NADH upon propionaldehyde oxidation. (A) Percent activity of ALDH2 in the presence of 50 μM of each of the 111 compounds that were tested; (B) concentration-dependent curves for five compounds that inhibited in the initial screen; and (C) chemical structures for the five compounds (ALDH400, ALDH417, ALDH423, ALDH427, and ALDH440) along with their IC50s for inhibition of ALDH2 dehydrogenase activity.
Three compounds had some structural similarity as highlighted in red in Figure 6C. ALDH417, ALDH423, and ALDH440 contain a phenylfuran moiety. ALDH417 and ALDH440 exhibited even greater similarity that includes a similar thiazolidinone ring. The benzene ring of the phenylfuran is disubstituted in ALDH417 with two chlorine atoms at the meta and para positions, while ALDH423 and ALDH440 possess a fluorine and chlorine atom at the para position, respectively (Figure 6C). Inspection of ALDH427 reveals that the compound has a benzyloxy group that mimics the phenylfuran of ALDH417. The positions of the oxygen atom and benzene rings of the benzyloxy moiety mimic the oxygen atom of the furan and benzene ring of ALDH417, respectively. Comparison of ALDH417, ALDH427, and ALDH440 reveals that there are five bonds between the oxygen atom and the pyrazole, pyrimidine, and pyran rings of ALDH417, ALDH440, and ALDH427, suggesting that the rings occupy a similar position within the binding pocket of ALDH2.
Discussion
We conducted a study to explore how enrichment in virtual screening of chemical libraries is affected by scoring MD structures of protein–compound complexes using a combined machine learning and statistical potential approach that we recently developed (SVMSP). We found that using an ensemble of MD structures showed similar enrichments to the crystal structure even as the size of the ensemble grew to 250 structures. It is worth mentioning that performance for the crystal structure was already good for most structures with four of the eight structures exhibiting ROC-AUC greater than 0.8. Interestingly, analysis of individual MD structures showed that there is a large number of snapshots that led to enrichment that significantly exceeded that of the crystal structure. Further probing revealed that enrichment was not correlated with structural deviation of the MD snapshots from the crystal structure. In addition, different MD snapshots resulted in different rank-ordering of compounds, suggesting that MD snapshots may also enhance diversity of the compounds identified in virtual screening.
These results prompted us to wonder whether using MD structures in the training of SVMSP may further improve enrichment. To test this, we picked two particularly challenging systems, namely, p38 and CDK2, for which enrichment was not better than random in the ensemble. In fact, none of the individual snapshots in p38 exhibited ROC-AUC values that were better than random, and for CDK2, the majority of the snapshots had ROC-AUC lower than 0.6. When SVMSP was trained using compounds docked to MD snapshots (SVMSPMD) for the negative set, we found a substantial increase in the enrichment performance, particularly for p38. The ROC-AUC in the ensemble increased from 0.42 to 0.64 for SVMSPMD and ROC-AUCMAX increased to 0.81 from 0.54 when negative set compounds docked to the crystal structure were used. Even greater enhancement was obtained when the positive set was strictly limited to kinases (SVMSPKINASE-MD), with ROC-AUCMAX reaching 0.85. In CDK2, similar, but less pronounced ,increases were observed.
We applied SVMSP scoring to MD snapshots to the mitochondrial aldehyde dehydrogenase 2 (ALDH2), which catalyzes the NAD+-dependent oxidation of a broad spectrum of endogenous and biogenic aldehydes to their corresponding carboxylic acids. In humans, aldehyde dehydrogenases comprise a diverse gene family with approximately 20 members in the human genome sequence.76 ALDH2 may be an important drug target that has been implicated in drug addiction and other neurological disorders. We applied SVMSP to rank-order compounds docked to MD structures of ALDH2. The purpose of this exercise was not only to put SVMSP scoring of MD snapshots to the test but also for the discovery of small-molecule ALDH2 inhibitors that can be pursued in future drug discovery efforts for this important class of enzyme family. The screening of 50 000 commercially available compounds against 50 MD snapshots of ALDH2 led to five compounds that inhibited the enzyme’s dehydrogenase activity in a concentration-dependent manner. One compound (ALDH423) had submicromolar activity, while another three (ALDH400, ALDH427, and ALDH440) inhibited with IC50s lower than 5 μM. Interestingly, three compounds showed structural similarity. These compounds offer an opportunity to develop small-molecule inhibitors of the ALDH2 with higher affinity and selectivity across members of the ALDH family. The discovery of inhibitors does not validate SVMSP scoring of MD structures, but, combined with the extensive studies using validation sets that we have conducted, this work demonstrates that this approach can result in effective library enrichment.
In summary, we applied our SVMSP scoring approach to rank-order small molecules docked to conformational ensembles of proteins collected from explicit-solvent MD simulations. We found that a larger number of MD structures does not affect enrichment. But MD structures lead to greater diversity in the conformation of small molecules identified in virtual screening. Overall, the performance of SVMSP was better than other scoring functions for X-ray and MD structures. It is worth mentioning that we did not assess whether the docking methods generated accurate poses. This would be difficult to test particularly for the MD snapshots. However, SVMSP is trained using high quality protein–ligand crystal structures as positive set, and we expect that the scoring approach will favor native-like structures. In our previous work, we have shown that filtering protein–ligand MD snapshots with SVMSP resulted in significantly better rank-ordering of these complexes based on the binding affinity.77 Interestingly, MD simulations generated individual MD snapshots that showed significantly better enrichment than the X-ray structure. Two proteins were particularly challenging, and both X-ray and MD structures exhibited random enrichment. To overcome this challenge, we used MD snapshots to train SVMSP models and discovered a remarkable increase in performance in enrichment. We also embarked on an effort to identify high-performance MD structures a priori from an MD simulation of the apo protein. We found that it was possible to enrich apo protein MD structures by scoring randomly selected compounds docked to these structures using SVMSP. Finally, we put SVMSP rescoring to the test by rescoring a commercially available chemical library docked to the ALDH2 enzyme. Enzymology studies for the top candidates that emerged from a set of 50 000 compounds led to four compounds that had IC50s below 5 μM. These compounds serve as leads for the design and synthesis of more potent and selective ALDH2 inhibitors.
Acknowledgments
The research was supported by the NIH (CA135380 and AA0197461) and the INGEN grant from the Lilly Endowment, Inc. (SOM). Computer time on the Big Red supercomputer at Indiana University is funded by the National Science Foundation and by Shared University Research grants from IBM, Inc., to Indiana University.
Supporting Information Available
Tables S1 and S2 and Figure S1, as referenced in the text. This material is available free of charge via the Internet at http://pubs.acs.org.
The authors declare no competing financial interest.
Funding Statement
National Institutes of Health, United States
Supplementary Material
References
- Shoichet B. K.; Kobilka B. K. Structure-based drug screening for G-protein-coupled receptors. Trends Pharmacol. Sci. 2012, 33, 268–272. [DOI] [PMC free article] [PubMed] [Google Scholar]
- Tomašić T.; Kovač A.; Klebe G.; Blanot D.; Gobec S.; Kikelj D.; Mašič L. Virtual screening for potential inhibitors of bacterial MurC and MurD ligases. J. Mol. Model. 2012, 18, 1063–1072. [DOI] [PubMed] [Google Scholar]
- Zheng Z.; Merz K. M. Ligand Identification Scoring Algorithm (LISA). J. Chem. Inf. Model. 2011, 51, 1296–1306. [DOI] [PMC free article] [PubMed] [Google Scholar]
- Böhm H.-J. The development of a simple empirical scoring function to estimate the binding constant for a protein-ligand complex of known three-dimensional structure. J. Comput.-Aided Mol. Des. 1994, 8, 243–256. [DOI] [PubMed] [Google Scholar]
- Korb O.; Stützle T.; Exner T. E. Empirical Scoring Functions for Advanced Protein–Ligand Docking with PLANTS. J. Chem. Inf. Model. 2009, 49, 84–96. [DOI] [PubMed] [Google Scholar]
- Friesner R. A.; Banks J. L.; Murphy R. B.; Halgren T. A.; Klicic J. J.; Mainz D. T.; Repasky M. P.; Knoll E. H.; Shelley M.; Perry J. K.; Shaw D. E.; Francis P.; Shenkin P. S. Glide: A New Approach for Rapid, Accurate Docking and Scoring. 1. Method and Assessment of Docking Accuracy. J. Med. Chem. 2004, 47, 1739–1749. [DOI] [PubMed] [Google Scholar]
- Rarey M.; Kramer B.; Lengauer T.; Klebe G. A Fast Flexible Docking Method using an Incremental Construction Algorithm. J. Mol. Biol. 1996, 261, 470–489. [DOI] [PubMed] [Google Scholar]
- Zilian D.; Sotriffer C. A. SFCscoreRF: A Random Forest-Based Scoring Function for Improved Affinity Prediction of Protein–Ligand Complexes. J. Chem. Inf. Model. 2013, 53, 1923–1933. [DOI] [PubMed] [Google Scholar]
- Li G.-B.; Yang L.-L.; Wang W.-J.; Li L.-L.; Yang S.-Y. ID-Score: A New Empirical Scoring Function Based on a Comprehensive Set of Descriptors Related to Protein–Ligand Interactions. J. Chem. Inf. Model. 2013, 53, 592–600. [DOI] [PubMed] [Google Scholar]
- Jones G.; Willett P.; Glen R. C.; Leach A. R.; Taylor R. Development and validation of a genetic algorithm for flexible docking. J. Mol. Biol. 1997, 267, 727–748. [DOI] [PubMed] [Google Scholar]
- Wang R.; Liu L.; Lai L.; Tang Y. SCORE: A New Empirical Method for Estimating the Binding Affinity of a Protein-Ligand Complex. J. Mol. Model. 1998, 4, 379–394. [Google Scholar]
- Muegge I.; Martin Y. C. A General and Fast Scoring Function for Protein–Ligand Interactions: A Simplified Potential Approach. J. Med. Chem. 1999, 42, 791–804. [DOI] [PubMed] [Google Scholar]
- Muegge I. A knowledge-based scoring function for protein-ligand interactions: Probing the reference state. Perspect. Drug Discovery Des. 2000, 20, 99–114. [Google Scholar]
- Muegge I. Effect of ligand volume correction on PMF scoring. J. Comput. Chem. 2001, 22, 418–425. [Google Scholar]
- Gohlke H.; Hendlich M.; Klebe G. Knowledge-based scoring function to predict protein-ligand interactions. J. Mol. Biol. 2000, 295, 337–356. [DOI] [PubMed] [Google Scholar]
- Ishchenko A. V.; Shakhnovich E. I. SMall Molecule Growth 2001 (SMoG2001): An Improved Knowledge-Based Scoring Function for Protein–Ligand Interactions. J. Med. Chem. 2002, 45, 2770–2780. [DOI] [PubMed] [Google Scholar]
- Mitchell J. B. O.; Laskowski R. A.; Alex A.; Thornton J. M. BLEEP—potential of mean force describing protein–ligand interactions: I. Generating potential. J. Comput. Chem. 1999, 20, 1165–1176. [Google Scholar]
- Velec H. F. G.; Gohlke H.; Klebe G. DrugScoreCSDKnowledge-Based Scoring Function Derived from Small Molecule Crystal Data with Superior Recognition Rate of Near-Native Ligand Poses and Better Affinity Prediction. J. Med. Chem. 2005, 48, 6296–6303. [DOI] [PubMed] [Google Scholar]
- Huang S.-Y.; Zou X. An iterative knowledge-based scoring function to predict protein–ligand interactions: II. Validation of the scoring function. J. Comput. Chem. 2006, 27, 1876–1882. [DOI] [PubMed] [Google Scholar]
- Huang S.-Y.; Zou X. Inclusion of Solvation and Entropy in the Knowledge-Based Scoring Function for Protein–Ligand Interactions. J. Chem. Inf. Model. 2010, 50, 262–273. [DOI] [PMC free article] [PubMed] [Google Scholar]
- Neudert G.; Klebe G. DSX: A Knowledge-Based Scoring Function for the Assessment of Protein–Ligand Complexes. J. Chem. Inf. Model. 2011, 51, 2731–2745. [DOI] [PubMed] [Google Scholar]
- Ewing T. A.; Makino S.; Skillman A. G.; Kuntz I. DOCK 4.0: Search strategies for automated molecular docking of flexible molecule databases. J. Comput.-Aided Mol. Des. 2001, 15, 411–428. [DOI] [PubMed] [Google Scholar]
- Yin S.; Biedermannova L.; Vondrasek J.; Dokholyan N. V. MedusaScore: An Accurate Force Field-Based Scoring Function for Virtual Drug Screening. J. Chem. Inf. Model. 2008, 48, 1656–1662. [DOI] [PMC free article] [PubMed] [Google Scholar]
- Lee M. C.; Duan Y. Distinguish protein decoys by Using a scoring function based on a new AMBER force field, short molecular dynamics simulations, and the generalized born solvent model. Proteins: Struct. Funct. Bioinform. 2004, 55, 620–634. [DOI] [PubMed] [Google Scholar]
- Pencheva T.; Lagorce D.; Pajeva I.; Villoutreix B.; Miteva M. AMMOS: Automated Molecular Mechanics Optimization tool for in silico Screening. BMC Bioinformatics 2008, 9, 438. [DOI] [PMC free article] [PubMed] [Google Scholar]
- Raha K.; Merz K. M. Large-Scale Validation of a Quantum Mechanics Based Scoring Function: Predicting the Binding Affinity and the Binding Mode of a Diverse Set of Protein–Ligand Complexes. J. Med. Chem. 2005, 48, 4558–4575. [DOI] [PubMed] [Google Scholar]
- McGann M. R.; Almond H. R.; Nicholls A.; Grant J. A.; Brown F. K. Gaussian docking functions. Biopolymers 2003, 68, 76–90. [DOI] [PubMed] [Google Scholar]
- Huang N.; Kalyanaraman C.; Irwin J. J.; Jacobson M. P. Physics-Based Scoring of Protein–Ligand Complexes: Enrichment of Known Inhibitors in Large-Scale Virtual Screening. J. Chem. Inf. Model. 2005, 46, 243–253. [DOI] [PubMed] [Google Scholar]
- Ferrara P.; Curioni A.; Vangrevelinghe E.; Meyer T.; Mordasini T.; Andreoni W.; Acklin P.; Jacoby E. New Scoring Functions for Virtual Screening from Molecular Dynamics Simulations with a Quantum-Refined Force-Field (QRFF-MD). Application to Cyclin-Dependent Kinase 2. J. Chem. Inf. Model. 2005, 46, 254–263. [DOI] [PubMed] [Google Scholar]
- Li L.; Wang B.; Meroueh S. O. Support Vector Machine Scoring of Receptor-Ligand Complexes for Virtual Screening of Chemical Libraries. J. Chem. Inf. Model. 2011, 51, 2132–2138. [DOI] [PMC free article] [PubMed] [Google Scholar]
- Li L.; Khanna M.; Jo I.; Wang F.; Ashpole N. M.; Hudmon A.; Meroueh S. O. Target-Specific Support Vector Machine Scoring in Structure-Based Virtual Screening: Computational Validation, In Vitro Testing in Kinases, and Effects on Lung Cancer Cell Proliferation. J. Chem. Inf. Model. 2011, 51, 755–759. [DOI] [PMC free article] [PubMed] [Google Scholar]
- Feixas F.; Lindert S.; Sinko W.; McCammon J. A. Exploring the role of receptor flexibility in structure-based drug discovery. Biophys. Chem. 2014, 186, 31–45. [DOI] [PMC free article] [PubMed] [Google Scholar]
- Tarcsay Á.; Paragi G.; Vass M.; Jójárt B.; Bogár F.; Keserű G. M. The Impact of Molecular Dynamics Sampling on the Performance of Virtual Screening against GPCRs. J. Chem. Inf. Model. 2013, 53, 2990–2999. [DOI] [PubMed] [Google Scholar]
- Nichols S. E.; Baron R.; Ivetac A.; McCammon J. A. Predictive Power of Molecular Dynamics Receptor Structures in Virtual Screening. J. Chem. Inf. Model. 2011, 51, 1439–1446. [DOI] [PMC free article] [PubMed] [Google Scholar]
- Wang L.; Yang C.; Lu W.; Liu L.; Gao R.; Liao S.; Zhao Z.; Zhu L.; Xu Y.; Li H.; Huang J.; Zhu W. Discovery of new potent inhibitors for carbonic anhydrase IX by structure-based virtual screening. Bioorg. Med. Chem. Lett. 2013, 23, 3496–3499. [DOI] [PubMed] [Google Scholar]
- Lu J.; Xin S.; Meng H.; Veldman M.; Schoenfeld D.; Che C.; Yan R.; Zhong H.; Li S.; Lin S. A Novel Anti-Tumor Inhibitor Identified by Virtual Screen with PLK1 Structure and Zebrafish Assay. PLoS One 2013, 8, e53317. [DOI] [PMC free article] [PubMed] [Google Scholar]
- Amaning K.; Lowinski M.; Vallee F.; Steier V.; Marcireau C.; Ugolini A.; Delorme C.; Foucalt F.; McCort G.; Derimay N.; Andouche C.; Vougier S.; Llopart S.; Halland N.; Rak A. The use of virtual screening and differential scanning fluorimetry for the rapid identification of fragments active against MEK1. Bioorg. Med. Chem. Lett. 2013, 23, 3620–3626. [DOI] [PubMed] [Google Scholar]
- Dixit A.; Verkhivker G. M. Integrating Ligand-Based and Protein-Centric Virtual Screening of Kinase Inhibitors Using Ensembles of Multiple Protein Kinase Genes and Conformations. J. Chem. Inf. Model. 2012, 52, 2501–2515. [DOI] [PubMed] [Google Scholar]
- Zhou S.; Li Y.; Hou T. Feasibility of Using Molecular Docking-Based Virtual Screening for Searching Dual Target Kinase Inhibitors. J. Chem. Inf. Model. 2013, 53, 982–996. [DOI] [PubMed] [Google Scholar]
- Stigliani J.-L.; Bernardes-Genisson V.; Bernadou J.; Pratviel G. Cross-docking study on InhA inhibitors: a combination of Autodock Vina and PM6-DH2 simulations to retrieve bio-active conformations. Org. Biomol. Chem. 2012, 10, 6341–6349. [DOI] [PubMed] [Google Scholar]
- Knegtel R. M. A.; Kuntz I. D.; Oshiro C. M. Molecular docking to ensembles of protein structures. J. Mol. Biol. 1997, 266, 424–440. [DOI] [PubMed] [Google Scholar]
- Kim D.; Lee Y. H.; Hwang H. Y.; Kim K. K.; Park H. J. Z-DNA binding proteins as targets for structure-based virtual screening. Curr. Drug Targets 2010, 11, 335–44. [DOI] [PubMed] [Google Scholar]
- Huang S.-Y.; Zou X. Efficient molecular docking of NMR structures: Application to HIV-1 protease. Protein Sci. 2007, 16, 43–51. [DOI] [PMC free article] [PubMed] [Google Scholar]
- Isvoran A.; Badel A.; Craescu C.; Miron S.; Miteva M. Exploring NMR ensembles of calcium binding proteins: Perspectives to design inhibitors of protein-protein interactions. BMC Struct. Biol. 2011, 11, 24. [DOI] [PMC free article] [PubMed] [Google Scholar]
- Schlessinger A.; Khuri N.; Giacomini K. M.; Sali A. Molecular modeling and ligand docking for solute carrier (SLC) transporters. Curr. Top. Med. Chem. 2013, 13, 843–856. [DOI] [PMC free article] [PubMed] [Google Scholar]
- Källblad P.; Todorov N. P.; Willems H. M. G.; Alberts I. L. Receptor Flexibility in the in Silico Screening of Reagents in the S1‘ Pocket of Human Collagenase. J. Med. Chem. 2004, 47, 2761–2767. [DOI] [PubMed] [Google Scholar]
- Zhao H.; Huang D.; Caflisch A. Discovery of Tyrosine Kinase Inhibitors by Docking into an Inactive Kinase Conformation Generated by Molecular Dynamics. ChemMedChem. 2012, 7, 1983–1990. [DOI] [PubMed] [Google Scholar]
- Ekonomiuk D.; Su X.-C.; Ozawa K.; Bodenreider C.; Lim S. P.; Otting G.; Huang D.; Caflisch A. Flaviviral Protease Inhibitors Identified by Fragment-Based Library Docking into a Structure Generated by Molecular Dynamics. J. Med. Chem. 2009, 52, 4860–4868. [DOI] [PubMed] [Google Scholar]
- Ivetac A.; Swift S. E.; Boyer P. L.; Diaz A.; Naughton J.; Young J. A. T.; Hughes S. H.; McCammon J. A. Discovery of Novel Inhibitors of HIV-1 Reverse Transcriptase Through Virtual Screening of Experimental and Theoretical Ensembles. Chem. Biol. Drug Des. 2014, 83, 521–531. [DOI] [PMC free article] [PubMed] [Google Scholar]
- Cala O.; Remy M.-H.; Guillet V.; Merdes A.; Mourey L.; Milon A.; Czaplicki G. Virtual and Biophysical Screening Targeting the γ-Tubulin Complex – A New Target for the Inhibition of Microtubule Nucleation. PLoS One 2013, 8, e63908. [DOI] [PMC free article] [PubMed] [Google Scholar]
- Zhao H.; Huang D.; Caflisch A. Discovery of Tyrosine Kinase Inhibitors by Docking into an Inactive Kinase Conformation Generated by Molecular Dynamics. ChemMedChem. 2012, 7, 1983–1990. [DOI] [PubMed] [Google Scholar]
- Khanna M.; Wang F.; Jo I.; Knabe W. E.; Wilson S. M.; Li L.; Bum-Erdene K.; Li J.; W. Sledge G.; Khanna R.; Meroueh S. O. Targeting Multiple Conformations Leads to Small Molecule Inhibitors of the uPAR·uPA Protein–Protein Interaction That Block Cancer Cell Invasion. ACS Chem. Biol. 2011, 6, 1232–1243. [DOI] [PMC free article] [PubMed] [Google Scholar]
- Xu M.; Lill M. A. Utilizing experimental data for reducing ensemble size in flexible-protein docking. J. Chem. Inf. Model. 2011, 52, 187–198. [DOI] [PMC free article] [PubMed] [Google Scholar]
- Huang N.; Shoichet B. K.; Irwin J. J. Benchmarking Sets for Molecular Docking. J. Med. Chem. 2006, 49, 6789–6801. [DOI] [PMC free article] [PubMed] [Google Scholar]
- O’Boyle N.; Banck M.; James C.; Morley C.; Vandermeersch T.; Hutchison G. Open Babel: An open chemical toolbox. J. Cheminform. 2011, 3, 33. [DOI] [PMC free article] [PubMed] [Google Scholar]
- Berman H. M.; Westbrook J.; Feng Z.; Gilliland G.; Bhat T. N.; Weissig H.; Shindyalov I. N.; Bourne P. E. The Protein Data Bank. Nucleic Acids Res. 2000, 28, 235–242. [DOI] [PMC free article] [PubMed] [Google Scholar]
- Word J. M.; Lovell S. C.; Richardson J. S.; Richardson D. C. Asparagine and glutamine: using hydrogen atom contacts in the choice of side-chain amide orientation. J. Mol. Biol. 1999, 285, 1735–1747. [DOI] [PubMed] [Google Scholar]
- Jorgensen W. L.; Chandrasekhar J.; Madura J. D.; Impey R. W.; Klein M. L. Comparison of simple potential functions for simulating liquid water. J. Chem. Phys. 1983, 79, 926–935. [Google Scholar]
- Case D. A.; Darden T. A.; Cheatham I. E. III; Simmerling C. L.; Wang J.; Duke R. E.; Luo R.; Merz K. M.; Pearlman D. A.; Crowley M.; Walker R. C.; Zhang W.; Wang B.; Hayik S.; Roitberg A.; Seabra G.; Kolossváry I.; Wong K. F.; Paesani F.; Wu X.; Brozell S. R.; Tsui V.; Schafmeister H.; Ross W. S.; Kollman P. A.. AMBER9; University of California: San Fransico, 2006. [Google Scholar]
- Duan Y.; Wu C.; Chowdhury S.; Lee M. C.; Xiong G.; Zhang W.; Yang R.; Cieplak P.; Luo R.; Lee T.; Caldwell J.; Wang J.; Kollman P. A point-charge force field for molecular mechanics simulations of proteins based on condensed-phase quantum mechanical calculations. J. Comput. Chem. 2003, 24, 1999–2012. [DOI] [PubMed] [Google Scholar]
- Ryckaert J.-P.; Ciccotti G.; Berendsen H. J. C. Numerical integration of the cartesian equations of motion of a system with constraints: molecular dynamics of n-alkanes. J. Comput. Phys. 1977, 23, 327–341. [Google Scholar]
- Kellenberger E.; Muller P.; Schalon C.; Bret G.; Foata N.; Rognan D. sc-PDB: an Annotated Database of Druggable Binding Sites from the Protein Data Bank. J. Chem. Inf. Model. 2006, 46, 717–727. [DOI] [PubMed] [Google Scholar]
- Trott O.; Olson A. J. AutoDock Vina: Improving the speed and accuracy of docking with a new scoring function, efficient optimization, and multithreading. J. Comput. Chem. 2010, 31, 455–461. [DOI] [PMC free article] [PubMed] [Google Scholar]
- Triballeau N.; Acher F.; Brabet I.; Pin J.-P.; Bertrand H.-O. Virtual screening workflow development guided by the “receiver operating characteristic” curve approach. Application to high-throughput docking on metabotropic glutamate receptor subtype 4. J. Med. Chem. 2005, 48, 2534–2547. [DOI] [PubMed] [Google Scholar]
- Madhavi Sastry G.; Adzhigirey M.; Day T.; Annabhimoju R.; Sherman W. Protein and ligand preparation: parameters, protocols, and influence on virtual screening enrichments. J. Comput.-Aided Mol. Des. 2013, 27, 221–234. [DOI] [PubMed] [Google Scholar]
- Irwin J. J.; Sterling T.; Mysinger M. M.; Bolstad E. S.; Coleman R. G. ZINC: a free tool to discover chemistry for biology. J. Chem. Inf. Model. 2012, 52, 1757–68. [DOI] [PMC free article] [PubMed] [Google Scholar]
- Duan J.; Dixon S. L.; Lowrie J. F.; Sherman W. Analysis and comparison of 2D fingerprints: Insights into database screening performance using eight fingerprint methods. J. Mol. Graphics Model. 2010, 29, 157–170. [DOI] [PubMed] [Google Scholar]
- Sastry M.; Lowrie J. F.; Dixon S. L.; Sherman W. Large-Scale Systematic Analysis of 2D Fingerprint Methods and Parameters to Improve Virtual Screening Enrichments. J. Chem. Inf. Model. 2010, 50, 771–784. [DOI] [PubMed] [Google Scholar]
- Eldridge M.; Murray C.; Auton T.; Paolini G.; Mee R. Empirical scoring functions: I. The development of a fast empirical scoring function to estimate the binding affinity of ligands in receptor complexes. J. Comput.-Aided Mol. Des. 1997, 11, 425–445. [DOI] [PubMed] [Google Scholar]
- Jones G.; Willett P.; Glen R. C. Molecular recognition of receptor sites using a genetic algorithm with a description of desolvation. J. Mol. Biol. 1995, 245, 43–53. [DOI] [PubMed] [Google Scholar]
- Chong L. T.; Dempster S. E.; Hendsch Z. S.; Lee L.-P.; Tidor B. Computation of electrostatic complements to proteins: A case of charge stabilized binding. Protein Sci. 1998, 7, 206–210. [DOI] [PMC free article] [PubMed] [Google Scholar]
- Si J.; Mueller L.; Collins S. J. CaMKII regulates retinoic acid receptor transcriptional activity and the differentiation of myeloid leukemia cells. J. Clin. Invest. 2007, 117, 1412–1421. [DOI] [PMC free article] [PubMed] [Google Scholar]
- Ang E. S.; Zhang P.; Steer J. H.; Tan J. W.; Yip K.; Zheng M. H.; Joyce D. A.; Xu J. Calcium/calmodulin-dependent kinase activity is required for efficient induction of osteoclast differentiation and bone resorption by receptor activator of nuclear factor kappa B ligand (RANKL). J. Cell. Physiol. 2007, 212, 787–95. [DOI] [PubMed] [Google Scholar]
- Marganski W. A.; Gangopadhyay S. S.; Je H. D.; Gallant C.; Morgan K. G. Targeting of a novel Ca+2/calmodulin-dependent protein kinase II is essential for extracellular signal-regulated kinase-mediated signaling in differentiated smooth muscle cells. Circ. Res. 2005, 97, 541–549. [DOI] [PubMed] [Google Scholar]
- Bouallegue A.; Pandey N. R.; Srivastava A. K. CaMKII knockdown attenuates H2O2-induced phosphorylation of ERK1/2, PKB/Akt, and IGF-1R in vascular smooth muscle cells. Free Radic. Biol. Med. 2009, 47, 858–66. [DOI] [PubMed] [Google Scholar]
- Case D. A.; Darden T. A.; Cheatham T. E. III; Simmerling C. L.; Wang J.; Duke R. E.; Luo R.; Walker R. C.; Zhang W.; Merz K. M.; Roberts B.; Hayik S.; Roitberg A.; Seabra G.; Swails J.; Goetz A. W.; Kolossváry I.; Wong K. F.; Paesani F.; Vanicek J.; Wolf R. M.; Liu J.; Wu X.; Brozell S. R.; Steinbrecher T.; Gohlke H.; Cai Q.; Ye X.; Wang J.; Hsieh M.-J.; Cui G.; Roe D. R.; Mathews D. H.; Seetin M. G.; Salomon-Ferrer R.; Sagui C.; Babin V.; Luchko T.; Gusarov S.; Kovalenko A.; Kollman P. A.. AMBER 12; University of California: San Fransico, 2012. [Google Scholar]
- Parajuli B.; Kimble-Hill A. C.; Khanna M.; Ivanova Y.; Meroueh S.; Hurley T. D. Discovery of novel regulators of aldehyde dehydrogenase isoenzymes. Chem.-Biol. Interact. 2011, 191, 153–158. [DOI] [PMC free article] [PubMed] [Google Scholar]
- Vasiliou V.; Nebert D. W. Analysis and update of the human aldehyde dehydrogenase (ALDH) gene family. Hum. Genomics 2005, 2, 138–43. [DOI] [PMC free article] [PubMed] [Google Scholar]
- Wang B.; Li L.; Hurley T. D.; Meroueh S. O. Molecular Recognition in a Diverse Set of Protein–Ligand Interactions Studied with Molecular Dynamics Simulations and End-Point Free Energy Calculations. J. Chem. Inf. Model. 2013, 53, 2659–2670. [DOI] [PMC free article] [PubMed] [Google Scholar]
Associated Data
This section collects any data citations, data availability statements, or supplementary materials included in this article.