

Abstract
Iron deficiency is a common cause of reactive thrombocytosis, however, the exact pathways have not been revealed. Here we aimed to study the mechanisms behind iron deficiency‐induced thrombocytosis. Within few weeks, iron‐depleted diet caused iron deficiency in young Sprague–Dawley rats, as reflected by a drop in hemoglobin, mean corpuscular volume, hepatic iron content and hepcidin mRNA in the liver. Thrombocytosis established in parallel. Moreover, platelets produced in iron deficient animals displayed a higher mean platelet volume and increased aggregation. Bone marrow studies revealed subtle alterations that are suggestive of expansion of megakaryocyte progenitors, an increase in megakaryocyte ploidy and accelerated megakaryocyte differentiation. Iron deficiency did not alter the production of hematopoietic growth factors such as thrombopoietin, interleukin 6 or interleukin 11. Megakaryocytic cell lines grown in iron‐depleted conditions exhibited reduced proliferation but increased ploidy and cell size. Our data suggest that iron deficiency increases megakaryopoietic differentiation and alters platelet phenotype without changes in megakaryocyte growth factors, specifically TPO. Iron deficiency‐induced thrombocytosis may have evolved to maintain or increase the coagulation capacity in conditions with chronic bleeding. Am. J. Hematol. 89:524–529, 2014. © 2014 Wiley Periodicals, Inc.
Introduction
Platelets are an essential component of coagulation and therefore conserved in all vertebrates. An increase in platelets counts can be either induced by a myeloproliferative process or be reactive. Secondary thrombocytosis may be a response to acute infection or inflammation, chronic inflammatory diseases, postoperative stress, post‐splenectomy, or malignancy. Iron deficiency (ID) is a recognized cause of reactive thrombocytosis, even outside the setting of inflammation. This finding is supported by clinical reports 1, also by our group 3, as well as animal studies 5.
The clinical significance of increased platelet counts is not established. Although reactive thrombocytosis has been generally considered benign, there are numerous case reports describing both arterial and venous thrombotic events in ID‐associated platelet elevation 7. Prospective studies identified elevated platelet counts as an independent risk factor for the development of venous thromboembolism (VTE) in cancer patients 8. Another study in ID patients with inflammatory bowel disease demonstrated thrombocytosis, aggregation, and P‐selectin expression that was reversed by iron replacement independent of disease activity 4. The extent to which ID‐induced thrombocytosis plays a role in VTE in noncancer patients remains elusive.
Platelets are derived from megakaryocytes (MEGs) which constitute the least numerous but largest cells in the bone marrow (BM). MEGs develop from the common hematopoietic progenitor cells which differentiate into mature platelet producing cells over several steps. A proliferation phase at the burst forming unit (BFU)‐MEG and colony forming unit (CFU)‐MEG level is followed by an endomitotic phase. Endomitosis is characterized by incomplete mitosis with failure of cytokinesis 11. Endomitosis increases ploidy in geometric progression (i.e., 2n, 4n, 8n, 16n etc). In parallel, MEGs undergo expansion and reorganization of the cytoplasm, expression of MEG‐specific surface markers such as CD41, CD61, and CD42, and, finally, formation of proplatelets. Thus, each MEG generates 1,000–3,000 platelets. Megakaryopoiesis and platelet formation are governed by hematopoietic growth factors. Thrombopoietin (TPO) is the principal regulator of megakaryopoiesis, affecting self‐renewal and expansion of hematopoietic stem cells, proliferation of megakaryocyte progenitors, and supporting their maturation into platelet‐producing cells 14. Other contributing mediators are stem cell factor, stromal‐derived factor 1, and interleukins 3, 6, and 11. It is currently unknown how ID leads to increased platelet counts, but direct effects on megakaryopoiesis as well as a cytokine‐mediated enhancement of thrombopoiesis have been proposed 1.
Here we studied the mechanisms underlying ID‐induced thrombocytosis. We present an animal model that displays thrombocytosis upon ID diet. We show that such platelets have an increased aggregation capability. BM and cell culture studies suggest that this effect may be driven by increased MEG endomitosis and accelerated MEG differentiation.
Methods
Animals
Three to four‐weeks‐old male Sprague‐Dawley rats (Himberg, Austria) were kept under conventional husbandry. Food and water were available ad libitum. ID groups received an iron‐depleted diet (<10 mg iron/kg chow, Altromin, Lage, Germany), while controls received a diet with regular iron content (180 mg iron/kg, Altromin). Blood was taken weekly from the sublingual vein. Blood counts were analyzed on a Cell‐Dyn 3500 analyzer (Abbott Diagnostics, Abbott Park, IL). Sacrifice was performed via overdose of thiopental‐sodium and subsequent bleeding by cardiac puncture. The experiments were performed in accordance with the Guidelines for Good Scientific Practice of the Medical University of Vienna, and an official approval was obtained from the Austrian Federal Ministry for Science and Research.
Bone marrow preparation
Immediately following sacrifice, humeri, femurs, and tibias were harvested, and the bones were flushed through with CATCH buffer 15. The cell suspension was filtered twice through a 100 μm cell strainer (Becton Dickinson, Franklin Lakes, NJ). For flow cytometry, this cell suspension was then passed through a Ficoll gradient in order to enrich megakaryocytes and to remove erythrocytes and platelets.
MegaCult‐C assay
To quantify CFU‐MEG cells in BM, the MegaCult‐C assay (Stemcell Technologies, Vancouver, Canada) was adapted for rat BM. In brief, the provided MegaCult medium was supplemented with 50 ng mL−1 recombinant human (rh) TPO (R&D Systems, Minneapolis, MN), 10 ng mL−1 recombinant rat (rr) IL‐3, 10 ng mL−1 rrIL‐6 and 50 ng mL−1 rhIL‐11 (Cell Systems, Kirkland, WA). Rat BM cells were resuspended in Iscove's modified Dulbecco's medium to yield 2 × 10⁵ cells/slide. Collagen was added, and the cell suspension was transferred to double chamber slides. Cells were cultured for 7 days. Cultures were dehydrated, fixed in acetone and stained for cholinesterase 16. Megakaryocytic colonies were quantified under a light microscope.
Analysis of megakaryocyte ploidy
Ploidy was assessed by flow cytometry using a Cell Lab Quanta SC flow cytometer (Beckman Coulter, Fullerton, CA), or FACScan cytometer (BD Biosciences, Mountain View, CA). All steps were performed in CATCH buffer (BM), or phosphate‐buffered saline (PBS; for cell lines). DNA was stained either using Hoechst 33342 (Invitrogen, Carlsbad, California), or propidium iodide (Sigma) following a fixation/permeabilization step in 70% ethanol. For rat BM samples, a blocking step in 20% fetal calf serum in PBS followed by CD41 staining using an antibody to CD41 (Abcam, Cambridge, UK) was performed.
Bone marrow histology
After fixation in Schaffer's solution (Morphisto, Frankfurt am Main, Germany), decalcification in 10% EDTA and embedding in paraffin, 2‐µm‐thick sternum sections were stained with an antibody against CD61 (Abcam). Morphometric analysis was performed for CD61‐positive cells using the TissueFaxs™ and HistoQuest™ 3.0 software (TissueGnostics GmbH, Vienna, Austria, www.tissuegnostics.com) for four randomly selected areas of 0.4 × 0.3 mm2 per slide. Events < 5 µm in diameter were excluded. Total MEG area and the number of MEGs per µm2 were obtained. Mean MEG area was calculated by dividing the total MEG area by the number of MEGs. The selection of areas was performed under blinding for the allocation of study groups.
Measurement of hepatic iron content
Hepatic iron content was quantified by a colorimetric assay as described by Cook et al. 17 as µg iron per mg protein. Protein concentration was measured by Bradford protein assay (Biorad, Hercules, CA) after generation of a standard BSA curve.
Measurement of cytokine levels by real‐time RT‐PCR
Liver, spleen, and kidney tissues were snap‐frozen immediately after sacrifice. Total RNA was isolated using the TRIzol reagent (Invitrogen) and reverse‐transcribed into cDNA. QuantiTect primers for rat TPO, EPO, IL‐3, IL‐6, IL‐11, hepcidin, C‐reactive protein and ribosomal 18S and 28S RNA gene 1 (housekeeping gene) were ordered from Qiagen. Real time PCRs were performed using the QuantiTect SYBR‐green PCR kit (Qiagen) on an ABI Prism 7700 Sequence Detector (Applied Biosystems, Foster City, CA). Expression levels of the targets were quantified using the Delta‐Ct method.
Measurement of thrombocyte aggregation
Light transmission aggregometry was performed using heparinized whole blood derived by cardiac puncture. Platelet‐rich plasma was obtained by centrifugation at 100g for 20 min. Platelets were aggregated at 37°C in a microplate reader (Anthos Labtec Instruments GmbH, Wals‐Siezenheim, Austria). Readings with a 595 nm filter were repeated every 30 s. The aggregation was carried out with 3 × 10⁵ platelets/µL, using ADP (0–50 µM). Controls for 100% transmission (platelet‐poor plasma) and zero level (platelet‐rich plasma) were measured. The data were converted to aggregation curves and areas under the curve (AUC) were calculated.
Cell lines and culture conditions
Megakaryocytic cell lines (HEL, Dami, CMK) were maintained in a serum‐free medium (Panserin 401, PAN‐Biotech, Aidenbach, Germany). To induce ID, the cells were grown either in Panserin 401S (PAN‐Biotech; Dami), a customized iron‐ and transferrin‐free medium based on Panserin 401, or in Panserin 401S supplemented with Panserin 401 to 1.25% (volume/volume; HEL and CMK).
Cell growth assays
Proliferation of MEG cell lines was assessed by MTT assays. Ten thousand cells (Dami, HEL) or 2 × 10⁵ cells (CMK) were seeded in iron‐containing and ID conditions as described above. On days 0 and 7, after 2‐hr incubation with MTT solution (3‐(4,5 dimethyl thiazol‐2‐yl)−2,5 diphenyl tetrazoium bromide, Sigma) and dissolution of the formazan crystals with acidified sodium dodecylsulfate solution (Sigma), absorbance at 570 nm was measured either on an Anthos Labtec HT2 or on an Anthos 2010 Photometer (both from Biochrom, Cambridge, UK). The fold growth was calculated using the day 0 value as reference.
Statistics
All data are presented as mean ± standard deviation. Time courses were analyzed using mixed linear models for repeated measures. Differences in means from non‐repeated measures were assessed using ANOVA. P values below 0.05 were considered statistically significant. All analyses were performed on SPSS for Windows, version 21.0.
Results
Iron‐depleted diet induces iron deficiency and anemia in rats
Our first goal was to establish a robust animal model of diet‐induced ID. We studied changes in hematological parameters over 10 weeks in ID and control rats. In ID rats, a fall in hemoglobin (Hb) occurred in the first few weeks, and Hb levels remained low throughout the experiment (Fig. 1A). Mean Hb across all time points was 9.47 ± 1.25 g dL−1 for ID, and 14.36 ± 0.96 g dL−1 for controls (P < 0.001). Similar changes were observed in hematocrit (not shown) and MCV (mean corpuscular volume), consistent with induction of ID. An age‐dependent decrease in MCV occurred in both groups 18, but was stronger in ID, reaching a minimum of 35.83 ± 0.61 fL at week 8 (Fig. 1B).
Figure 1.
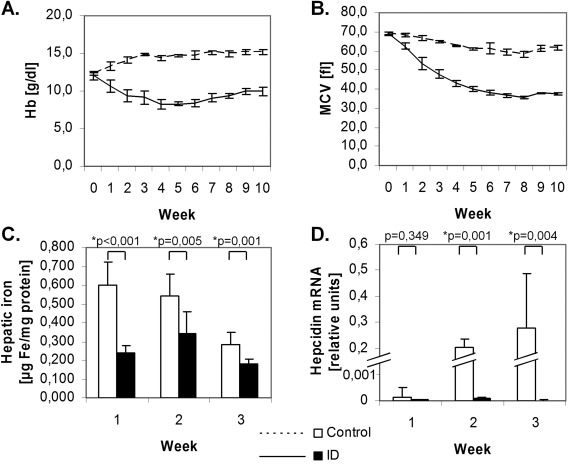
Induction of iron deficiency and anemia in rats. ID diet rapidly leads to drop in Hb (A), MCV (B) (n=4 per group) and hepatic iron content (C) (n=8 per group). Liver hepcidin mRNA was higher in control animals and only at detection limit in ID as measured by real time PCR (D; n=8 per group).
Differences in hepatic iron were observed already at week 1 (Fig. 1C). Hepatic iron content at this time was 0.241 ± 0.035 µg iron/mg protein in ID, and 0.601 ± 0.119 µg mg−1 in controls (P < 0.001). Liver hepcidin mRNA was significantly lower in ID (P < 0.001; Fig. 1D).
Iron deficiency increases platelet counts and volume, and results in augmented platelet aggregation
In parallel, platelet counts increased after week 1 and reached a plateau at week 4. The mean platelet count across all time points was 1445 ± 276 G L−1 vs. 976 ± 97 G L−1 (ID vs. controls; P < 0.001) (Fig. 2A). The mean platelet volume (MPV) increased in the ID group with a mean of 11.2 fL compared to 9.5 fL in controls (P = 0.004, Fig. 2B). Light transmission aggregometry after stimulation with ADP demonstrated a considerably larger AUC in ID (P = 0.001 by ANOVA; Fig. 2C).
Figure 2.
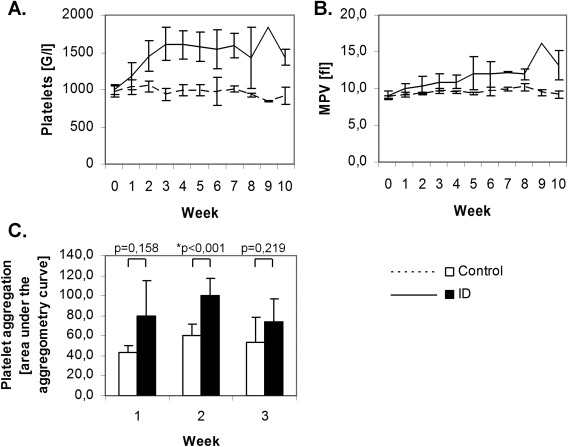
Iron deficiency induces thrombocytosis and enhances platelet aggregation. Development of ID was paralleled by a rise in platelet counts (A) and an increase in MPV (B; n=4 per group). Light transmission aggregometry demonstrated that, in ID, platelet aggregation was enhanced as reflected by the significantly higher area under the aggregometry curve (C; n=8 per group).
Expression of hematopoietic growth factors in ID
The mRNA expression of several hematopoietic growth factors was assessed in liver, kidney and spleen by quantitative real time PCR in a separate set of animals. The selected time points for these analyses were weeks 1–3, i.e. within the period where the rise in platelet levels and the drop in hemoglobin fully developed. TPO mRNA was expressed in the liver and to a lesser degree in kidney tissue (Supporting Information Fig. 1A,B). Liver TPO mRNA increased in both groups during the experiment; however, there were no significant differences between the groups. EPO mRNA was found at similar levels in both kidney and liver samples (Supporting Information Fig. 1C,D) and was overexpressed in ID (P < 0.001 for liver, P = 0.022 for kidney). EPO levels dropped continuously over time. IL‐3 expression was at detection limit in all tested tissues (not shown). IL‐6 expression in the spleen was low, with the exception of week 3, where some ID animals demonstrated elevated IL‐6 mRNA levels (Supporting Information Fig. 1E). Similar changes were observed in IL‐11 expression (Supporting Information Fig. 1F). Differences between groups were not statistically significant. As a marker of the activity of proinflammatory and putatively pro‐megakaryopoietic cytokines, we also measured C‐reactive protein mRNA in the liver. CRP mRNA progressively increased over time, but no differences between the groups were noted (Supporting Information Fig. 1G).
Iron deficiency induces changes in megakaryocyte differentiation
Next we analyzed ID‐driven megakaryopoiesis. The same set of animals as in the analysis of hematopoietic growth factors was used. The number of CFU‐MEGs in BM demonstrated an age‐dependent increase in CFU‐MEGs for both groups, but to a higher extent in ID animals (P = 0.004 by ANOVA, Supporting Information Fig. 2). This differential rise in CFU‐MEG was most pronounced at week 3.
To test for the changes in MEG ploidy, CD41‐positive BM cells were assessed by flow cytometry (Supporting Information Table I). Upon ID, the fraction of low ploidy cells (2n and 8n) dropped from week 1 to 3 (2n and 8n: P > 0.05; t tests), whereas 16n cells increased (P = 0.024; t test). In control animals, the changes were not as pronounced (P > 0.05 for all ploidy levels). However, ANOVA tests did not show statistically significant differences between the groups.
A morphometric analysis of BM histology (Fig. 3) demonstrated a time‐dependent increase in total MEG area (reflecting total MEG mass) and MEG number in both groups. The mean MEG area, a parameter relating to MEG ploidy, showed an increasing trend in ID animals from week 1 to 3 (P < 0.001 by t test) but not in the control group (P > 0.05 by t test). The observed differences were too subtle to account for statistically significant differences between the groups by ANOVA.
Figure 3.

Morphometric analysis of megakaryocytes. BM histology samples were stained for CD61 to identify MEGs (A). Total MEG area (B), number of MEGs (C) and mean MEG area (D) were obtained by morphometrical analysis. No statistically significant differences between the groups could be observed for any of the parameters. N=8 per group. [Color figure can be viewed in the online issue, which is available at wileyonlinelibrary.com.]
Iron deficiency inhibits proliferation but induces polyploidy in megakaryocytic cell lines
To test whether ID influences megakaryopiesis independently of hematopoietic growth factors, we examined the effect of ID growth conditions in the megakaryocytic cell lines Dami, HEL and CMK. ID inhibited proliferation in all cell lines, as reflected by the MTT assays (Fig. 4A). At the same time, the fraction of polyploid cells (i.e., > 4n) increased about two‐fold under ID (Fig. 4B,C). These changes in ploidy were paralleled by an increase in cell size, as observed by light microscopy (Fig. 4D).
Figure 4.
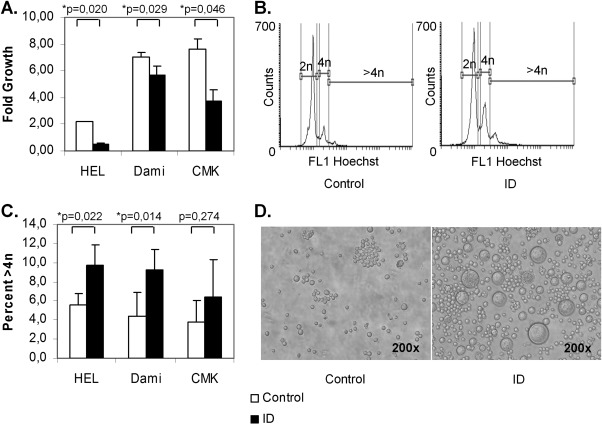
Iron deficiency inhibits proliferation but increases ploidy in megakaryocytic cell lines. HEL, Dami and CMK cells were grown in serum‐free medium either repleted with iron (control) or without iron‐ and transferrin (ID). ID led to a significant decrease in proliferation as assessed by MTT assays (A) but to an increase in polyploid cells (>4n), measured by flow cytometry (B (representative flow cytometry histograms of Hoechst‐stained HEL cells); C). In parallel, cell size increased (demonstrated for HEL cells, D). The results from 2 to 3 independent experiments are shown.
Discussion
Here, we present an animal model of ID that developed sustained anemia and thrombocytosis within few weeks. Platelets produced in ID displayed a different phenotype as they were higher in number, larger, and showed enhanced aggregation. These effects were independent of changes in hematopoietic growth factors, specifically TPO. In vitro experiments with various megakaryocytic cell lines confirmed a direct effect of ID on megakaryopoiesis by inhibiting proliferation and increasing polyploidy. We conclude that ID itself is a factor influencing platelet production both quantitatively and qualitatively.
Unfortunately we failed to identify the mechanism by which ID leads to increased platelet production. Elevated platelet counts may arise from enhanced production, release from the spleen or by prolonged platelet survival. Platelet counts may also rise due to platelet division in the circulation 19. Because of the sustained thrombocytosis in our model, elevated platelet counts are unlikely the result of splenic release or longer half‐life, but rather from enhanced production. Megakaryopoiesis may be augmented at each differentiation step, including the proliferative phase, the endomitotic process, cytoplasmic maturation of MEGs and platelet shedding into the circulation. Depletion of iron results in cell cycle arrest in most tissues because iron‐containing proteins exert a variety of vital functions 20. Our studies in megakaryocytic cell lines confirm that iron is essential also for the proliferation of MEGs. BM studies revealed no rise in MEG numbers; however, we observed subtle changes with higher numbers of CFU‐MEGs in ID suggestive of increased commitment of hematopoietic progenitors into the MEG lineage. This discrepancy could be explained by accelerated MEG differentiation and subsequent clearance of mature MEGs from the BM after platelet shedding.
It is surprising that in our ID rats megakaryopoiesis is enhanced without a marked increase in the total MEG mass. Physiologically, few large MEGs are sufficient for platelet output. Large MEGs are a result of endomitosis which allows an increase in cell mass without the need to devote energy to execute all aspects of mitosis 21. Furthermore, polyploidy differentially regulates genes needed for MEG maturation and platelet production 22. Thus, endomitosis results in higher differentiated cells that are capable of producing more platelets than a cell of lower ploidy 23. Endomitosis may maintain platelet output even when earlier proliferative differentiation steps are impaired, thus providing a possible iron‐saving strategy.
Our data demonstrate increased ploidy in MEG cell lines and a similar trend in ID rats. Indeed, the BM changes were subtle, and our experimental system might have not been sensitive enough to reveal significant differences between the groups. As we were not able to study terminal differentiation and platelet shedding in vivo, a possible enhanced MEG differentiation independent of polyploidy cannot be ruled out.
To test whether thrombocytosis in ID is mediated by hematopoietic growth factors we analyzed mRNA expression in various tissues. TPO mRNA was unchanged between groups, making it unlikely that the action of ID is TPO‐dependent. There was an increase in TPO mRNA over time in both groups, paralleled by a rising number of CFU‐MEGs. The significance of this finding is unclear but it might be related to an age‐dependent phenomenon. Also IL‐6 and IL‐11 were comparable in ID and control animals, except for the last week, after platelet increase had already been established. CRP expression, which is upregulated by IL‐6 and IL‐11 action, also revealed no difference between the groups. Unfortunately, serum was unavailable to confirm the mRNA data on protein level. EPO mRNA was elevated in ID rats, probably due to anemia and hypoxia 24. There is an ongoing debate whether EPO may directly stimulate platelet production. It elevates platelet counts in vivo 25, and stimulates MEG proliferation in synergy with other megakaryopoietic cytokines in vitro 26. However, EPO alone supports very little MEG growth 27 as maturing MEGs lose the EPO receptor 28, and EPO exerts no direct action on the TPO receptor c‐mpl 26. Most importantly, EPO levels correlate poorly with platelet counts and can be elevated without the presence of thrombocytosis 24. In addition, ID‐induced thrombocytosis resolves upon iron replacement even in patients receiving erythropoiesis stimulating agents 3. Indeed, several authors speculate that EPO‐induced thrombocytosis is caused by functional ID rather than by a direct effect of EPO on megakaryopoiesis 3.
Whether elevated platelet counts predispose to thromboembolic complications has not been firmly established. The CATS‐study 8 has identified thrombocytosis in cancer patients as an independent risk factor for thromboembolism. In ID, only case reports 1 indicate a possible involvement of thrombocytosis in thromboembolism, although some conditions with high prevalence of ID such as inflammatory bowel disease 33 or chronic kidney disease 31 do show increased rate of thromboembolic complications. Our study is the first to link enhanced platelet aggregation with ID‐induced thrombocytosis. Furthermore, we observed an increase in MPV in ID animals. High MPV has been associated with greater thrombotic risk in a variety of conditions 34. However, ID in humans is typically associated with low MPV 35, as opposed to our model. As iron replacement was shown to normalize platelet counts 3, it may pose a strategy for reducing thromboembolism in chronic kidney disease, inflammatory bowel disease and cancer.
In conclusion, our study demonstrates that ID induces thrombocytosis even in the absence of inflammation or chronic bleeding, and that such platelets exhibit prothrombotic properties. The observed BM changes are suggestive of increased commitment of hematopoietic progenitors to the MEG lineage, accompanied by accelerated MEG differentiation. These changes are independent of TPO and hematopoietic growth factors but rather a direct effect of ID as MEG ploidy increases in cell culture models. We speculate that ID‐induced thrombocytosis may have evolved to maintain or increase the coagulation capacity in conditions with chronic bleeding. On the other hand, it may increase thromboembolic complications in patients with ID such as in inflammatory bowel disease, chronic kidney disease, or cancer. Further studies are warranted to determine the thromboembolic risk in ID‐induced thrombocytosis.
Author Contributions
R. Evstatiev: designed and performed experiments, performed statistical analysis and wrote the manuscript. A. Bukaty: contributed to experimental design, performed animal experiments and provided a critical review of the manuscript. K. Jimenez: contributed to experimental design, performed cell culture experiments and provided a critical review of the manuscript. S. Kulnigg–Dabsch: performed cell culture experiments and provided critical review of the manuscript. L. Surman: performed animal experiments and real time PCR and provided a critical review of the manuscript. W. Schmid: performed light transmission aggregometry and provided a critical review of the manuscript. K. Lippert: performed cell culture experiments and provided critical review of the manuscript. R. Eferl: performed morphometric bone marrow analysis and provided a critical review of the manuscript. B. Scheiber–Mojdehkar: performed hepatic iron content assays and provided a critical review of the manuscript. HM. Kvasnicka: performed bone marrow staining and analysis and provided a critical review of the manuscript. V. Khare: contributed to experimental design and provided a critical review of the manuscript. C. Gasche: conception of study design, received funding, supervised experiments and edited the manuscript.
Supplementary Material
Additional Supporting Information may be found in the online version of this article.
Supplementary Information
Acknowledgments
The technical assistance of Hans Günter Simons (Institute of Pathology, University of Cologne, Germany), Kathrin Haider (Institute of Medical Chemistry, Medical University of Vienna, Austria) as well as of the personnel of the Institute of Biomedical Research, Medical University of Vienna is gratefully acknowledged.
References
- 1.Dan K. Thrombocytosis in iron deficiency anemia. Intern Med 2005;44:1025–1026 [DOI] [PubMed] [Google Scholar]
- 2.Voudoukis E, Karmiris K, Oustamanolakis P, et al. Association between thrombocytosis and iron deficiency anemia in inflammatory bowel disease. Eur J Gastroenterol Hepatol 2013;25:1212–1216 [DOI] [PubMed] [Google Scholar]
- 3.Kulnigg‐Dabsch S, Evstatiev R, Dejaco C, et al. Effect of iron therapy on platelet counts in patients with inflammatory bowel disease‐associated anemia. PloS One 2012;7:e34520 [DOI] [PMC free article] [PubMed] [Google Scholar]
- 4.Kulnigg‐Dabsch S, Schmid W, Howaldt S, et al. Iron deficiency generates secondary thrombocytosis and platelet activation in IBD: The randomized, controlled thromboVIT trial. Inflammatory Bowel Dis 2013;19:1609–1616 [DOI] [PubMed] [Google Scholar]
- 5.Choi SI, Simone JV. Platelet production in experimental iron deficiency anemia. Blood 1973;42:219–228 [PubMed] [Google Scholar]
- 6.Choi SI, Simone JV, Jackson CW. Megakaryocytopoiesis in experimental iron deficiency anemia. Blood 1974;43:111–120 [PubMed] [Google Scholar]
- 7.Keung YK, Owen J. Iron deficiency and thrombosis: Literature review. Clin Appl Thromb Hemost 2004;10:387–391 [DOI] [PubMed] [Google Scholar]
- 8.Simanek R, Vormittag R, Ay C, et al. High platelet count associated with venous thromboembolism in cancer patients: Results from the Vienna Cancer and Thrombosis Study (CATS). J Thromb Haemost 2010;8:114–120 [DOI] [PubMed] [Google Scholar]
- 9.Khorana AA, Francis CW, Culakova E, et al. Risk factors for chemotherapy‐associated venous thromboembolism in a prospective observational study. Cancer 2005;104:2822–2829 [DOI] [PubMed] [Google Scholar]
- 10.Khorana AA, Kuderer NM, Culakova E, et al. Development and validation of a predictive model for chemotherapy‐associated thrombosis. Blood 2008;111:4902–4907 [DOI] [PMC free article] [PubMed] [Google Scholar]
- 11.Geddis AE, Fox N, Tkacenko E, et al. Endomitotic megakaryocytes that form a bipolar spindle exhibit cleavage furrow ingression followed by furrow regression. Cell Cycle 2007;6:455–460 [DOI] [PubMed] [Google Scholar]
- 12.Lordier L, Jalil A, Aurade F, et al. Megakaryocyte endomitosis is a failure of late cytokinesis related to defects in the contractile ring and Rho/Rock signaling. Blood 2008;112:3164–3174 [DOI] [PubMed] [Google Scholar]
- 13.Lordier L, Pan J, Naim V, et al. Presence of a defect in karyokinesis during megakaryocyte endomitosis. Cell Cycle 2012;11:4385–4389 [DOI] [PMC free article] [PubMed] [Google Scholar]
- 14.Kaushansky K. Historical review: Megakaryopoiesis and thrombopoiesis. Blood 2008;111:981–986 [DOI] [PMC free article] [PubMed] [Google Scholar]
- 15.Levine RF, Fedorko ME. Isolation of intact megakaryocytes from guinea pig femoral marrow. Successful harvest made possible with inhibitions of platelet aggregation; enrichment achieved with a two‐step separation technique. J Cell Biol 1976;69:159–172 [DOI] [PMC free article] [PubMed] [Google Scholar]
- 16.Jackson CW. Cholinesterase as a possible marker for early cells of the megakaryocytic series. Blood 1973;42:413–421 [PubMed] [Google Scholar]
- 17.Cook CI, Yu BP. Iron accumulation in aging: Modulation by dietary restriction. Mech Ageing Dev 1998;102:1–13 [DOI] [PubMed] [Google Scholar]
- 18.Wolford ST, Schroer RA, Gallo PP, et al. Age‐related changes in serum chemistry and hematology values in normal Sprague‐Dawley rats. Fundam Appl Toxicol 1987;8:80–88 [DOI] [PubMed] [Google Scholar]
- 19.Schwertz H, Koster S, Kahr WH, et al. Anucleate platelets generate progeny. Blood 2010;115:3801–3809 [DOI] [PMC free article] [PubMed] [Google Scholar]
- 20.Evstatiev R, Gasche C. Iron sensing and signalling. Gut 2012;61:933–952 [DOI] [PubMed] [Google Scholar]
- 21.Ravid K, Lu J, Zimmet JM, et al. Roads to polyploidy: The megakaryocyte example. J Cell Physiol 2002;190:7–20 [DOI] [PubMed] [Google Scholar]
- 22.Raslova H, Kauffmann A, Sekkai D, et al. Interrelation between polyploidization and megakaryocyte differentiation: A gene profiling approach. Blood 2007;109:3225–3234 [DOI] [PubMed] [Google Scholar]
- 23.Mattia G, Vulcano F, Milazzo L, et al. Different ploidy levels of megakaryocytes generated from peripheral or cord blood CD34+ cells are correlated with different levels of platelet release. Blood 2002;99:888–897 [DOI] [PubMed] [Google Scholar]
- 24.Akan H, Guven N, Aydogdu I, et al. Thrombopoietic cytokines in patients with iron deficiency anemia with or without thrombocytosis. Acta Haematol 2000;103:152–156 [DOI] [PubMed] [Google Scholar]
- 25.Beguin Y, Loo M, R'Zik S, et al. Effect of recombinant human erythropoietin on platelets in patients with anemia of renal failure: Correlation of platelet count with erythropoietic activity and iron parameters. Eur J Haematol 1994;53:265–270 [DOI] [PubMed] [Google Scholar]
- 26.Broudy VC, Lin NL, Kaushansky K. Thrombopoietin (c‐mpl ligand) acts synergistically with erythropoietin, stem cell factor, and interleukin‐11 to enhance murine megakaryocyte colony growth and increases megakaryocyte ploidy in vitro. Blood 1995;85:1719–1726 [PubMed] [Google Scholar]
- 27.Racke FK. EPO and TPO sequences do not explain thrombocytosis in iron deficiency anemia. J Pediatr Hematol Oncol 2003;25:919 [DOI] [PubMed] [Google Scholar]
- 28.Klimchenko O, Mori M, Distefano A, et al. A common bipotent progenitor generates the erythroid and megakaryocyte lineages in embryonic stem cell‐derived primitive hematopoiesis. Blood 2009;114:1506–1517 [DOI] [PubMed] [Google Scholar]
- 29.Geddis AE, Kaushansky K. Cross‐reactivity between erythropoietin and thrombopoietin at the level of Mpl does not account for the thrombocytosis seen in iron deficiency. J Pediatr Hematol Oncol 2003;25:919–920 [DOI] [PubMed] [Google Scholar]
- 30.Dahl NV, Henry DH, Coyne DW. Thrombosis with erythropoietic stimulating agents‐does iron‐deficient erythropoiesis play a role? Semin Dial 2008;21:210–211 [DOI] [PubMed] [Google Scholar]
- 31.Streja E, Kovesdy CP, Greenland S, et al. Erythropoietin, iron depletion, and relative thrombocytosis: A possible explanation for hemoglobin‐survival paradox in hemodialysis. Am J Kidney Dis 2008;52:727–736 [DOI] [PMC free article] [PubMed] [Google Scholar]
- 32.Loo M, Beguin Y. The effect of recombinant human erythropoietin on platelet counts is strongly modulated by the adequacy of iron supply. Blood 1999;93:3286–3293 [PubMed] [Google Scholar]
- 33.Danese S, Papa A, Saibeni S, et al. Inflammation and coagulation in inflammatory bowel disease: The clot thickens. Am J Gastroenterol 2007;102:174–186 [DOI] [PubMed] [Google Scholar]
- 34.Gasparyan AY, Ayvazyan L, Mikhailidis DP, et al. Mean platelet volume: A link between thrombosis and inflammation? Curr Pharm Des 2011;17:47–58 [DOI] [PubMed] [Google Scholar]
- 35.Cho SY, Yang JJ, Suh JT, et al. Mean platelet volume/platelet count ratio in anemia. Platelets 2013;24:244–245 [DOI] [PubMed] [Google Scholar]
- 36.Toprak SK, Erismis B, Karakus S, et al. Does thrombocyte size give us an idea about thrombocytosis etiology? Scientific World J 2012;2012:598653 [DOI] [PMC free article] [PubMed] [Google Scholar]
Associated Data
This section collects any data citations, data availability statements, or supplementary materials included in this article.
Supplementary Materials
Additional Supporting Information may be found in the online version of this article.
Supplementary Information