

The RNA-binding protein with a multiple splicing (RBPMS) family of proteins has been implicated in oocyte, retinal ganglion cell, heart, and gastrointestinal smooth muscle development. This study defines the transcriptome-wide RNA targets of RBPMS using photoactivatable-ribonucleoside-enhanced crosslinking and immunoprecipitation (PAR-CLIP) in HEK293 cells, revealing binding sites in exonic mRNA, intronic pre-mRNA, and repeat-annotated sequences. The RBPMS family of proteins binds a tandem CAC trinucleotide motif separated by a variable spacer region. Similar to some other mRNA-binding proteins, RBPMS proteins relocalize to cytoplasmic stress granules under oxidative stress, suggestive of a support function for mRNA localization in large and/or multinucleate cells, where it is preferentially expressed.
Keywords: RNA-binding protein, PAR-CLIP, RNA recognition element, RBPMS
Abstract
Recent studies implicated the RNA-binding protein with multiple splicing (RBPMS) family of proteins in oocyte, retinal ganglion cell, heart, and gastrointestinal smooth muscle development. These RNA-binding proteins contain a single RNA recognition motif (RRM), and their targets and molecular function have not yet been identified. We defined transcriptome-wide RNA targets using photoactivatable-ribonucleoside-enhanced crosslinking and immunoprecipitation (PAR-CLIP) in HEK293 cells, revealing exonic mature and intronic pre-mRNA binding sites, in agreement with the nuclear and cytoplasmic localization of the proteins. Computational and biochemical approaches defined the RNA recognition element (RRE) as a tandem CAC trinucleotide motif separated by a variable spacer region. Similar to other mRNA-binding proteins, RBPMS family of proteins relocalized to cytoplasmic stress granules under oxidative stress conditions suggestive of a support function for mRNA localization in large and/or multinucleated cells where it is preferentially expressed.
INTRODUCTION
RNA-binding protein with multiple splicing (RBPMS) belongs to a family of RNA-binding proteins (RBPs) containing a single RNA recognition motif (RRM), corresponding to a protein domain of ∼80 amino acids (aa). In RBPMS this domain is flanked by 23 aa N-terminal and 95 aa C-terminal regions. The RBPMS gene spans over 230 kb in the human genome and is expressed as multiple mRNA isoforms (four RefSeq and at least 19 transcript variants according to AceView) resulting in multiple protein isoforms (Shimamoto et al. 1996). All Refseq protein isoforms are identical in the majority of their coding sequence (1–170 aa). RBPMS2 is predominantly expressed as a single isoform (one Refseq transcript and at least seven spliced variants according to AceView). RBPMS paralogs share 67% amino acid identity (RBPMS2 vs. RBPMS isoform A), varying mostly in their N- and C-termini. The C terminus of RBPMS is unstructured, characterized by a high density of prolines, without homology to other proteins. The RBPMS RRM domain is most similar to those of ELAVL/Hu proteins involved in mRNA stability and splicing (Lebedeva et al. 2011; Mukherjee et al. 2011), and the snRNA-binding proteins SNRPB2/U2B″ and SNRPA/U1A (Oubridge et al. 1994).
The RRM domain is the most common RNA-binding domain, present in at least 224 RBPs (Ascano et al. 2012a). RRM domains are structurally diverse and bind to a multitude of sequence and structural motifs, such as the base and loop residues in stem–loop structures (Maris et al. 2005). RRMs are present in proteins that regulate a variety of RNA processes, including pre-mRNA splicing, RNA transport, localization, translation, and stability. The RBPMS family is conserved in vertebrates (e.g., 72% identity of H. sapiens RBPMS isoform A vs. D. rerio RBPMS2) (Fig. 1A), and other vertebrates also contain at least two RBPMS family members.
FIGURE 1.

RBPMS overview. (A) RBPMS is conserved in vertebrates. Alignments were generated using ClustalW (NP_956553.1, NP_001002409.1, NP_082306.2, NP_919248.1, NP_001008710.1, NP_001036139, XP_003199078.1). (B) RBPMS and RBPMS2 localize to the nucleus and cytoplasm. Western Blotting analysis of nucleo-cytoplasmic fractions prepared from FLAG-HA RBPMS and RBPMS2 cell lines, as indicated. Nuclear (Nuc), cytoplasmic (Cyt), and total cell lysate (Tot) fractions were resolved on a 4%–12% SDS–polyacrylamide gel and then probed using an anti-HA antibody targeting FLAG-HA RBPMS and RBPMS2, and antibodies targeting ELAVL1 (HuR), TUBB (β-tubulin), and LMNB1 (lamin B) as controls for the purity of the cytoplasmic and nuclear fractions. (Right) Immunofluorescence staining of HA epitope in HEK293 cells stably expressing FLAG-HA RBPMS and FLAG-HA RBPMS2, using Hoechst and Phalloidin 546 as controls. (C) Phosphorimages of SDS-PAGE fractionating PAR-CLIP immunoprecipitate from constitutive and inducible overexpressing FLAG-HA-tagged RBPMS HEK293 cells. The cross-linked RNA–RBPMS complexes are indicated for two biological replicate experiments. Anti-HA Western-blotting control for expression and loading is shown at the bottom. Two protein bands were recognized by anti-HA antibody, one at the expected size based on recombinant full-length RBPMS and the other shorter, suggesting proteolytic cleavage (bands confirmed as RBPMS by mass spectrometry). (D) Overlap of PAR-CLIP clusters with ≥0.5 T-to-C conversion specificity between libraries A and B defines 6207 RBPMS-binding sites. (E) Genomic distribution of RBPMS-binding sites.
Dysregulation of RBPMS family proteins has been reported in cancer (Skawran et al. 2008; Miller and Stamatoyannopoulos 2010; Drozdov et al. 2012; Hapkova et al. 2013; http://www.cbioportal.org/public-portal/) and chronic intestinal pseudo-obstruction (Notarnicola et al. 2012). Manipulation of RBPMS levels during embryogenesis suggested functions in X. laevis oocyte maturation (Zearfoss et al. 2003), heart and kidney development (Gerber et al. 2002), and retinal ganglion cell development (Hornberg et al. 2013). In X. laevis RBPMS regulated cleavage of vegetal blastomeres in early embryogenesis (Zearfoss et al. 2004) and was suggested to control mRNA processing (Gerber et al. 2002; Song et al. 2007) and transport of mRNAs along the axon to the axon terminal of retinal ganglion cells (Hornberg et al. 2013).
Despite the growing interest in RBPMS proteins, their RNA recognition element (RRE) and RNA target sites remain undefined. We determined RBPMS transcriptome-wide RNA-binding sites using PAR-CLIP in human embryonic kidney HEK293 cells and subsequently elucidated its RRE, which we further validated by biophysical assays. Manipulation of RBPMS levels in HEK293 cells followed by transcriptional profiling using arrays and RNAseq revealed no major role for RBPMS in mRNA stability and splicing in this cell culture system. We observed RBPMS family relocalization to cytoplasmic stress granules, a feature shared with many cytoplasmic and nucleocytoplasmic shuttling mRNA-binding proteins.
RESULTS
RBPMS family member expression patterns
RBPMS expression in embryos and adult tissues has been studied by various methodologies in several vertebrate species supporting expression in heart and retinal ganglion cells (Shimamoto et al. 1996; Gerber et al. 2002; Su et al. 2004; Wang et al. 2008; Kwong et al. 2010; Derrien et al. 2012). A survey of a limited set of adult human tissues by poly(A) RNAseq indicated that RBPMS was the most highly expressed in the prostate, followed by colon, adipose tissue, and heart, with RBPMS being higher expressed than RBPMS2 in most tissues (Derrien et al. 2012; Supplemental Fig. 1A). A survey of seven human cell lines from the ENCODE repository showed highest RBPMS expression in human embryonic stem cells (hESC) compared with more differentiated cells, consistent with participation of RBPMS family proteins in the ESC interactome (The ENCODE Project Consortium 2011; Kwon et al. 2013; Supplemental Fig. 1B). High expression of RBPMS was noted in D. rerio early cardiac and retinal ganglion cell development, with decreased expression in the adult tissues (Gerber et al. 1999; http://zinf.org/).
To obtain RBPMS family expression information in mammalian species throughout embryogenesis and adult tissues, we generated an atlas of RBPMS family expression using microarray data from 156 mouse samples from six reports submitted to the Gene Expression Omnibus (GEO). During early mouse development RBPMS and RBPMS2 were highly expressed in preimplantation embryo (Fig. 2A). RBPMS and RBPMS2 expression declined after the blastocyst stage, similarly to the pluripotency-related transcription factor NANOG (Mitsui et al. 2003), whereas LIN28A levels, another well-studied developmentally regulated RBP, only declined after E10.5 (Yang and Moss 2003). RBPMS levels showed a transient increase during E8.5 through E10.5, coinciding with early heart development as observed with the induction of MYL7 expression, an early cardiomyocyte differentiation marker (Kubalak et al. 1994). Moreover, high levels of RBPMS and RBPMS2 were observed during mouse female and male germ cell early development, where genome-wide DNA demethylation takes place (Fig. 2B). RBPMS family expression was lower in an in vitro functional germline stem cell culture model (Fig. 2B), in which de novo DNA methylation is already established. In mouse adult tissues, RBPMS was highly expressed in adipose tissue, similarly to human, as well as ovary and lung. RBPMS2 was expressed higher in additional tissues in the mouse compared with human, including kidney and liver (Fig. 2C).
FIGURE 2.

RBPMS and RBPMS2 expression during (A) mouse embryogenesis, (B) germ cell development, and (C) adult tissues. The mean affymetrix microarray expression data are depicted in log2 scale with bars showing SEM. The number of the biological replicates used in these analyses is shown in Supplemental Table 8. Expression of other genes with specific expression patterns during distinct developmental stages is also included. See Materials and Methods for description. (GV) germinal vesicles (immature oocytes); (MII) oocytes at metaphase II stage (mature oocytes); (Blast) blastocyst; (E) embryonic day; (ESC) embryonic stem cells; (M) male; (F) female; (GSC) germline stem cells (in vitro cultured postnatal testicular germline stem cells). Expression of all genes depicted on same plot for ease of representation.
RBPMS PAR-CLIP-identified transcriptome-wide RNA-binding sites
We generated HEK293 cell lines with either constitutive or inducible expression of N-terminally FLAG-HA-tagged human RBPMS (isoform A, ENSP00000318102) and RBPMS2. We selected RBPMS isoform A to conduct PAR-CLIP, since it is expressed in many tissues, and it most resembled RBPMS2 at the protein sequence level. Moreover, many RBPMS isoforms only differ in their C terminus and 3′ untranslated region (UTR), only influencing protein-level expression but not amino acid sequence. Nucleo-cytoplasmic fractionation using Western Blotting detecting the HA-tagged proteins, and immunofluorescence experiments using anti-HA antibodies followed by fluorescently labeled secondary antibody revealed that RBPMS and RBPMS2 both localized to the cytoplasm and nucleus (Fig. 1B).
For PAR-CLIP experiments both the constitutively and inducibly expressing FLAG-HA-tagged RBPMS HEK293 cell lines were grown for 12–16 h in 4-thiouridine- (4SU-) supplemented medium to allow for its incorporation into nascent RNA transcripts and irradiated at 365-nm wavelength prior to lysis (Hafner et al. 2010). Cross-linked RNAs were recovered from SDS-PAGE-purified anti-FLAG-RBPMS immunoprecipitates (Fig. 1C), converted into cDNA libraries, and Illumina-sequenced. Two main protein bands were recognized by the anti-HA antibody, one at the expected size based on recombinant full-length RBPMS and a shorter proteolytic product confirmed by mass spectrometry. Three minor cross-linked products migrated at about 40, 120, and 150 kDa, which were not pursued further, likely represented other abundant RBPs binding near or competing with repetitive RBPMS-binding sites, or represented multimers of RBPMS proteins cross-linked to single RNA fragments (Hafner et al. 2010).
The resulting sequence reads from replicate PAR-CLIP experiments were analyzed as described previously (Corcoran et al. 2011; Supplemental Table 1). Briefly, sequence reads were filtered to exclude those with ambiguous nucleotides and of lengths shorter than 20 nt, subsequently mapped to the genome, and annotated (1.4 and 4.5 Mio uniquely aligned reads for library A and library B, respectively). PARalyzer was utilized to convert processed reads to high-resolution clusters. A total of 16,197 clusters in library A and 12,571 in library B displayed a T-to-C conversion specificity of ≥0.5, above the background average conversion specificity of −0.19 and −0.25 determined from reads mapped to rRNA for libraries A and B, respectively (Supplemental Tables 1,2); 13,017 and 10,281 from these library A and B clusters, respectively, mapped to one of our pipeline annotation databases (Supplemental Fig. 2). Spearman correlation coefficient of the number of reads from all clusters per gene between the two libraries was 0.64, with clusters identified in both libraries displaying a higher T-to-C conversion specificity and read count (Supplemental Fig. 3).
For subsequent analysis, we defined RBPMS-binding sites as clusters identified in both libraries: 6207 clusters with ≥0.5 conversion specificity identified as clusters in library A having a reciprocal overlap of at least 80% with a cluster in library B (Fig. 1D). RBPMS primarily bound 3′ UTR, intronic, and coding sequences (CDS) (Fig. 1E; Supplemental Tables 1,2).
Finally, to identify potential pathways regulated by RBPMS we conducted Gene Ontology (GO) analysis of the RBPMS-binding sites. This analysis revealed enrichment in RBP-related terms such as “nucleobase, nucleoside, nucleotide, and nucleic acid metabolic process” (P-value 2.1 × 10⁻⁸), “nucleic acid binding” (P-value 6.41 × 10⁻⁸), and “transcription factor” (P-value 2.41 × 10⁻⁴) (Supplemental Table 3).
Computational derivation of the RBPMS RNA recognition element (RRE)
We used the evidence ranked motif identification tool (cERMIT) to identify RREs enriched in RBPMS mRNA clusters, ranking clusters by T-to-C conversion specificity (Fig. 3A; Georgiev et al. 2010). Clustering of highly enriched cERMIT motifs using a modified version of STAMP, a tool for exploring DNA-binding motif similarities (Mahony and Benos 2007), revealed a CAC trinucleotide with a small preference for an adjacent U in both libraries while evaluating 9-mer motifs. A total of 74% and 56% of the clusters from libraries A and B, respectively, contained two or more CAC nucleotide triplet motifs within their identified RRE. Given our observation that clusters on average included two CAC motifs, we used the regulatory sequence analysis tools (RSAT) to detect over-represented space pairs (dyads) of nucleotide triplets (Fig. 3B; Defrance et al. 2008). Almost all of the highest scoring dyads were CAC dyads with variable spacing, with the highest Z-scores corresponding to dyads spaced 4, 6, and 8 nt apart. The tandem CAC RRE motif was also confirmed using the HeliCis paired motif discovery tool (Larsson et al. 2007; data not shown).
FIGURE 3.
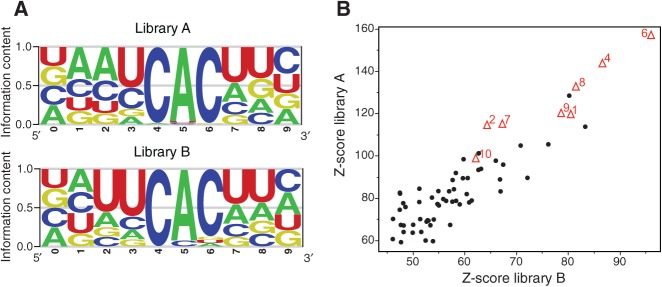
RBPMS binds tandem CAC motifs separated by variable spacer length. (A) RBPMS RRE as identified by cERMIT analysis for library A and library B. (B) RSAT analysis defines CAC as a dyad motif with variable spacing. The Z-score of all trinucleotide dyads from each library is plotted; red triangles represent CAC dyads and adjacent number represents spacer oligonucleotide length; black dots represent all other trinucleotide dyads.
We noted that RBPMS also bound repeat-annotated sequences, many containing CA dinucleotide repeats (Fig. 1E). Moreover, we noted that there was preference for RBPMS-binding sites to be located closer to one another than expected in the 3′ UTR and intron, suggesting cooperative binding (Supplemental Fig. 4).
In vitro binding of the RBPMS RRE and its derivatives
To validate the RRE identified by our bioinformatics analysis using an independent method, we performed EMSAs using recombinant full-length RBPMS and RBPMS2 proteins expressed in bacteria and synthetic single-stranded RNAs representing a panel of 18-nt di- and trinucleotide repeats. Both proteins bound an (AC)9 dinucleotide repeat and a (CAC)6 trinucleotide repeat RNA, but did not bind (CAU)6 or (CU)9 (Fig. 4A,B). Systematic deletion of AC from (AC)9 revealed that RBPMS required a minimum of seven AC-repeats for binding (Fig. 4C).
FIGURE 4.

RBPMS and RBPMS2 proteins bind (AC)9 and (CAC)6 repeats in electrophoretic mobility shift assays (EMSA). (A) Synthetic RNAs representing 18-nt di- or trinucleotide repeats were radiolabeled (10 nM), incubated with 0–10 μM RBPMS recombinant protein (FLAG-HA-His6), and separated on 1% agarose gel. Binding conditions specified in Materials and Methods. The electrophoretic mobility shift observed for the (AAU)6 oligoribonucleotide (*) may not be due to RBPMS binding (see Results). We did not observe binding for (AG)9, (GGC)6, (GCC)6, A3G15, A18, C18, U18 with the same conditions (data not shown). (B) Binding specificity for recombinant RBPMS2 protein. Conditions same as in A. (C) Definition of minimal number of (AC)n repeats required for RBPMS binding. Conditions same as in A. (D) Coomassie-stained 15% SDS-PAGE indicates purity of recombinant RBPMS and RBPMS2 proteins.
Both RBPMS and RBPMS2 showed distinct electrophoretic mobility upon addition of (AAU)6 compared with addition of the (AC)9 RNA (Fig. 4A,B); however, further experiments suggested that this shift was due to a copurifying bacterial RBP. While supershift analysis, adding anti-HA and anti-FLAG antibodies, confirmed that the shift of the RNA migration was indeed due to binding of the FLAG-HA-tagged proteins to the (AC)9 RNA, addition of anti-HA and anti-FLAG antibodies did not alter the migration for the (AAU)6 RNP complex (Supplemental Fig. 5). Anti-lamin or anti-tubulin antibodies were used as unrelated controls and showed no supershift. Furthermore, increasing concentrations of nonradioactive RNA of the same sequence composition decreased binding of radioactive (AAU)6 RNA to a greater extent than (AC)9 RNA (data not shown). Given that both proteins bound RNA with similar affinity and specificity, we performed the majority of EMSAs using recombinant RBPMS.
To further explore the RBPMS RRE, we conducted EMSAs using 21-nt synthetic RNAs corresponding to clusters identified by PAR-CLIP. We chose four binding sites identified within the 3′ UTR of NDUFA6, ETF1, SRM, and UBE2V1 (Supplemental Fig. 6). The RNAs corresponding to UBE2V1 and SRM contained three CAC motifs: Motifs 1 and 2 were spaced 1 nt apart, motifs 2 and 3 were spaced 4 nt apart, while motifs 1 and 3 were spaced 8 nt apart; substitution of a single residue within two of the three CAC motifs (center A with C) greatly decreased binding affinity (Fig. 5A). The RNAs corresponding to ETF1 and NDUFA6 contained two CAC motifs spaced 9 nt apart; similar substitution of a single residue within both CAC motifs nearly abolished binding. RBPMS2 showed similar affinity and specificity for the ETF1 and SRM RNAs (data not shown).
FIGURE 5.
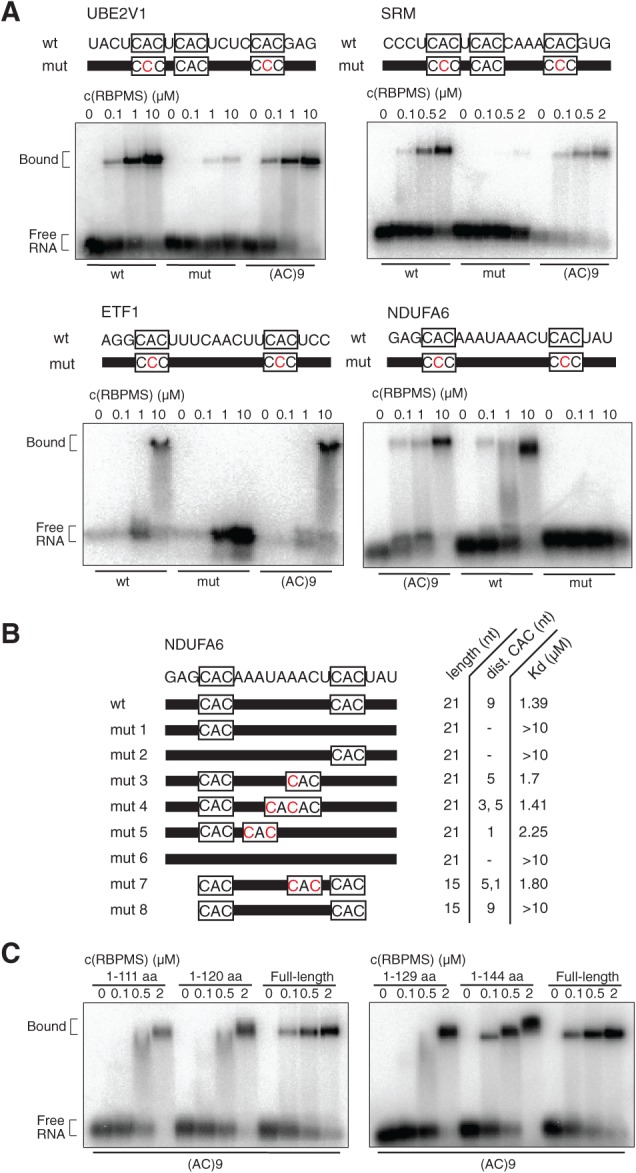
RBPMS binds PAR-CLIP targets in EMSAs. (A) 21-nt synthetic RNAs representing clusters from mRNA targets identified by PAR-CLIP (NDUFA6, UBE2V1, SRM, and ETF1) were radiolabeled (10 nM), incubated with 0–10 μM recombinant RBPMS or RBPMS2 (FLAG-HA-His6), and separated on 1% agarose gel. The RNA sequences are shown on top, with nucleotides representing the RRE boxed. Residues in red illustrate point mutations of the synthetic RNAs. (B) Dissociation constant (Kd) determination for 21- and 15-nt synthetic RNAs representing the wild-type and mutant NDUFA6 cluster. (C) Binding study of RBPMS deletion proteins (His6) to synthetic (AC)9 RNA defines additional regions contributing to RNA binding. C-terminal deletion proteins are specified; N-terminal deletion protein (amino acids 21–196) required different binding conditions and could not be directly compared (data not shown).
Finally, to study the spacing between the CAC motifs, we conducted EMSAs on NDUFA6 RNA and its derivatives. Substitution of the center A by C within only one of the CAC motifs of the NDUFA6 cluster greatly reduced binding (>10 μM). The spacing of the two CAC motifs within the 21-nt RNAs 5–9 nt apart did not significantly influence binding affinity (1.4–1.7 μM); however, we did note a decrease in affinity with spacing of 1 nt (2.4 μM) (Fig. 5B). Shortening the RNA to a 15-mer greatly reduced binding (>10 μM), despite the presence of two CAC motifs spaced 9 nt apart. Introducing a third CAC motif within the short 15-nt RNA restored binding to levels similar to some of the studied 21-nt RNAs (1.8 μM). In conclusion, the minimal length of RNA required for RBPMS binding tandem CAC motifs within a PAR-CLIP cluster is 15 nt, with spacing ranging from 1 to 9 nt, consistent with the findings from the bioinformatics analysis described above.
Deletion analysis of RBPMS protein and its effects on RNA binding
To define RBPMS regions contributing to (AC)9 binding outside its RRM domain, we deleted N-terminal (residues 20–196) and C-terminal (1–100, 1–111, 1–120, 1–129, 1–144) regions. The predicted RRM domain of RBPMS is located between aa 24 and 101. Deletions of or into the central RRM domain were avoided. The C-terminal 1–144 truncated protein demonstrated comparable binding to full-length RBPMS (Fig. 5C), while the C-terminal 1–100 truncated protein did not demonstrate any binding (data not shown). The C-terminal 1–111, 1–120, and 1–129 truncated proteins demonstrated binding, but with decreased affinity compared with the full-length protein, defining the proximal C-terminal region contributing to RNA binding (Fig. 5C). The N-terminal 20–196 truncated protein, due to its higher pI, required binding conditions at pH 9.5 to enter the gel and thus could not be directly compared (data not shown).
To investigate the oligomeric state of RBPMS we performed gel filtration. Full-length and truncated RBPMS had a higher apparent molecular mass than expected from a monomer in the absence of RNA. The elution volume of the full-length FLAG-HA-tagged protein exceeded the resolution limit of the gel-filtration column, thus not allowing determination of its oligomeric state. However, the elution volume of truncated His6-tagged proteins (N-terminal [20–196], C-terminal [1–100, 1–111, 1–144], N- and C-terminal [20–100]) corresponded to a tetramer (Supplemental Table 4).
To define the number of RBPMS molecules crosslinking to a 21-nt synthetic radiolabeled RNA, we conducted in vitro crosslinking with recombinant RBPMS and synthetic RNAs containing two 4SU residues flanking the tandem CAC motif spaced by 6 nt based on a binding site identified within the CDS of BCLAF1. SDS-PAGE separation of the cross-linked full-length ∼23-kDa RBPMS protein, without nuclease digestion, revealed a major and minor band at ∼30 and ∼55 kDa, but only one band at ∼15 and ∼12 kDa for C-terminal truncated 17 kDa (1–144) and 14 kDa (1–111) RBPMS proteins (Supplemental Fig. 7); in vitro crosslinking with recombinant 21 kDa N-terminal truncated RBPMS revealed a major and minor band at ∼20 and ∼40 kDa. These findings suggest that the BCLAF1 RNA was occupied by two molecules of full-length and N-terminal truncated RBPMS proteins but only one molecule of C-terminal truncated proteins at a comparable protein concentration of 1–2 μM and 10 nM RNA.
Examination of RBPMS molecular function in HEK293 cells
To investigate a role for RBPMS in regulating mRNA stability and splicing we silenced and overexpressed RBPMS in HEK293 cells and determined mRNA expression levels by Illumina microarrays and poly(A) RNAseq (only for RBPMS overexpression). In HEK293 cells RBPMS was expressed at 8.2 RPKM, compared with 7.7 for RBPMS2, and 28.2 for the relatively abundant RBP ELAVL1/HuR. First, we performed silencing experiments using two different siRNAs targeting the RBPMS ORF using the parental Flp-In T-REx HEK293 cells. siRNA knockdown efficiency was confirmed in the constitutively overexpressing FLAG-HA-tagged RBPMS cell line by Western Blotting using anti-HA antibodies (Supplemental Fig. 8). Second, we overexpressed RBPMS by addition of 0.01 μg/mL of doxycycline to inducible RBPMS HEK293 cells and increasing RBPMS expression by two- to threefold to 28.2 RPKM compared with mock-treated cells.
We did not observe significant differences in mRNA stability after manipulation of RBPMS levels, after correction for siRNA off-target and transcript length effects (described in Materials and Methods; Supplemental Table 5; Supplemental Fig. 8). The Wilcoxon rank-sum test assessing the difference between the distribution of the log2 fold change in transcript abundance between knockdown and mock-treated cells for transcripts containing a variable number of RBPMS-binding sites was not significant (P-value >0.05) (Supplemental Fig. 8). Analysis of RBPMS overexpression, both by microarray and poly(A) RNAseq, revealed small significant changes in the cumulative distribution of the log2 fold change in transcript abundance (P-value <0.05 for poly(A) RNAseq), but without a consistent relationship between increased binding and mRNA abundance changes (Supplemental Fig. 8).
To evaluate for changes in splicing patterns, we analyzed the poly(A) RNAseq data after RBPMS overexpression, but did not observe global changes in splicing patterns. Only seven genes containing RBPMS-binding sites within 100 nt of the splice site included differentially used exons (FDR ≤0.1) (Supplemental Table 6). After manual inspection of read alignments, these differentially used exons represented minor isoforms, not supported by Refseq annotation.
Finally, we probed RBPMS and RBPMS2 subcellular localization in HEK293 cells. RBPMS and RBPMS2 colocalized with poly(A) RNA in cytoplasmic granules after oxidative stress treatment using 400 μM arsenite, similarly to the known predominantly cytoplasmic localized stress granule marker and mRNA-binding protein G3BP1 (Fig. 6; Supplemental Fig. 9). The localization of a fraction of RBPMS and RBPMS2 to stress granules is a behavior shared with many mRNA transport proteins (Buchan and Parker 2009).
FIGURE 6.

RBPMS (A–D, I–L), G3BP1 (E–H, M–P), and poly(A) RNA localize to cytoplasmic granules after 400 μM arsenite administration. For assay conditions and description see Materials and Methods. RBPMS2 also localizes to cytoplasmic granules after arsenite administration (data not shown).
DISCUSSION
RBPMS RNA recognition
RRM domains minimally recognize dinucleotides of variable sequence and are able to accommodate 2–4 nt within the binding surface formed by the RNP1 and RNP2 motifs; recognition can be extended up to 6 nt by including surrounding N- and C-terminal sequences. Hetero- or homo-oligomerization produces larger binding interfaces that could accommodate longer or repetitive nucleotide sequences, and adopting various secondary structures (for review, see Clery et al. 2008). Examples include the following tandem RRM containing RBPs bound to RNA: SXL/Sex-lethal (Handa et al. 1999), ELVAL4/HuD (Wang and Tanaka Hall 2001), and USP6/Hrp1 (Perez-Canadillas 2006).
The RRE of RBPMS and RBPMS2 is composed of CAC, similarly to the SNRPA/U1A protein, which binds the U1 RNA hairpin containing a CAC (Oubridge et al. 1994) and the HNRNPL protein, which binds CA-repeats (Hui et al. 2003). Modeling of the RBPMS RRM structure using the structure of SNRPA protein and the bound U1 RNA hairpin as a template (PDB 1URN) (Oubridge et al. 1994) revealed conserved interactions between RBPMS side chains and the CAC RNA. The pyrimidine ring of C1 of the CAC motif, corresponding to C10 in 1URN stacked on SNRPA Tyr13, which in turn corresponded to Phe27 in RBPMS RNP2; the A2 and C3 bases, corresponding to A11 and C12 in 1URN, were stacked between the SNRPA Phe56 and the carboxyl group of Asp92, which in turn corresponded to RBPMS Phe65 in RNP1 and Lys104 (likely interacting with a backbone phosphate), respectively.
RBPMS binds two tandem CAC motifs with varying spacer length (1–9 nt), as suggested by computational and biochemical approaches. Based on the modeled RBPMS-binding site, RBPMS likely binds the tandem CAC motif at a minimum as a dimer, as observed by crosslinking of two RBPMS molecules to a 21-nt RNA containing two CACs. Suggestive of higher RBPMS oligomerization, RBPMS clusters were located closer to each other than expected in intronic and 3′ UTR regions. Furthermore, gel-filtration experiments in the absence of RNA showed RBPMS oligomerization, pointing to potential tetramer assembly.
A recent larger-scale study determined RREs for 205 distinct RBPs selected from 24 diverse eukaryotes (Ray et al. 2013). They identified the SNRPA and HNRNPL human protein families binding to CAC sequences comprised within their reported 7-mer RREs but did not study RBPMS or RBPMS2. The same study did observe a CAC-containing RRE for D. melanogaster Cpo and C. elegans MEC-8, which contain RRM domains of 72% and 67% amino acid identity within the RRM domain to human RBPMS isoform A.
RBPMS function
RBPMS overexpressed in HEK293 localized both to the nucleus and cytoplasm, consistent with its identified intronic, 3′ UTR, and CDS RNA-binding sites by PAR-CLIP, suggesting cytoplasmic, nuclear, and RNA transport functions. Roles in mRNA stability and splicing for RBPMS were not pronounced in HEK293 cells, similar to earlier studies of the shuttling mRNA-binding protein FMRP with a critical role in germline and neuronal cell function (Ascano et al. 2012b) (we do not address such a role for RBPMS2 in this report). However, association with other potential protein partners expressed with similar specificity to RBPMS could influence the outcome of target RNA binding in a cell-type-dependent manner and future analyses in other cell lines or tissues are needed.
We showed that RBPMS and RBPMS2 localized to cytoplasmic stress granules, similarly to reference mRNA transport proteins, such as G3BP1 (Buchan and Parker 2009). This is suggestive of an mRNA transport function for RBPMS, which could be important for mRNA transport to cytoplasmic granules in the oocyte during early development. Clusters of CACs in 3′ UTRs were previously documented as conserved localization signals for directing mRNAs to the vegetal pole of X. laevis oocytes (Zearfoss et al. 2003; Betley et al. 2004).
Finally, we observed RBPMS binding to repeat elements including LINE L2a, L2c, and L2, as well as CA-containing low-complexity repeats. Given the high expression of RBPMS in mouse preimplantation embryos as well as fetal germ cells, RBPMS may play a role in maintaining genome integrity by contributing to regulation of repeat elements. Interestingly, in mouse RBPMS expression is correlated with changes in DNA methylation: (1) RBPMS is highly expressed at the 8-cell through blastocyst stage, when global DNA demethylation takes place, and drops in expression at the initiation of de novo DNA methylation, and (2) RBPMS is also highly expressed in male and female developing germ cells during DNA demethylation, with lower expression in germline stem cells where DNA methylation has already been established. To conclude, RBPMS family protein high-expression levels during early development and its ability to bind to CA-containing repeat elements points toward a possible new function in controlling repeat-element RNA localization and genomic integrity.
Conclusion
Our study established RRM recognition by multimeric RBPMS of tandem-arranged CAC RREs and molecular analysis supports a molecular function of RBPMS in mRNA transport and localization with little effect on mRNA stability and splicing in HEK293 cells.
MATERIALS AND METHODS
Stable cell lines and their culture
Stable cell lines inducibly and constitutively expressing FLAG-HA-tagged RBPMS and RBPMS2 were generated using the Gateway Recombination Cloning Technology and Flp-In T-REx HEK293 cell lines (Invitrogen) as previously described (for detailed protocol see Spitzer et al. 2013). Plasmids for generation of these cell lines are available from Addgene. Cells constitutively expressing RBPMS were grown in DMEM high glucose (1x) supplemented with 10% fetal bovine serum, 2 mM glutamine, 100 U/mL penicillin, 100 μg/mL streptomycin (Gibco), and 100 μg/mL hygromycin (Invivogen); cells inducibly expressing RBPMS additionally contained 15 μg/mL blasticidin (Invivogen). For induction of RBPMS expression cells were treated with 0.01–1 μg/mL doxycycline, added to the growth medium 15–20 h before crosslinking. The stable cell line inducibly expressing FLAG-HA-tagged G3BP1 was generated by Cindy Meyer (unpubl.).
Antibodies
Monoclonal anti-HA.11 (clone 16B12, Covance), anti-β-tubulin (Sigma, SAB3500350, T0198), anti-lamin B1 (Abcam Ab16048), anti-HuR (Santa Cruz [19F12] sc-56709), anti-Penta-His (Qiagen 34660) were used as primary antibodies at 1:1000 dilution. HRP-conjugated anti-rabbit Ig and anti-mouse Ig (both from DAKO) were used as secondary antibodies at 1:4000 dilution for Western Blotting analysis. Anti-Flag M2 (Sigma, F3165) was used for PAR-CLIP. We evaluated the following commercial anti-RBPMS antibodies, Santa Cruz S-25, Santa Cruz E13, Abnova 8390, Sigma AV40269, using recombinant protein and overexpressing HEK293 cell lysates as controls; none of these antibodies were sensitive and specific in detecting human RBPMS or RBPMS2. We obtained a rabbit polyclonal antibody for human RBPMS using recombinant protein, and were able to specifically detect 1 ng of recombinant RBPMS at 1:100 dilution; however, the low expression levels of RBPMS in HEK293 cells did not allow detection of endogenous protein.
PAR-CLIP
PAR-CLIP from HEK293 cells constitutively (library A) and inducibly (library B) overexpressing FLAG-HA-tagged RBPMS protein was performed as described previously (Hafner et al. 2010). Briefly, the growth medium of HEK293 cells was supplemented with 100 μM 4SU for 12–16 h prior to crosslinking. After decanting the growth medium, cells were irradiated uncovered with 0.15 J/cm2 of 365 nm UV light in a Stratalinker 2400. A 5-mL cell pellet was processed to whole-cell lysate. FLAG-HA-tagged-RBPMS was immunoprecipitated with anti-FLAG antibody conjugated to protein G Dynabeads. The radiolabeled band corresponding to the ∼30-kDa RBPMS-RNA complex was excised, the associated RNA isolated by phenol-chloroform extraction following proteinase K treatment, converted to a cDNA library, and Illumina sequenced at the Rockefeller University Genomics Center.
Data analysis
PAR-CLIP processing
Processing, mapping, and grouping of PAR-CLIP cDNA library reads was performed as described in Corcoran et al. (2011) (http://www.genome.duke.edu/labs/ohler/research/PARalyzer/). After removing ambiguous and short (<20 nt) reads, we identified reads mapping to the human genome build hg19 with Bowtie 0.12.9 (Bowtie parameters “-v 1 -m 10 --all --best –strata”). We then identified groups of reads from overlapping clustered reads, built clusters using PARalyzer, and scored them by crosslinking efficiency (T-to-C conversion specificity, defined as log10[(T-to-C reads)/(1+ reads with other conversion)], fraction of reads ending in a G, fraction of redundant sequence reads). We used cERMIT to identify a nucleotide motif in the PAR-CLIP immunoprecipitated RNA as previously described (Georgiev et al. 2010), using as input all clusters mapping to mRNA. Specific parameter details for PARalyzer are listed in Supplemental Table 7. RSAT analysis was conducted as per Defrance et al. (2008).
Illumina array processing
Illumina arrays were background corrected, variance-stabilized transformed, quantile normalized, and filtered for gene expression, using custom scripts and the R package lumi (Du et al. 2008). Gene expression was defined as the median expression of all probes mapping to a gene and fold changes in gene expression between samples was computed according to Reich et al. (2006).
miReduce analysis, siRNA off-target effect, and transcript length correction
The sequence of the longest ENSEMBL annotated 3′ UTR for a gene was utilized for miReduce analysis (Sood et al. 2006) and siRNA off-target effect correction. miReduce analysis was utilized to detect 7-mers enriched in the 3′ UTR of genes with the largest expression changes following RBPMS knockdown or overexpression. Not surprisingly, seed sequences for the utilized siRNA were enriched in the 3′ UTR of genes that decreased in expression upon siRNA treatment. Specifically for the siRNA R2, the top enriched 7-mers in the 3′ UTR of genes that decreased in expression upon siRNA treatment included the 2–8 and 1–7 seed sequence for the antisense strand of siRNA R2 (Supplemental Table 5). Interestingly, 7-mers including a CAC were enriched in the 3′ UTR of genes that increased in expression upon siRNA treatment (Supplemental Table 5). Using the 3′ UTR sequence described above, each gene was categorized based on the presence of one or multiple 7-mer or 7-mer1A seed matches against the siRNA utilized (i.e., antisense strand of siRNA R2). We then performed a logistic regression of the log2 fold changes by the seed-match categories and saved the residuals for each value centered on their respective seed-match category mean (Supplemental Fig. 8B). Using these residuals in downstream differential expression analysis effectively corrected for the gene expression changes correlated with siRNA off-target activity (Supplemental Fig. 8). While off-target effects were present for both siRNAs (R2 and R3), the effects for R2 were stronger than R3, also suggesting that R3 may be less potent in knockdown of RBPMS (data not shown). Log2 fold changes in gene expression comparing RBPMS knockdown to mock transfection were also corrected for transcript length by performing linear regression of log2 fold changes by the longest mature mRNA length and saving the residuals. Cumulative distribution analysis was performed on these normalized expression values for genes categorized as described in specific analyses. Regression and cumulative distribution analysis were performed with JMP Pro 10 (SAS).
Poly(A) RNAseq processing
For poly(A) RNAseq the cDNA libraries were Illumina sequenced at a depth of 52–58 Mio reads per sample. Poly(A) Illumina RNAseq sequence reads were aligned to the reference genome and transcriptome (GRCh37/hg19) using TopHat version 2.0.8 (Trapnell et al. 2009, 2012) with default parameters. Transcript level differential expression was calculated using Cufflinks 2.0.2 (Trapnell et al. 2012), and differentially expressed transcripts were identified using default parameters (P-value <0.05). As a measure of alternative splicing, we applied a generalized linear model, which identifies alternative exon usage while controlling for differences at the level of gene expression using HTseq version 0.5.4 and DEXSeq version 1.4.0 (Anders et al. 2012). A total of 364 alternatively expressed exons were determined as those exons that had an FDR ≤0.1 and were not found in overlapping genes. We only identified 233 genes including differentially used exons in response to RBPMS overexpression, 89 containing RBPMS-binding sites, seven of which were located within 100 nt from the splice site.
GO analysis
Analysis was performed using PantherDB (www.pantherdb.org) reporting Bonferroni P-values.
Density plot generation
Density plots to assess the density of RBPMS-binding sites in different genomic locations (Supplemental Fig. 4) were constructed as described in Mukherjee et al. (2014).
Microarray processing for RBPMS mouse expression atlas
The microarray expression data (156 samples from six papers, listed in Supplemental Table 8) were downloaded from Gene expression Omnibus (GEO) and the CEL files were normalized concurrently for all samples using dChip software (Li and Wong 2001) as described previously (Yamaji et al. 2013).
RBPMS knockdown and overexpression
Silencer Select siRNAs (R2, R3) (Applied Biosystems) against the RBPMS ORF were transfected into the parental Flp-In T-REx HEK293 cells as well as HEK293 cells inducibly overexpressing FLAG-HA-tagged RBPMS (as a control) in a 12-well format using lipofectamine RNAiMAX (Invitrogen) according to the manufacturer's instructions, R2 and R3 individually at 25 nM or R2 and R3 together at 25 nM (12.5 nM each) and collected 72 h after transfection. Cells treated with lipofectamine RNAiMAX were used as a mock transfection control. HEK293 inducible FLAG-HA-tagged RBPMS cells were treated with 0.01 μg/mL of doxycycline (Sigma) for 72 h and compared with uninduced cells. All experiments were conducted as biological replicates. Total RNA was extracted using TRIZOL (Invitrogen) according to the manufacturer's instructions. We validated siRNA knockdown using HEK293 cells stably overexpressing FLAG-HA-tagged RBPMS (Supplemental Fig. 8).
For microarray expression analysis, RNA from these experiments was further purified using the RNeasy purification kit (Qiagen) and 1 μg of total RNA was subjected to Illumina Human HT12 v4 Expression BeadChip analysis. The samples were processed according to the manufacturer's instructions. For poly(A) RNAseq, 1 μg of total RNA was used as input for poly(A) purification and cDNA library construction using the TruSeq version 1.5 kit (Illumina). cDNA was barcoded using the Illumina Multiplexing Sample Preparation Oligonucleotide kit and analyzed on one lane of an Illumina HiSeq 2000 in a 100-nt single-end sequencing run.
Bacterial recombinant protein expression and purification
The pET23(a) vector (Novagen, #69745) was modified to contain an N-terminal FLAG-HA-tag aside from its encoded C-terminal His6 tag yielding pET23(a)_mod (Hoell et al. 2011). PCR amplification using primers RBPMS_pET23a_SalI_for and RBPMS_pET23a_NotI_rev from pENTR4_RBPMS yielded the RBPMS coding sequence (CDS) without the stop codon. The PCR product was SalI and NotI digested and ligated into the SalI- and NotI-digested pET23(a)_mod vector. We also used the unmodified pET23(a) vector (Novagen, #69745) and pET28(a) vector (Novagen, #69864) to produce singly N- or C-terminal His6-tagged proteins, as specified. pET23(a)_mod, pET28(a) or pET23(a) were transformed into BL21(DE3) cells. Bacterial cells were grown at 37°C and induced with 1 mM IPTG at an OD of 0.8. Bacterial cells were harvested by centrifugation at 9000g, lysed in 50 mM Tris-HCl (pH 8.0), 5 mM MgCl2, 1 M KCl, 10% glycerol, 5 mM imidazole, 0.1% reduced triton-X-100, 1 mM β-mercaptoethanol, and complete EDTA-free protease inhibitor cocktail (Roche) using an EmulsiFlex C5 homogenizer (Avestin), and recombinant protein was bound to a 5-mL TALON column via its terminal His6-tag. The protein was eluted using a 5 to 400-mM imidazole gradient spread over four column volumes using the AektaExplorer (GE Healthcare). Protein-containing fractions were combined and dialyzed against 50% glycerol, 20 mM Tris-HCl (pH 7.65), 300 mM KCl, 5 mM MgCl2, 0.1% reduced triton-X-100, 1 mM DTT (1X EMSA buffer). For full-length RBPMS we also tested whether the tag influenced the binding specificity by using untagged protein. For this experiment, the tag was proteolytically removed by thrombin cleavage using a 1:40 ratio of RBPMS to thrombin. Protein concentrations were estimated by comparing Coomassie stain intensity against a BSA standard (Pierce, #23209) on a 12% SDS–polyacrylamide gel. The protein was concentrated to 0.5–4 mg/mL. We confirmed that binding specificity for the (AC)9 RNA was not altered by the FLAG-HA or His6-tag used for protein purification (Supplemental Fig. 5B). We used the FLAG-HA- and His6-tagged proteins for the majority of EMSAs because they behaved better during EMSA with less tendency for precipitation.
Superdex 75 10/300 GL (17-5174-01) and Superdex 200 10/300 GL (17-5175-01) columns were run (GE Healthcare) in 1X EMSA buffer using the AektaExplorer (GE Healthcare). Fractions were collected and ran on a 12% SDS–polyacrylamide gel stained with Coomassie. Peaks were integrated using Unicorn 5.20 (Build 500) software (Amersham Bioscience) to calculate the elution volumes. Standards were used to calibrate the columns: conalbumin, carbonic anhydrase, ribonuclease, aprotinin, and ovalbumin for Superdex 75, and ferritin, conalbumin, carbonic anhydrase, and ribonuclease for Superdex 200 (GE Healthcare, #28-4038-41 and #28-4038-42, respectively).
Electrophoretic mobility shift assays
Oligoribonucleotides were labeled with [γ-32P]ATP and T4 polynucleotide kinase using standard conditions. A total of 10 nM 32P-labeled RNA was incubated with 0–10 µM protein in 20-μL reactions containing 250 mM KCl, 5 mM MgCl2, 25 mM Tris-HCl (pH 7.5), 10% glycerol, 1 mg/mL acetylated BSA (Ambion), 10 μM of yeast tRNA (Invitrogen). Reactions were incubated at 25°C for 30 min and separated on 1% agarose gel for 1 h at 150 V at room temperature using 1X TBE. For the His6-tagged N-terminal deletion construct and the His6-tagged full-length construct, we used binding conditions at pH 9.5 and 8.9, respectively, to accommodate their higher pI. The antibody concentrations used for supershift were 15 times higher than the protein concentration.
Image Gauge 4.1 (Fujifilm) was used to quantify the band intensity. The PhosphorImager-recorded fraction of bound RNA was calculated by dividing the intensities of mobility-shifted bands corresponding to the protein–RNA complexes by the sum of intensities by totaling both fractions of the labeled probe. The fraction of bound RNA was plotted against the protein concentration and fitted to the equation y = m1[1+(x/m2)m3], where y = fraction of bound RNA, x = protein concentration, m1 = maximum fraction bound RNA, m2 = Kd and m3 = cooperativity, using the software KaleidaGraph version 3.6 (Synergy Software).
Protein localization of overexpressed tagged protein using cell fractionation and immunohistochemistry
FLAG-HA-tagged RBPMS or RBPMS2 constitutively expressing HEK293 cells from one 15-cm plate were harvested by trypsinization and centrifuged for 5 min at 2000g at 4°C, resuspended in 1X PBS and the packed cell volume (pcv) was estimated. Cells were pelleted again and resuspended in 5 pcv 10 mM HEPES (pH 7.9) (KOH), 10 mM KCl, 1.5 mM MgCl2, 0.5 mM DTT, complete EDTA-free protease inhibitor cocktail (Roche) (Hypotonic Lysis Buffer [HLB]) and incubated on ice for 10 min. After a further centrifugation for 5 min at 2000g the pellet containing the nuclei was resuspended in 2 pcv HLB. The suspension was homogenized with five strokes in a Dounce glass homogenizer (type B pestle). Dounced cells were centrifuged for 10 min at 2000g to pellet nuclei, the supernatant was saved as the cytoplasmic extract (further centrifuged at 13,000g for 30 min). The nuclei were washed by resuspending in 2 pcv HLB, further centrifuged for 10 min at 2000g, and ultimately resuspended in 1X SDS sample buffer so that the final volume equaled that of the cytoplasmic extract. They were subsequently sonicated using a microtip five times for 15 sec on ice. Purity of the fractions was tested by probing with anti-lamin and anti-tubulin antibodies.
HEK293 cells inducibly expressing FLAG-HA-tagged RBPMS or RBPMS2 were grown on Lab-Tek II Chamber slides and induced with 1 μg/mL doxycycline for 24 h. Chamber slides were rinsed with PBS and cells were fixed in 4% paraformaldehyde/PBS for 15 min at 25°C. Slides were washed for 5 min with 50 mM NH4Cl in PBS and cells were permeabilized in PBS supplemented with 0.1% triton-X for 5 min. Slides were blocked with 5% normal goat serum in PBS for 30 min at RT and subsequently incubated for 1 h at 25°C with anti-HA antibody solution (Sigma-Aldrich, H3663, 1:1000 in 5% normal goat serum in PBS). Chamber slides were washed three times by 10-min incubation in PBS at 25°C, and were subsequently incubated for 1 h with a solution of Hoechst stain (1:1000) and Alexa Fluor 546 goat anti-mouse IgG (H + L; Life Technologies) (1:500 in 5% normal goat serum in PBS). Chamber slides were washed again three times using PBS and incubated for 10 min at 25°C and disassembled according to the manufacturer's instructions. Vectashield mounting medium (Vector Laboratories Inc.) was used and slides were covered with microscope cover glass (Nr. 2, Fisher Scientific). Single-layer images were recorded on a Zeiss LSM-710 confocal microscope.
Stress granule assay
For the stress granule assay, HEK293 cells inducibly expressing FLAG-HA-tagged RBPMS, RBPMS2, and G3BP1 were grown on chamber slides as described above. Arsenite was added to the cells at a final concentration of 100 or 400 μM and incubated for 30 min at 37°C. To examine whether 4SU influenced stress granule formation we also performed these assays in the presence and absence of 4SU. Chamber slides were rinsed with TBS (10 mM Tris-HCl at pH 7.4, 100 mM NaCl) and fixed in precooled 4% paraformaldehyde at 4°C for 100 min. Slides were prehybridized for 15 min using hybridization buffer (50% [v/v] Formamide, 1 M NaCl, 75 mM Tris-HCl (pH 8.5), 1X Denhardt's, 250 μg/mL yeast tRNA, 500 μg/mL salmon sperm DNA, 2.5 mM Chaps, 0.5% [v/v] Tween 20), and hybridized overnight at 40°C in hybridization buffer containing probes for poly(A) labeled with ATTO 647N and 28S rRNA labeled with ATTO 550 at a final concentration of 20 nM and 50 nM, respectively. The slides were washed twice for 5 min in wash buffer 1 (50% Formamide, 0.25 M NaCl, 75 mM Tris-HCl at pH 8.5, 0.1% [v/v] Tween 20), once for 3 min in wash buffer 2 (50 mM NaCl, 75 mM Tris-HCl at pH 8.5, 0.1% [v/v] Tween 20) and once for 3 min in TBS-T. Slides were blocked with 5% goat serum in TBS including 0.1% (v/v) Tween 20 (TBS-T) for 20 min at 25°C and subsequently incubated for 1 h with anti-HA antibody solution. Slides were washed three times by 3-min incubation with TBS-T, and were subsequently incubated for 1 h with a solution of DAPI stain and Alexa Fluor 488 goat anti-mouse IgG (H + L; Life Technologies) (1:500 in 5% normal goat serum in TBS-T). Chamber slides were washed again three times in TBS-T for 3 min and disassembled as described above using MOWIOL as mounting media. Images were recorded on the Olympus VS110 and processed using Visiopharm Integrated Systems Inc. software.
DATA DEPOSITION
The sequencing data are deposited at the Sequence Read Archive (SRA) (Study, PRJNA241095; library A, SRX484627; library B, SRX484628).
SUPPLEMENTAL MATERIAL
Supplemental material is available for this article.
ACKNOWLEDGMENTS
We thank all the members of the Tuschl laboratory for helpful discussions, especially Pavel Morozov. We thank Richard Wing and Ivo Melcak for discussions regarding modeling of RBPMS structure. We thank S. Dewell and C. Zhao (Genomics Resource Center) for Illumina sequencing, and Noreen Syed and Jeff Nusbaum for technical assistance. T.T. is an HHMI investigator and T.A.F. is supported by the RUCCTS Grant #UL1RR024143. T.T. and U.O. acknowledge support from an award by the US National Institutes of Health (R01-GM104962). C.S.L. is supported by the German National Academic Foundation (Studienstiftung des deutschen Volkes) and the Bayer Foundation. N.M. is supported by EU Marie Curie IIF (EU). K.M. is supported by the Deutche Forschungsgemeinschaft. C.M. is supported by the German Academic Exchange Service (DAAD). M.Y. is supported by a postdoctoral fellowship from the Japan Society for the Promotion of Science (JSPS) and is cosupported by the Vilcek Foundation and the RUCCTS Grant #UL1TR000043.
Footnotes
Article published online ahead of print. Article and publication date are at http://www.rnajournal.org/cgi/doi/10.1261/rna.045005.114.
REFERENCES
- Anders S, Reyes A, Huber W 2012. Detecting differential usage of exons from RNA-seq data. Genome Res 22: 2008–2017 [DOI] [PMC free article] [PubMed] [Google Scholar]
- Ascano M, Hafner M, Cekan P, Gerstberger S, Tuschl T 2012a. Identification of RNA–protein interaction networks using PAR-CLIP. Wiley Interdiscip Rev RNA 3: 159–177 [DOI] [PMC free article] [PubMed] [Google Scholar]
- Ascano M Jr, Mukherjee N, Bandaru P, Miller JB, Nusbaum JD, Corcoran DL, Langlois C, Munschauer M, Dewell S, Hafner M, et al. 2012b. FMRP targets distinct mRNA sequence elements to regulate protein expression. Nature 492: 382–386 [DOI] [PMC free article] [PubMed] [Google Scholar]
- Betley JN, Heinrich B, Vernos I, Sardet C, Prodon F, Deshler JO 2004. Kinesin II mediates Vg1 mRNA transport in Xenopus oocytes. Curr Biol 14: 219–224 [DOI] [PubMed] [Google Scholar]
- Buchan JR, Parker R 2009. Eukaryotic stress granules: the ins and outs of translation. Mol Cell 36: 932–941 [DOI] [PMC free article] [PubMed] [Google Scholar]
- Clery A, Blatter M, Allain FH 2008. RNA recognition motifs: Boring? Not quite. Curr Opin Struct Biol 18: 290–298 [DOI] [PubMed] [Google Scholar]
- Corcoran DL, Georgiev S, Mukherjee N, Gottwein E, Skalsky RL, Keene JD, Ohler U 2011. PARalyzer: definition of RNA binding sites from PAR-CLIP short-read sequence data. Genome Biol 12: R79. [DOI] [PMC free article] [PubMed] [Google Scholar]
- Defrance M, Janky R, Sand O, van Helden J 2008. Using RSAT oligo-analysis and dyad-analysis tools to discover regulatory signals in nucleic sequences. Nat Protoc 3: 1589–1603 [DOI] [PubMed] [Google Scholar]
- Derrien T, Johnson R, Bussotti G, Tanzer A, Djebali S, Tilgner H, Guernec G, Martin D, Merkel A, Knowles DG, et al. 2012. The GENCODE v7 catalog of human long noncoding RNAs: analysis of their gene structure, evolution, and expression. Genome Res 22: 1775–1789 [DOI] [PMC free article] [PubMed] [Google Scholar]
- Drozdov I, Bornschein J, Wex T, Valeyev NV, Tsoka S, Malfertheiner P 2012. Functional and topological properties in hepatocellular carcinoma transcriptome. PLoS One 7: e35510. [DOI] [PMC free article] [PubMed] [Google Scholar]
- Du P, Kibbe WA, Lin SM 2008. lumi: a pipeline for processing Illumina microarray. Bioinformatics 24: 1547–1548 [DOI] [PubMed] [Google Scholar]
- The ENCODE Project Consortium. 2011. A user's guide to the encyclopedia of DNA elements (ENCODE). PLoS Biol 9: e1001046. [DOI] [PMC free article] [PubMed] [Google Scholar]
- Georgiev S, Boyle AP, Jayasurya K, Ding X, Mukherjee S, Ohler U 2010. Evidence-ranked motif identification. Genome Biol 11: R19. [DOI] [PMC free article] [PubMed] [Google Scholar]
- Gerber WV, Yatskievych TA, Antin PB, Correia KM, Conlon RA, Krieg PA 1999. The RNA-binding protein gene, hermes, is expressed at high levels in the developing heart. Mech Dev 80: 77–86 [DOI] [PubMed] [Google Scholar]
- Gerber WV, Vokes SA, Zearfoss NR, Krieg PA 2002. A role for the RNA-binding protein, hermes, in the regulation of heart development. Dev Biol 247: 116–126 [DOI] [PubMed] [Google Scholar]
- Hafner M, Landthaler M, Burger L, Khorshid M, Hausser J, Berninger P, Rothballer A, Ascano M, Jungkamp AC, Munschauer M, et al. 2010. PAR-CliP—a method to identify transcriptome-wide the binding sites of RNA binding proteins. J Vis Exp doi: 10.3791/2034 [DOI] [PMC free article] [PubMed] [Google Scholar]
- Handa N, Nureki O, Kurimoto K, Kim I, Sakamoto H, Shimura Y, Muto Y, Yokoyama S 1999. Structural basis for recognition of the tra mRNA precursor by the Sex-lethal protein. Nature 398: 579–585 [DOI] [PubMed] [Google Scholar]
- Hapkova I, Skarda J, Rouleau C, Thys A, Notarnicola C, Janikova M, Bernex F, Rypka M, Vanderwinden JM, Faure S, et al. 2013. High expression of the RNA-binding protein RBPMS2 in gastrointestinal stromal tumors. Exp Mol Pathol 94: 314–321 [DOI] [PubMed] [Google Scholar]
- Hoell JI, Larsson E, Runge S, Nusbaum JD, Duggimpudi S, Farazi TA, Hafner M, Borkhardt A, Sander C, Tuschl T 2011. RNA targets of wild-type and mutant FET family proteins. Nat Struct Mol Biol 18: 1428–1431 [DOI] [PMC free article] [PubMed] [Google Scholar]
- Hornberg H, Wollerton-van Horck F, Maurus D, Zwart M, Svoboda H, Harris WA, Holt CE 2013. RNA-binding protein Hermes/RBPMS inversely affects synapse density and axon arbor formation in retinal ganglion cells in vivo. J Neurosci 33: 10384–10395 [DOI] [PMC free article] [PubMed] [Google Scholar]
- Hui J, Stangl K, Lane WS, Bindereif A 2003. HnRNP L stimulates splicing of the eNOS gene by binding to variable-length CA repeats. Nat Struct Biol 10: 33–37 [DOI] [PubMed] [Google Scholar]
- Kubalak SW, Miller-Hance WC, O'Brien TX, Dyson E, Chien KR 1994. Chamber specification of atrial myosin light chain-2 expression precedes septation during murine cardiogenesis. J Biol Chem 269: 16961–16970 [PubMed] [Google Scholar]
- Kwon SC, Yi H, Eichelbaum K, Fohr S, Fischer B, You KT, Castello A, Krijgsveld J, Hentze MW, Kim VN 2013. The RNA-binding protein repertoire of embryonic stem cells. Nat Struct Mol Biol 20: 1122–1130 [DOI] [PubMed] [Google Scholar]
- Kwong JM, Caprioli J, Piri N 2010. RNA binding protein with multiple splicing: a new marker for retinal ganglion cells. Invest Ophthalmol Vis Sci 51: 1052–1058 [DOI] [PMC free article] [PubMed] [Google Scholar]
- Larsson E, Lindahl P, Mostad P 2007. HeliCis: a DNA motif discovery tool for colocalized motif pairs with periodic spacing. BMC Bioinformatics 8: 418. [DOI] [PMC free article] [PubMed] [Google Scholar]
- Lebedeva S, Jens M, Theil K, Schwanhausser B, Selbach M, Landthaler M, Rajewsky N 2011. Transcriptome-wide analysis of regulatory interactions of the RNA-binding protein HuR. Mol Cell 43: 340–352 [DOI] [PubMed] [Google Scholar]
- Li C, Wong WH 2001. Model-based analysis of oligonucleotide arrays: expression index computation and outlier detection. Proc Natl Acad Sci 98: 31–36 [DOI] [PMC free article] [PubMed] [Google Scholar]
- Mahony S, Benos PV 2007. STAMP: a web tool for exploring DNA-binding motif similarities. Nucleic Acids Res 35: W253–W258 [DOI] [PMC free article] [PubMed] [Google Scholar]
- Maris C, Dominguez C, Allain FH 2005. The RNA recognition motif, a plastic RNA-binding platform to regulate post-transcriptional gene expression. FEBS J 272: 2118–2131 [DOI] [PubMed] [Google Scholar]
- Miller BG, Stamatoyannopoulos JA 2010. Integrative meta-analysis of differential gene expression in acute myeloid leukemia. PLoS One 5: e9466. [DOI] [PMC free article] [PubMed] [Google Scholar]
- Mitsui K, Tokuzawa Y, Itoh H, Segawa K, Murakami M, Takahashi K, Maruyama M, Maeda M, Yamanaka S 2003. The homeoprotein Nanog is required for maintenance of pluripotency in mouse epiblast and ES cells. Cell 113: 631–642 [DOI] [PubMed] [Google Scholar]
- Mukherjee N, Corcoran DL, Nusbaum JD, Reid DW, Georgiev S, Hafner M, Ascano M Jr, Tuschl T, Ohler U, Keene JD 2011. Integrative regulatory mapping indicates that the RNA-binding protein HuR couples pre-mRNA processing and mRNA stability. Mol Cell 43: 327–339 [DOI] [PMC free article] [PubMed] [Google Scholar]
- Mukherjee N, Jacobs NC, Hafner M, Kennington EA, Nusbaum JD, Tuschl T, Blackshear PJ, Ohler U 2014. Global target mRNA specification and regulation by the RNA-binding protein ZFP36. Genome Biol 15: R12. [DOI] [PMC free article] [PubMed] [Google Scholar]
- Notarnicola C, Rouleau C, Le Guen L, Virsolvy A, Richard S, Faure S, De Santa Barbara P 2012. The RNA-binding protein RBPMS2 regulates development of gastrointestinal smooth muscle. Gastroenterology 143: 687–697 [DOI] [PubMed] [Google Scholar]
- Oubridge C, Ito N, Evans PR, Teo CH, Nagai K 1994. Crystal structure at 1.92 Å resolution of the RNA-binding domain of the U1A spliceosomal protein complexed with an RNA hairpin. Nature 372: 432–438 [DOI] [PubMed] [Google Scholar]
- Perez-Canadillas JM 2006. Grabbing the message: structural basis of mRNA 3′UTR recognition by Hrp1. EMBO J 25: 3167–3178 [DOI] [PMC free article] [PubMed] [Google Scholar]
- Ray D, Kazan H, Cook KB, Weirauch MT, Najafabadi HS, Li X, Gueroussov S, Albu M, Zheng H, Yang A, et al. 2013. A compendium of RNA-binding motifs for decoding gene regulation. Nature 499: 172–177 [DOI] [PMC free article] [PubMed] [Google Scholar]
- Reich M, Liefeld T, Gould J, Lerner J, Tamayo P, Mesirov JP 2006. GenePattern 2.0. Nat Genet 38: 500–501 [DOI] [PubMed] [Google Scholar]
- Shimamoto A, Kitao S, Ichikawa K, Suzuki N, Yamabe Y, Imamura O, Tokutake Y, Satoh M, Matsumoto T, Kuromitsu J, et al. 1996. A unique human gene that spans over 230 kb in the human chromosome 8p11–12 and codes multiple family proteins sharing RNA-binding motifs. Proc Natl Acad Sci 93: 10913–10917 [DOI] [PMC free article] [PubMed] [Google Scholar]
- Skawran B, Steinemann D, Becker T, Buurman R, Flik J, Wiese B, Flemming P, Kreipe H, Schlegelberger B, Wilkens L 2008. Loss of 13q is associated with genes involved in cell cycle and proliferation in dedifferentiated hepatocellular carcinoma. Mod Pathol 21: 1479–1489 [DOI] [PubMed] [Google Scholar]
- Song HW, Cauffman K, Chan AP, Zhou Y, King ML, Etkin LD, Kloc M 2007. Hermes RNA-binding protein targets RNAs-encoding proteins involved in meiotic maturation, early cleavage, and germline development. Differentiation 75: 519–528 [DOI] [PubMed] [Google Scholar]
- Sood P, Krek A, Zavolan M, Macino G, Rajewsky N 2006. Cell-type-specific signatures of microRNAs on target mRNA expression. Proc Natl Acad Sci 103: 2746–2751 [DOI] [PMC free article] [PubMed] [Google Scholar]
- Spitzer JL, Landthaler M, Tuschl T 2013. Rapid creation of stable mammalian cell lines for regulated expression of proteins using the Gateway Recombination Cloning Technology and Flp-In T-REx lines. Methods Enzymol 529: 99–124 [DOI] [PubMed] [Google Scholar]
- Su AI, Wiltshire T, Batalov S, Lapp H, Ching KA, Block D, Zhang J, Soden R, Hayakawa M, Kreiman G, et al. 2004. A gene atlas of the mouse and human protein-encoding transcriptomes. Proc Natl Acad Sci 101: 6062–6067 [DOI] [PMC free article] [PubMed] [Google Scholar]
- Trapnell C, Pachter L, Salzberg SL 2009. TopHat: discovering splice junctions with RNA-Seq. Bioinformatics 25: 1105–1111 [DOI] [PMC free article] [PubMed] [Google Scholar]
- Trapnell C, Roberts A, Goff L, Pertea G, Kim D, Kelley DR, Pimentel H, Salzberg SL, Rinn JL, Pachter L 2012. Differential gene and transcript expression analysis of RNA-seq experiments with TopHat and Cufflinks. Nat Protoc 7: 562–578 [DOI] [PMC free article] [PubMed] [Google Scholar]
- Wang X, Tanaka Hall TM 2001. Structural basis for recognition of AU-rich element RNA by the HuD protein. Nat Struct Biol 8: 141–145 [DOI] [PubMed] [Google Scholar]
- Wang ET, Sandberg R, Luo S, Khrebtukova I, Zhang L, Mayr C, Kingsmore SF, Schroth GP, Burge CB 2008. Alternative isoform regulation in human tissue transcriptomes. Nature 456: 470–476 [DOI] [PMC free article] [PubMed] [Google Scholar]
- Yamaji M, Ueda J, Hayashi K, Ohta H, Yabuta Y, Kurimoto K, Nakato R, Yamada Y, Shirahige K, Saitou M 2013. PRDM14 ensures naive pluripotency through dual regulation of signaling and epigenetic pathways in mouse embryonic stem cells. Cell Stem Cell 12: 368–382 [DOI] [PubMed] [Google Scholar]
- Yang DH, Moss EG 2003. Temporally regulated expression of Lin-28 in diverse tissues of the developing mouse. Gene Expr Patterns 3: 719–726 [DOI] [PubMed] [Google Scholar]
- Zearfoss NR, Chan AP, Kloc M, Allen LH, Etkin LD 2003. Identification of new Xlsirt family members in the Xenopus laevis oocyte. Mech Dev 120: 503–509 [DOI] [PubMed] [Google Scholar]
- Zearfoss NR, Chan AP, Wu CF, Kloc M, Etkin LD 2004. Hermes is a localized factor regulating cleavage of vegetal blastomeres in Xenopus laevis. Dev Biol 267: 60–71 [DOI] [PubMed] [Google Scholar]