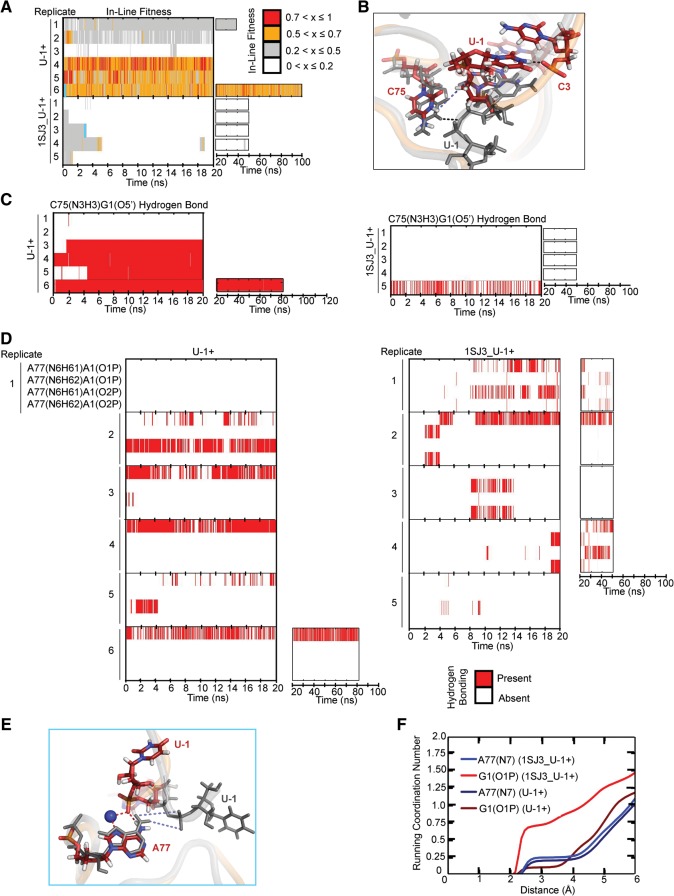
FIGURE 3.
Testing the hammerhead ribozyme model for the cleavage site. (A) In-line fitness of our U-1+ and 1SJ3_U-1+ simulations (Table 2). (B) Overlay of 1SJ3_U-1+ and U-1+ scissile phosphates. The 1SJ3_U-1+ structure is shown in color, while the U-1+ structure is shown in transparent cartoon with relevant residues shown as thickened lines. The U-1(N3)C3(O2P) heavy atom distance restrained in some simulations (Table 2) is denoted with a black dashed line, while the destabilized C75(N3H3)G1(O5′) distance is denoted with a light blue dashed line. For reference, the stable C75(N3H3)G1(O5′) distance is denoted in the gray U-1+ structure with a black dashed line. In all stick representations of 1SJ3_U-1+ structures, carbons are colored dark red, nitrogens are blue, oxygens are red, and hydrogens are white. (C) Comparison of C75H+(N3H3)…G1(O5′) hydrogen bonding occupancies of U-1+ and 1SJ3_U-1+ simulations. Traces were computed using the Simulaid program and in-house scripts, with cutoffs of ≥120° and ≤3.5 Å to indicate the presence of a hydrogen bond. (D) Monitoring of alternate A77(N6)…G1(O1/O2P) hydrogen bonding interactions for U-1+ and 1SJ3_U-1+ simulations. (E) The alternative ion cage observed in 1SJ3_U-1+ simulations. Overlays of 1SJ3_U-1+ and U-1 are shown in the left-hand portion of the figure. As in panel B, the 1SJ3_U-1+ structure is shown in color, while the U-1+ structure is in transparent gray cartoon for reference. Relevant residues are shown in sticks and thickened lines, respectively. Red dashed lines indicate hydrogen bonds/ionic interactions that form and are stable in 1SJ3_U-1+ trajectories, while blue dashed lines indicate hydrogen bonds in U-1+ simulations that are destabilized due to the new scissile phosphate conformation of the 1SJ3_U-1+ structure. A sodium ion is shown as a large navy sphere. The cyan lines in panel A denote from which replicate and at what times the snapshots were taken. (F) Coordination number of sodium ions at a given distance from each of the functional groups specified. The plotted curves are weighted averages from all available simulations of a given type.

