

Introduction
Photographers, cinematographers, and computer-graphics engineers create pictorial effects in various ways. For example, photographs of scenes captured with short-focal-length lenses appear expanded in depth, while those captured with long lenses appear compressed. These effects can be seen in still photographs and video. Figure 1A shows two example photographs. On the left, the goat looks stretched in depth; on the right, the pitcher and batter appear to be much closer to one another than they actually are. Figure 1B shows how depth compression and expansion can also affect the appearance of a face. Long lenses can make a person look smarter, more attractive, and less approachable; short lenses have the opposite effects (Perona, 2007).
Figure 1.
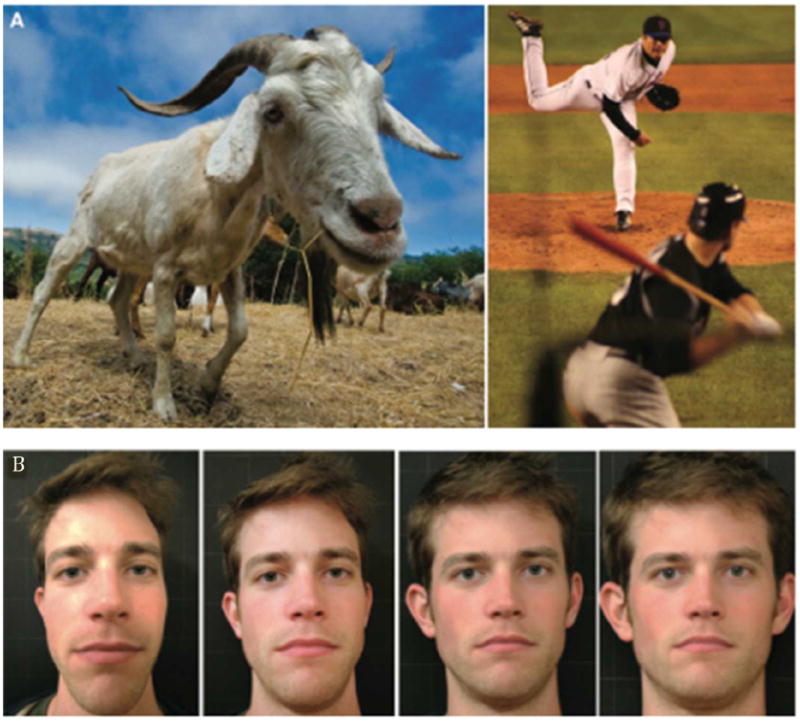
Depth compression and expansion with different focal lengths. A) Left panel: wide-angle effect (short focal length). This picture was taken with a 16mm lens (all focal lengths are reported as 35mm equivalent). The goat looks stretched in depth. Right panel: telephoto effect (long focal - length). This picture was taken with a 486mm focal length. The distance between the pitcher's mound and home plate on an official Major League Baseball field is 18.4 meters. This distance appears compressed. B) Photographs of the same person were taken with focal lengths from left to right of 16, 22, 45, and 216mm. Lens distortion was removed in Adobe PhotoShop, so the pictures are nearly correct perspective projections. Camera distance was proportional to focal length, so the subject's interocular distance in the picture was constant. The subject's face appears rounder with a short focal length and flatter with a long focal length.
The apparent expansions and compressions in depth are often called perspective distortion, as if these effects are due to a distortion in the physical projection from the scene to the film plane. The effects occur, however, when the projections are geometrically correct. Thus, the perceptual effects are not caused by physical distortion in the projections. To explain them, one must consider perceptual mechanisms and people's viewing habits, and that is the purpose of this chapter. Much of this work appeared in Cooper, Piazza, and Banks (2012).
A rule of thumb among professional photographers is to use a focal length of 50mm for standard 35mm film (more generally, a focal length equal to the diagonal length of the film or sensor) to create natural-looking images (Kingslake, 1992; Belt, 2008; Modrak & Anthes, 2011; London, Stone & Upton, 2010). Photography texts offer explanations for this rule's efficacy, but they are either vague or merely restatements of the phenomenon. For example, Modrak and Anthes (2011) claim that using 50mm lenses “approximates the angle of view and magnification of human vision”. Belt (2008) states that “the normal focal length for a given format most closely approximates human sight, and projects an image with the least distortion and compression of space from foreground to background”. We sought a more rigorous explanation of why the 50mm rule works and why deviations from it yield perceptual distortions.
Pictures (i.e., photographs, computer-generated images, and perspective paintings) are created by projecting the light from a 3D scene through a point—the center of projection or COP—onto a flat surface (Figure 2A). This is perspective projection. The field of view of a captured projection is:
Figure 2.
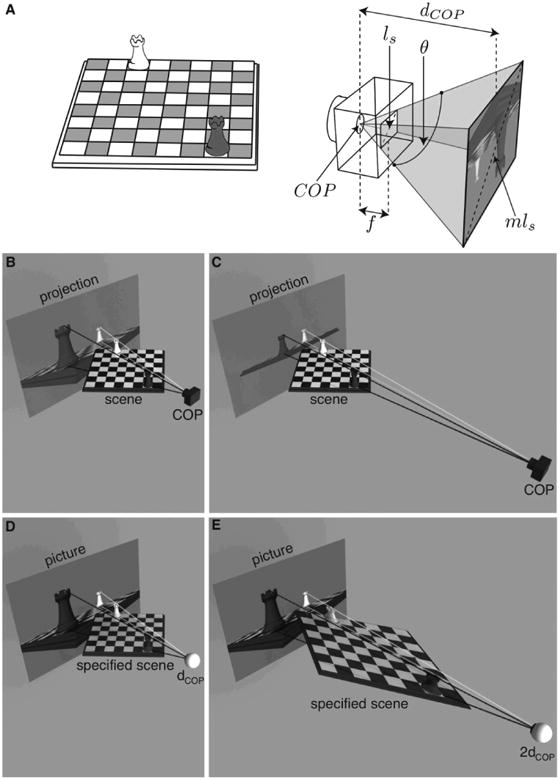
Camera, picture, and viewing parameters. A) Scene, camera, and picture. A camera with focal length f captures a picture on the sensor. The camera's diagonal field of view is θ. The sensor's diagonal length is ls, and the print is magnified by m to have a diagonal length of mls. The COP is located at the optical center of the camera. The distance to the COP, dCOP, is fm and the diagonal field of view subtended by the picture when viewed from the COP is θ. B,C) Perspective projection. The original scene—a chessboard—is projected from two different COPs onto a projection plane. D) If the picture from B is viewed from dCOP, the specified scene is the same as the original chessboard. E) If the same picture is viewed from twice the COP distance (2dCOP), the specified scene is stretched in depth relative to the original chessboard.
| (1) |
where ls is the diagonal length of the film or sensor, f is focal length, and θ is diagonal field of view. If the image on the sensor is magnified by m, the resulting picture has a diagonal length of mls. If the viewer's eye is positioned at the picture's COP, the image cast by the picture onto the retina matches the image that would be cast by the original scene. The distance to the COP is:
| (2) |
Of course, one cannot reconstruct the original scene rigorously from a single retinal image, whether it was generated by a real scene or a picture. But the brain reconstructs reasonably accurately most of the time by using assumptions about perspective (e.g., the chess pieces are the same size, the chessboard is composed of square tiles, the opposite sides of the chessboard are parallel; La Gournerie, 1859; Pirenne, 1970; Sedgwick, 1991; Todorović, 2005). Because viewing a picture from the COP generates the same retinal image as the original scene, it is not surprising that a picture viewed in this fashion yields a faithful impression of the scene layout or the physical characteristics of a person (Smith & Gruber, 1958; Koenderink, van Doorn, & Kappers, 1994; Vishwanath, Girshick, & Banks, 2005).
However, people do not necessarily position themselves at the COP when viewing pictures; they may be too far or too near. If viewers failed to compensate for an incorrect distance, the interpretation of the pictured scene would be distorted. For example, Figures 2B and C show two pictures of the same scene for two COP distances; the pictures differ. Figures 2D and E show how the apparent 3D scene may differ when one of the pictures (2B) is viewed from two different distances. When viewed from twice the COP distance, the layout specified by linear perspective is stretched in depth: The near chess piece projects to a larger image than the distant piece and, given the assumption that chess pieces are the same size, they appear farther from each other than they actually are. Similarly, for a viewer positioned too close to a picture, the apparent layout may be compressed in depth.
Previous research found that people do not compensate for incorrect viewing distance (Smith & Gruber, 1958; Bengston, Stergios, Ward, & Jester, 1980; Kraft & Greene, 1989; Todorović, 2009). In fact, Leonardo da Vinci described perceptual distortions when paintings were not viewed from the correct distance and advised painters of realistic scenes to make sure the viewer could view near the COP (da Vinci, 1970). Some research, however, has reported partial compensation for viewing distance: i.e., observers perceived the 3D scene geometry reasonably accurately even when the depicted geometry from linear perspective was distorted due to viewing from distances closer or farther than the COP (Lumsden, 1983; Yang & Kubovy, 1999).
We propose a new hypothesis for the effectiveness of the 50mm rule and for the perceptual distortions from other lenses. The hypothesis incorporates people's viewing habits and the perceptual mechanisms involved in estimating 3D structure from the retinal image. We present two experiments whose results confirm the main tenets of the hypothesis. The first experiment re-examines how people interpret the 3D geometry of a pictured scene in rich, realistic pictures when viewing from the wrong distance. The second one tests how people naturally set their viewing distance when looking at pictures. We then describe appropriate guidelines for constructing pictures when the picture creator's intention is to yield accurate percepts of 3D structure.
Experiment 1: Compensation for Viewing Distance
Methods
Five young adults participated. The stimuli were CG images of two rectangular planes joined to form a hinge. The planes were textured with a rectangular grid. The images were rendered using Maya (Autodesk) and consisted of photographs of wood that were texture-mapped onto the two sides of the hinge, wallpaper in the background, a wood-textured floor, and randomly positioned cubes scattered on the floor (Figure 3). The images were rendered with five different COP distances and displayed on a CRT.
Figure 3.
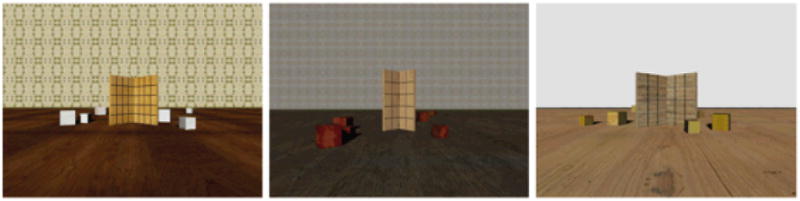
Examples of the hinge stimuli. The environment (background, cubes) and shape of the hinges were randomized to prevent subjects from learning specific pictorial cues to the hinge angle. There were three backgrounds, each with three unique hinge shapes resulting in nine scenes altogether. On each trial, the displayed hinge was selected randomly from these nine scenes.
Subjects were positioned 28cm from the CRT. They viewed the screen binocularly with the midpoint of the inter-ocular axis centered in front of the screen. They were told that the two sides of the hinge were rectangular. After each 1.5s stimulus presentation, subjects indicated whether the hinge angle was greater or less than 90°. A 1-up/1-down staircase varied the hinge angle symmetrically about the mid-sagittal axis with 10 reversals and a minimum step size of 2°. Data were fit with a cumulative Gaussian (psychometric function) using a maximum-likelihood criterion (Wichmann & Hill, 2001). The mean of the best-fitting function was defined as the angle perceived as 90°.
Results
The results of Experiment 1 are shown in Figure 4. If subjects were able to compensate for their viewing distance relative to the COP distance, they would perceive the depicted hinge angle correctly and would set the hinge to 90° in scene coordinates (horizontal dashed line). If subjects failed to compensate for the difference between their viewing distance and the COP distance and instead interpreted the scene directly from the geometry of the retinal image, they would set the depicted hinge angle to different values in scene coordinates for each COP distance. The predicted settings for this second hypothesis can be calculated from geometric analyses of perspective projection such as those presented by Sedgwick (1991) and Rosinksi and Farber (1980). With no compensation, the predicted hinge angle perceived to be 90° is:
Figure 4.

Effect of distance to COP on the angle perceived as 90°. Gray circles represent the mean angle perceived as 90° across subjects; error bars are standard errors. The dotted vertical line indicates the viewing distance. Plan views of the depicted angles that appeared to be 90° are shown in black on the right. The gray hinges indicate 90° for comparison.
| (3) |
where dCOP is the COP distance of the picture and dv is viewing distance (solid curve).
The data are very consistent with the no-compensation prediction. Some subjects had a bias in the angle perceived as 90° when viewing from the COP, but despite this bias, changing the COP distance always had the effect on perceived hinge angle that was predicted by the geometry of the retinal image. When the COP distance was less than the viewing distance, subjects perceived a larger angle as 90°, which means that they experienced depth expansion. When the COP distance was greater than the viewing distance, they perceived a smaller angle as 90°, meaning they experienced depth compression. When the COP distance and viewing distance were the same, a 90° hinge was perceived as close to 90°.
There were slight, but systematic differences between our data and the no-compensation predictions. Generally, subjects set the hinge angle to slightly less than the predicted value, which means that they perceived the angles as somewhat flatter than dictated by the geometry of the retinal image. (The one exception to this is at the greatest COP distance where they set the angle slightly larger than predicted.) We believe that the cause of this bias is the flatness specified by a number of cues including binocular disparity and focus cues (Watt, Akeley, Ernst, & Banks, 2005). We conclude that viewers do not compensate for incorrect viewing distance when shown pictures with rich perspective information.
Experiment 2: Preferred Viewing Distance
In this experiment, we measured people's preferred viewing distance for pictures of different focal lengths, magnifications, and print sizes. The results enabled us to determine whether people use consistent strategies for setting viewing distance and, if so, what those strategies are.
Methods
Eight young adults participated in the main experiment, and eleven additional young adults participated in a follow-up experiment. Scenes for the pictures were selected from five categories: indoor, street, outdoor open, outdoor closed, and portrait (Torralba & Oliva, 2003; Torralba, 2009). For each of the first four categories, we used three unique scenes: one photographed scene and two computer-generated (CG) scenes. For the fifth category, we used two photographed scenes.
The photographs were taken with a high-quality camera and printed with a resolution of 300 dpi and an aspect ratio of 3:2. All CG images were rendered with infinite depth of field (i.e., no blur) and were illuminated with a combination of a directional and ambient light source. For the photographs, we used the smallest aperture allowed by the lighting environment to minimize differences in depth of field and exposure between photographs taken with different focal lengths.
There were two primary stimulus manipulations: focal length and magnification. To manipulate focal length, we selected a focal object in each scene and created a series of five images taken with five different focal lengths—22 to 160mm (35mm equivalent)—while keeping the camera at one location. All of those pictures were magnified eight-fold and printed at 18×12cm. To manipulate magnification, we took photographs with a 56mm lens and printed them at 18×12cm (same as above), and four additional sizes (6×4, 9×6, 29×19, and 39×26cm).
By changing focal length, the focal object became different sizes in the prints (Figure 5A). To determine whether the varying size of that object affected preferred viewing distance, we also created five images in which the focal length was fixed at 56mm, but the camera was dollied in and out so that the size of the focal object would match those from the five focal lengths (Figure 5B). These were all printed at 18×12cm.
Figure 5.
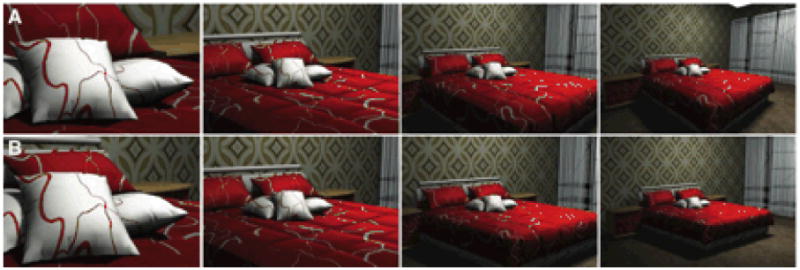
Changing focal length and camera distance to maintain constant size of the focal object (in this case, a pillow). A) The effect of changing focal length while keeping camera position constant. The focal lengths from left to right are 160, 56, 32, and 22mm. B) The effect of changing camera distance while holding focal length constant. From left to right, the camera is moved farther and farther from the focal object. Focal length was always 56mm. By moving the camera farther from the focal object, the sizes of the focal object are matched to those in the upper row without changing COP distance. Differences between the images in A and B are particularly noticeable in the apparent shape of the bed and slant of the wall.
We were curious to see whether these results would generalize to larger picture sizes, so we conducted a follow-up experiment with larger pictures. Eleven new subjects participated. The stimuli were the same with a few exceptions. Only four scenes were used: one indoor, one street, one outdoor open, and one outdoor closed. All pictures were CG. We created pictures with three focal lengths (22, 56, and 160mm) and printed each at four sizes (18×12, 53×35, 73×49, and 100×67cm). We dollied the camera away from the focal object as we increased the focal length in order to match the size of the object across focal lengths. Subjects were shown each focal length twice and each print size twice with a random selection of two of the four scenes.
At the start of each trial, a picture was mounted on a wall at the subject's eye level. Subjects initially stood 5m from the picture. They were instructed to walk back and forth along a line that was perpendicular to the picture until they were at “the best distance to view the picture from.” Once they indicated that they were at the preferred distance for that picture, the experimenter recorded the distance with a photograph. The trials were recorded so preferred distances could be measured off-line using the ruler tool in Adobe Photoshop.
Subjects were presented with a picture from each level of each manipulation eight times, with a random selection of 8 of the 14 scenes. Therefore, subjects did not see the same scene/manipulation combination twice. We measured test-retest reliability by presenting eight pictures four times each. Each subject thus completed a total of 136 trials.
The procedure of the follow-up experiment was essentially identical to the main experiment. To assess test-retest reliability, we randomly presented three pictures four times. Each subject therefore completed a total of 36 trials in this phase of the experiment.
We also investigated whether the manner of picture viewing—standing in front of a wall-mounted picture as opposed to holding a picture while seated—affects preferred viewing distances. Three subjects from the main experiment participated in these measurements. They sat in a chair and held each picture in their hands. They varied distance by adjusting their arms until they achieved the preferred value. We measured that distance using a laser range finder. A subset of the stimuli from the main experiment was used with one focal length (56mm) and two print sizes (9×6 and 18×12cm). For each print size, 10 of the 14 scenes were randomly selected. Each subject completed a total of 20 trials.
Results
We first asked whether the data from the follow-up experiment differed from the main experiment. A one-way ANOVA performed on the data from overlapping conditions revealed no significant effect (p = 0.53), so from here on we combine the data from these two experiments.
The results for the main stimulus manipulations—focal length and magnification—are illustrated in Figure 6. Panel A shows mean preferred viewing distance as a function of focal length. The results are plotted separately for each magnification. Some magnifications only have one focal length because the two variables were not completely crossed in the main experiment. There was clearly no effect of focal length on preferred viewing distance for a given magnification. Panel B shows the same data, but with mean preferred viewing distance plotted as a function of magnification. There was a strong effect of magnification/picture-size on preferred viewing distance, independent of focal length. The dashed line shows a linear regression of these data (p < 0.0001). Equations for the line as a function of picture diagonal (lp) and magnification (m) are shown next to the line. Notably, the y-intercept of the line (25cm) is the same as the nearest comfortable viewing distance for young adults (Ray, 2000).
Figure 6.

Effects of focal length and magnification on preferred viewing distance. A) Preferred viewing distance is plotted as a function of focal length for each magnification. Circles represent the data: the mean preferred viewing distance across subjects. Error bars represent standard errors of the mean. Each color represents a different picture magnification (and therefore a different picture size), as indicated by the legend. B) Data from panel A re-plotted as a function of magnification for each focal length. The diagonal length of the picture for different magnifications is indicated at the top. A linear regression of the data is represented by the dashed black line and the equation. All five focal length levels are plotted for magnification = 4.9, but the circles are largely overlapping because there was so little effect of focal length.
Figure 7A shows two subsets of stimuli for one example scene: five focal lengths for one magnification and eight magnifications for one focal length. Figure 7B shows the average preferred viewing distance for these subsets of all stimuli. If subjects preferred that pictures subtend a particular visual angle, or field of view (FOV), preferred distance would be proportional to print size, and the data would fall along one of the blue lines in Figure 7B, depending on the desired angle. Alternatively, if subjects always moved to the distance of the picture's COP (dCOP), the preferred viewing distance would be proportional to focal length and magnification (Equation 2), and the data would lie on the red lines in Figure 7B. The left panel shows that preferred viewing distance was barely affected by COP distance. From the nearest to farthest COP, preferred distance increased by only 20%, significantly less than the 614% change that would have occurred if subjects matched viewing distance to COP distance. The right panel shows that preferred viewing distance was strongly dependent on magnification (or equivalently picture size). But subjects were not establishing a constant field of view; rather, they preferred a small field (∼22°) with small prints and a larger field (∼36°) with large prints. This smaller preferred field of view for small prints likely reflects a trade-off between viewing comfort and angle subtended by the print. We conclude that picture viewers do not naturally set their viewing distance to a picture's COP distance. Instead they adjust distance according to the field of view (albeit smaller fields for small prints and larger fields for large prints). These data are consistent with television-viewing studies, which show that preferred viewing distance is determined by the size of the screen rather than image content or television resolution (Ardito, 1994; Lund, 1993).
Figure 7.
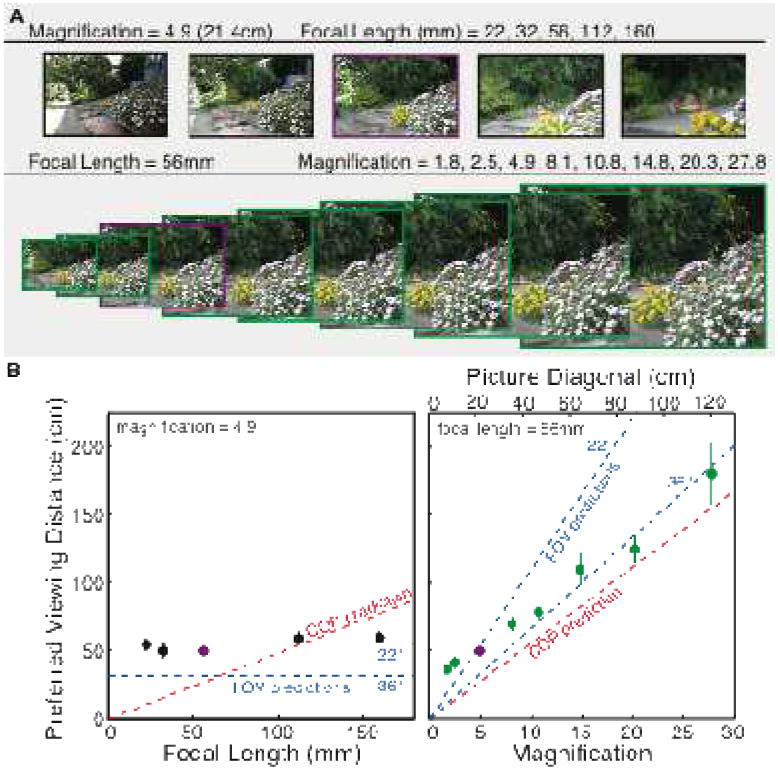
A) Example stimuli for two subsets of conditions. One subset contains five focal lengths with a magnification of 4.9 (diagonal length of the printed picture was 21.4cm). The other subset contains eight magnifications with a focal length of 56mm. The relative sizes of the stimuli actually changed by a factor of 15.4, but we cannot show such a large change in the figure. Therefore, the change in relative size shown above is qualitative. The purple boxes around two of the pictures indicate the one that was in both subsets. B) Two plots of average preferred viewing distance across subjects for each manipulation. Black and green circles represent the focal length and magnification manipulations, respectively, and correspond to the boxes around the pictures in panel A. The purple circles in both plots represent data from one magnification and focal length (4.9 and 56mm, respectively). Error bars represent standard errors of the mean.
To assess test-retest reliability, we also calculated the standard deviation of preferred viewing distance for each subject for each of the repeated pictures. The mean standard deviations across all images and subjects were 14cm for the main experiment and 22cm for the follow-up experiment. These values are small relative to the means, so the preferred distances were reasonably repeatable.
Finally, we examined the effect of standing (where subjects adjusted their viewing distance by walking to and fro) and sitting (where subjects held the pictures in their hands) on preferred viewing distance. A two-way ANOVA performed on overlapping conditions from the two sets of data revealed no effect (p = 0.59), so we conclude that people behave similarly when viewing wall-mounted pictures while standing and when viewing hand-held pictures while sitting (provided that picture size is not so large for arm length to limit the ability to set distance to the desired value).
Discussion
We can now explain why focal length affects apparent depth in pictured scenes and facial appearance in portraits. Recall that long- and short-focal-length pictures look respectively compressed and expanded in depth. We propose that people's preferred field of view when looking at most pictures leads them to view long-focal-length pictures from too near and short-focal-length pictures from too far. Perceptual compression and expansion occur because people do not take their incorrect viewing distances into account. Thus, scenes captured with long lenses look compressed in depth, which makes faces apparently flatter. Likewise, scenes captured with short lenses appear expanded in depth, which makes faces look rounder.
However, this does not tell us why pictures created with a 50mm lens look most natural: i.e., neither expanded nor compressed. To investigate this, we calculated for each picture size the focal length for which the subjects' average preferred viewing distance would be equal to the COP distance. We call this the recommended focal length:
| (4) |
where dpref is the average preferred viewing distance, lp is the diagonal length of the picture, and 43.3 is the diagonal length of standard 35mm film in millimeters. The recommended values from our data, calculated by averaging the preferred viewing distance across all focal lengths for each picture size from Experiment 2, are plotted in Figure 8. The regression line from Figure 6B is also re-plotted in terms of recommended focal length. The equation for the line is:
Figure 8.

Recommended focal length as a function of picture size. We calculated recommended focal length for each picture size by determining the average preferred viewing distance across all focal lengths from Experiment 2 (Figure 6B), and then calculating the focal length that would produce a COP distance equal to the preferred distance (Equation 4). Circles represent those values and error bars represent standard errors. The black curve shows the linear regression from Figure 6B re-plotted in terms of recommended focal length. Vertical bands indicate some typical images sizes for various formats. Horizontal bands indicate quantiles from several cumulative probability values for 3,930 Flickr photographs taken with SLR cameras.
| (5) |
Thus, for prints 35cm or larger, the recommended focal length is ∼50mm. Most prints, particularly professional ones, are at least that size. We claim therefore that following the 50mm rule of thumb maximizes the odds of a viewer looking at the photo from the COP distance and thereby makes it most likely that the percept will be undistorted. This rule has presumably evolved over time based on collective experience. Similar recommendations apply for cinematographers, computer-graphics engineers, and painters of realistic images. Some typical image sizes for various formats (Take, 2003) are superimposed as vertical bands in the figure. For most venues, the recommended focal length is ∼50mm (35mm equivalent). With the small screens of mobile devices, longer focal lengths should be used. If image creators know the size of a typical print or projection of their work, they can use Equation 5 to make a better choice of focal length, or to change the distance of the COP in post-processing (Carroll, Agarwala & Agrawala, 2010).
Most photography texts advocate the 50mm rule (Kingslake, 1992; Belt, 2008; Modrak & Anthes, 2011; London et al., 2010), but we wondered whether the rule is actually used in practice. To find out, we collected 3,930 photographs from the website Flickr that were taken with single-lens reflex (SLR) cameras (these cameras tend to be used by professionals and serious hobbyists). We obtained the 35mm-equivalent focal length for those photos from their EXIF data. The median is 68mm (50% quantile horizontal line in Figure 8). Interestingly, 68mm is closer than the advocated 50mm to our recommended focal length for a wide range of sizes. Thus, current practice deviates slightly from the 50mm rule, but is more consistent with our experimental data.
Our recommended focal length is much longer for small picture sizes, such as those on mobile devices. The viewing of images on mobile devices is becoming much more common (Choney, 2009; Carlsson & Walden, 2007). People tend to view smart phones from ∼30cm (Knoche & Sasse, 2008). When standard content is viewed at that distance, the smart-phone user is generally much farther from the display than the COP distance, making the images of objects subtend small angles and producing expansion in apparent depth. Interestingly, smart-phone viewers prefer standard content to be magnified and cropped (Knoche et al., 2007; Song et al., 2010), which increases the COP distance, much like increasing focal length; this practice should make the viewed content appear less expanded than it otherwise would.
Focal length has a strong effect on the perceived personality of subjects in portraits (Perona, 2007). We speculate that such effects derive from correlations between people's actual facial dimensions and personality traits. For example, faces appear narrower when photographed with short lenses and wider when photographed with long lenses (Figure 1B). The actual width-to-height ratio of male faces is positively correlated with aggressive behavior (Carre & McCormick, 2008), so attributions made from apparent ratio changes probably derive from correlations with real ratios. It would be interesting to examine the relationship between other facial dimensions affected by focal length (e.g., nose length, face roundness) and personality traits.
Conclusion
We claim that the 50mm rule emerged because of people's tendency to view pictures from a distance that establishes a desirable field of view and their inability to compensate when that tendency yields an incorrect viewing distance. Our data can be used to create better guidelines, based on empirical results, for creating effective pictures for all viewing situations.
Acknowledgments
This work was supported by NIH grant EY012851 and NSF grant BCS-0617701, and NDSEG fellowship to Emily Cooper.
Funding: The authors thank Darius Lerup for help in conducting the experiments, and Lawrence Arend, James O'Shea, Maneesh Agrawala, David Whitney, and Stephen Palmer for helpful comments.
References
- Adams KR. Perspective and the viewpoint. Leonardo. 1972;5:209–217. [Google Scholar]
- Ardito M. Studies of the influence of display size and picture brightness on the preferred viewing distance for HDTV programs. SMPTE Journal. 1994;103:517–522. [Google Scholar]
- Belt AF. The elements of photography: Understanding and creating sophisticated images. 2 Focal Press; Burlington, MA: 2008. [Google Scholar]
- Bengston JK, Stergios JC, Ward JL, Jester RE. Optic array determinants of apparent distance and size in pictures. Journal of Experimental Psychology: Human Perception & Performance. 1980;6:751–759. doi: 10.1037//0096-1523.6.4.751. [DOI] [PubMed] [Google Scholar]
- Carlsson C, Walden P. Mobile TV - to live or die by content. Proceedings of the 40th Hawaii International Conference on System Sciences. 2007;1:1530–1605. [Google Scholar]
- Carre JM, McCormick CM. In your face: facial metrics predict aggressive behavior in the laboratory and in varsity and professional hockey players. Proceedings of the Royal Society B. 2008;275:2651–2656. doi: 10.1098/rspb.2008.0873. [DOI] [PMC free article] [PubMed] [Google Scholar]
- Carroll R, Agarwala A, Agrawala M. Image warps for artistic perspective manipulation. ACM Transactions on Graphics. 2010;29(4):127, 1–9. [Google Scholar]
- Choney S. Online video watching nearly doubles since '06. [Accessed 22 September 2011];Pew Internet. 2009 http://www.pewinternet.org/Media-Mentions/2009/Online-video-watching-nearly-doubles-since-06.aspx.
- Cooper EA, Piazza EA, Banks MS. The perceptual basis of common photographic practice. Journal of Vision. 2012;12(5):8, 1–14. doi: 10.1167/12.5.8. [DOI] [PMC free article] [PubMed] [Google Scholar]
- Da Vinci L. In: The literary works of Leonardo da Vinci. Richter JP, editor. Phaidon; London: 1970. [Google Scholar]
- Kingslake R. Optics in photography. SPIE; Bellingham, WA: 1992. [Google Scholar]
- Knoche H, Papaleo M, Sasse MA, Vanelli-Coralli A. The kindest cut: Enhancing the user experience of mobile TV through adequate zooming. Proceedings of ACM Multimedia. 2007;1:23–29. [Google Scholar]
- Knoche H, Sasse MA. The sweet spot: How people trade off size and definition on mobile devices. Proceedings of ACM Multimedia. 2008;1:21–30. [Google Scholar]
- Koenderink JJ, van Doorn AJ, Kappers AML. On so-called paradoxical monocular stereoscopy. Perception. 1994;23:583–594. doi: 10.1068/p230583. [DOI] [PubMed] [Google Scholar]
- Kraft RN, Green JS. Distance perception as a function of photographic area of view. Perception and Psychophysics. 1989;45(4):459–466. doi: 10.3758/bf03210720. [DOI] [PubMed] [Google Scholar]
- La Gournerie JD. Traité de perspective linéare contenant les tracés pour les tableaux, plans et courbes, les bas-reliefs et les décorations théatrales, avec une théorie des effets de perspective. Dalmont et Dunod; Paris: 1859. [Google Scholar]
- London B, Stone J, Upton J. Photography. 10 Prentice Hill; New Jersey: 2010. [Google Scholar]
- Lumsden EA. Perception of radial distance as a function of magnification and truncation of depicted spatial layout. Perception & Psychophysics. 1983;33(2):177–182. doi: 10.3758/bf03202836. [DOI] [PubMed] [Google Scholar]
- Lund AM. The influence of video image size and resolution on viewing-distance preferences. SMPTE Journal. 1993;102:406–415. [Google Scholar]
- Modrak R, Anthes B. Reframing photography. Routledge; New York: 2011. [Google Scholar]
- Perona P. A new perspective on portraiture. Journal of Vision. 2007;7(9):992. [Google Scholar]
- Pirenne M. Optics, painting, & photography. Cambridge University Press; Cambridge: 1970. [Google Scholar]
- Ray SF. The geometry of image formation. In: Jacobson RE, Ray SF, Atteridge GG, Axford NR, editors. The Manual of Photography: Photographic and Digital Imaging. Focal Press; Oxford: 2000. pp. 39–57. [Google Scholar]
- Rosinski RR, Mulholland T, Degelman D, Farber J. Picture perception: An analysis of visual compensation. Perception & Psychophysics. 1980;28:521–526. doi: 10.3758/bf03198820. [DOI] [PubMed] [Google Scholar]
- Sedgwick HA. The effects of viewpoint on the virtual space of pictures. In: Ellis SR, Kaiser MK, Grunwald AC, editors. Pictorial Communication in Virtual and Real Environments. Taylor & Francis; London: 1991. pp. 460–479. [Google Scholar]
- Smith OW, Gruber H. Perception of depth in photographs. Perceptual and Motor Skills. 1958;8:307–313. [Google Scholar]
- Song W, Tjondronegoro DW, Wang S, Docherty MJ. Impact of zooming and enhancing region of interests for optimizing user experience on mobile sports video. Proceedings of the international conference on Multimedia. 2010;1:321–329. [Google Scholar]
- Take H. Market and technology trends in LCD TVs. Sharp Technical Journal. 2003;4:1–4. [Google Scholar]
- Todorović D. Geometric and perceptual effects of the location of the observer vantage point for linear-perspective images. Perception. 2005;34:521–544. doi: 10.1068/p5225. [DOI] [PubMed] [Google Scholar]
- Todorović D. The effect of observer vantage point on perceived distortions in linear perspective images. Attention, Perception, & Psychophysics. 2009;71:183–193. doi: 10.3758/APP.71.1.183. [DOI] [PubMed] [Google Scholar]
- Torralba A, Oliva A. Statistics of natural image categories. Network: Computation in Neural Systems. 2003;14:391–412. [PubMed] [Google Scholar]
- Torralba A. How many pixels make an image? Visual Neuroscience. 2009;26:123–131. doi: 10.1017/S0952523808080930. [DOI] [PubMed] [Google Scholar]
- Vishwanth D, Girshick AR, Banks MS. Why pictures look right when viewed from the wrong place. Nature Neuroscience. 2005;8:1401–1410. doi: 10.1038/nn1553. [DOI] [PMC free article] [PubMed] [Google Scholar]
- Watt SJ, Akeley K, Ernst MO, Banks MS. Focus cues affect perceived depth. Journal of Vision. 2005;5:834–862. doi: 10.1167/5.10.7. [DOI] [PMC free article] [PubMed] [Google Scholar]
- Wichmann FA, Hill NJ. The psychometric function: I Fitting, sampling, and goodness of fit. Perception & Psychophysics. 2001;63:1293–1313. doi: 10.3758/bf03194544. [DOI] [PubMed] [Google Scholar]
- Yang T, Kubovy M. Weakening the robustness of perspective: evidence for a modified theory of compensation in picture perception. Perception & Psychophysics. 1999;61:456–467. doi: 10.3758/bf03211966. [DOI] [PubMed] [Google Scholar]