

Abstract
Objective
We ascertain whether pediatric obesity without clinically-significant insulin resistance (IR) impacts brain structure and function.
Design and Methods
Thirty obese and 30 matched lean adolescents, all without clinically-significant IR or a diagnosis of metabolic syndrome (MetS), received comprehensive endocrine, neuropsychological, and MRI evaluations.
Results
Relative to lean adolescents, obese non-IR adolescents had significantly lower academic achievement (i.e. arithmetic and spelling) and tended to score lower on working memory, attention, psychomotor efficiency and mental flexibility. In line with our prior work on adolescent MetS, memory was unaffected in uncomplicated obesity. We also uncovered reductions in the thickness of the orbitofrontal and anterior cingulate cortices as well as reductions of microstructural integrity in major white matter tracts without gross volume changes.
Conclusions
We document, for the first time, that adolescents with uncomplicated obesity already have subtle brain alterations and lower performance in selective cognitive domains. When interpreting these preliminary data in the context of our prior reports of similar, but more extensive brain findings in obese adolescents with MetS and T2DM, we conclude that “uncomplicated” obesity may also result in subtle brain alterations, suggesting a possible dose effect with more severe metabolic dysregulation giving rise to greater abnormalities.
Keywords: Obesity, insulin resistance, adolescence, cognitive performance, diffusion tensor imaging, cortical thickness
Introduction
With the rise of sedentary lifestyles and ready access to inexpensive high caloric density foods, the prevalence of obesity is rising at an alarming rate and is a major risk factor for type 2 diabetes mellitus (T2DM), cardiovascular disease as well as other adverse health conditions (1). Currently in the United States, 17% of children are obese and an additional 18% are overweight (2) and 6% of them are morbidly obese with a body mass index (BMI) above 40 kg/m2. Obese youths are likely to become obese adults and are at risk for the same diseases faced by obese adults, but regrettably, at much younger ages and demonstrating more severe and harder to treat forms of disease (3).
There is a sizable literature documenting the negative brain consequences of obesity in adults (e.g., 4), with frontal lobe-based functions being particularly vulnerable (5). In contrast the pediatric literature is less well developed and the cognitive findings are much less consistent. Some reports demonstrated lower general intellectual functioning (6) and academic achievement (7), lower mental flexibility (8), and difficulty with attention and set shifting (9) in obese children. However, better powered studies focusing on less severe forms of obesity failed to identify such associations (e.g., 10).
There are also a handful of reports documenting brain circuits that may be involved in obesity (e.g., 11,12). These reports very likely included obese individuals with clinically-significant insulin resistance (IR), a common co-morbidity. We have previously described frontal and temporal lobe abnormalities in obese adolescents with T2DM relative to obesity-matched adolescents without IR (13,14). More recently, we demonstrated that non-diabetic obese adolescents with Metabolic Syndrome (MetS) also have poorer academic achievement and lower cognitive performance as well as increased overall cerebrospinal fluid (CSF) volume, reduced hippocampal volumes, and deficits in white matter (WM) microstructural integrity (15), abnormalities similar to those reported in obese adolescents with T2DM (13). In MetS the brain volume reductions were still present after accounting for BMI and were being driven by IR.
The present pilot study ascertained whether uncomplicated obesity, namely obesity in the absence of marked IR or a diagnosis of MetS, impacts brain structure and function in adolescents. We predict that adolescents with uncomplicated obesity do not exhibit the gross brain volume changes we have previously reported in T2DM (14) and MetS (15), and therefore measured more subtle cortical thickness of the overall brain and of the anterior cingulate (ACC) and orbitofrontal cortices (OFC), both of which have been previously implicated in obesity (16,17). Additionally, we used diffusion tensor imaging (DTI) to evaluate subtle cerebral WM abnormalities. Based on previous literature and that frontal lobe WM is still maturing during adolescence, we hypothesized that frontal lobe regions would be preferentially affected among obese adolescents without IR.
Materials and methods
Participants and procedures
140 adolescents were screened in a brain study of obesity and IR in youth. Exclusion criteria included Tanner stage <4, significant medical conditions (other than IR, polycystic ovary disease, dyslipidemia, or hypertension), a history of neurological disorders or significant head trauma, psychiatric illness, or substance abuse. All participants, and if <18 years old, a parent, signed informed consent and were compensated for participation. The study was approved by the local Institutional Review Board. For participants <18 years of age, obesity and healthy weight were defined as a BMI of ≥95th and ≤85th percentile respectively (18); for those ≥18 years of age, adults cutoffs were used (obese, BMI≥30 kg/m2; lean, BMI<25 kg/m2). Hypertension was defined as a systolic or diastolic blood pressure (BP)>90th percentile adjusted for age, sex, and height for ages≤18 (19) or ≥130/85 mm Hg, for those >18 years of age.
To ensure that we included only adolescents with “uncomplicated” obesity, namely, without T2DM, MetS, or clear evidence of IR (20), we excluded 72 screened participants from the present analysis (52 met criteria for MetS; five did not have enough data to rule out MetS; six did not fulfill criteria for MetS but had IR; seven were overweight by BMI percentile; two were on psychoactive medications). Of the 68 qualified participants without evidence of obvious IR (HOMA-IR≤3.99)(20), to ensure group matching on age, sex, school grade, socioeconomic status (SES), and ethnicity, we excluded, blind to brain variables, four lean and four obese participants, resulting in a final sample of 30 obese and 30 lean adolescents.
Participants underwent a comprehensive 7-h battery of medical, endocrine, psychiatric, cognitive, and brain MRI assessments completed over two separate days. Participants were recruited through online advertisements or were relatives or friends of other participants.
Neuropsychological assessment
Neuropsychological tests (21) were administered in a standardized fashion postprandially over two 1.5-h sessions. Overall intellectual ability was estimated with the Vocabulary and Matrix Reasoning subtests of the Wechsler Abbreviated Scale of Intelligence (WASI). Academic achievement was measured with the Wide Range Achievement Test (WRAT). Memory was evaluated using the Wide Range Assessment of Memory and Learning (WRAML). Executive functioning was estimated with the Trails B Test, Tower of London Test (TOL), Wisconsin Card Sorting Test (WCST), Stroop Test, and Controlled Oral Word Association Test (COWAT). Attention was evaluated using the Attention/Concentration Index Score from the WRAML, Trails A Test, and Digit Vigilance Test (DVT). The Digit Symbol Substitution Test (DSST) evaluated psychomotor speed. The raw scores were reported for all tests, except for the WASI, WRAT, and WRAML for which aged-corrected standard scores were computed. A 20-item questionnaire assessed obstructive sleep apnea (22), which is associated with obesity and structural brain changes (23) and cognition (24). A diagnosis of depression was exclusionary, but, to adjust for potential subclinical depressive symptoms on cognition, we administered the Beck Depression Inventory (BDI) (25). The International Physical Activity Questionaire (IPAQ) evaluated level of physical activity (26).
MRI acquisition
All participants received standardized MR scans on the same 1.5 T Siemens Avanto MRI System utilizing identical protocols described previously (13). Briefly, coronal spin–lattice relaxation time (T1)-weighted magnetization-prepared rapid acquisition gradient echo (MPRAGE) sequence was used for structural assessments. The axial DTI sequence assessed WM microstructure. The axial T2-weighted sequence was used along with the MPRAGE as anatomical guide in the DTI processing. The axial fast fluid-attenuated inversion recovery (FLAIR) sequence was used to rule out primary neurological disease.
Four obese and two lean participants were without MR data because they could not fit in the scanner or they were claustrophobic. Additionally, one lean participant had significant artifacts on the images, thus resulting in 53 (26 obese and 27 lean) participants with MRI scans for the volumetric and cortical thickness analyses. Of the 53 cases with usable scans, two obese participants had significant spatial distortions from dental braces on the DTI scans, thus leaving 51 (24 obese/27 lean) for fractional anisotropy (FA) analyses.
Manual tracing of regions of interest
All brain volumes were determined blind to participants’ identity and diagnosis. We outlined the intracranial vault (ICV) on the sagittal MPRAGE image by following the dural and tentorial margins. Overall CSF space was estimated using an intensity threshold for the CSF portion of the ICV. The hippocampus and the prefrontal region were outlined on the MPRAGE image using our highly-reliable parcellation methods (27,28). To account for intersubject variability in brain size, brain volumes were residualized to the ICV volume using linear regression.
OFC GM volume and cortical thickness assessment
We used the FreeSurfer toolkit (http://surfer.nmr.mgh.harvard.edu) to measure cortical thickness from the MPRAGE images. Using the standard options, the MPRAGE image was subjected to intensity normalization, skull-stripping and an affine transformation to Talairach space. A tissue segmentation algorithm was used to separate WM from non-WM, and the results were further optimized using a tesellation process followed by topological correction and smoothing (29). The cortex was inflated, flattened and registered to a spherical atlas using individual cortical folding patterns point-to-point (30). A cortical parceling algorithm assigns an anatomical label to each vertex on the cortical sheet (31). We computed GM volumes for the OFC (lateral and medial combined) and ACC (rostral and caudal combined). To account for interhemispheric differences in surface area, we averaged the cortical thickness of the OFC and ACC subregions between hemispheres weighted by their corresponding surface areas.
DTI processing
FA maps were corrected for spatial distortion inherent in echo planar acquisitions and normalized to standard (Talairach) space using the published Automatic Registration Toolbox software (32). Please refer to Yau et al. (2009) for detailed methods (33). In brief, the MPRAGE image was manually skull-stripped using the method described above and was then spatially normalized to a standard MNI template using a 3D non-linear algorithm. The T2-weighted image was then skull-stripped and registered to the MPRAGE image through an iterative process. A 2D non-linear algorithm was used to correct for spatial distortions on the non-diffusion-weighted b0 image. Finally, all the transformations were applied to spatially correct and normalize the FA maps.
Statistical analyses
The Shapiro-Wilk Test evaluated data normality. For cognitive variables, values >3 SDs from the respective group mean were excluded. Two-tailed independent samples t-tests (effect size Cohen’s d) examined group differences for normally distributed variables; otherwise, the Mann-Whitney U test (effect size r) was used. Univariate ANOVA analyses confirmed whether the observed cognitive differences were not confounded by sleep apnea, subclinical depression, or level of physical activity. The chi square test evaluated categorical variables. Overall CSF volume and all brain measures were residualized to the ICV volume using linear regression to adjust for individual brain size differences. A two-tailed voxelwise ANCOVA (VANCOVA) analysis examined group differences in WM FA with age as a covariate and a WM mask to restrict the analysis to WM regions. We minimized Type I error by restricting the accepted cluster size to at least 100 contiguous voxels (volume >=100 mm3) and by choosing a P-value threshold of 0.005 to keep the false discover rate below 1%. To ensure the validity of our DTI results, we mapped each significant cluster onto the individual normalized FA maps to check for contamination.
Results
The groups were well matched demographically (Table 1). Obese adolescents had higher BMI and larger waist circumference. All participants had normal fasting glucose levels and all except one obese participant (who had 22.20 μIU/mL but a HOMA of 3.91) had normal insulin levels (< 20.00 μIU/mL), thus as per our definition, no participant had clear evidence of IR, although obese adolescents had significantly higher insulin levels. Obese adolescents had significantly elevated systolic and tended towards higher diastolic BP. Two obese adolescents had been previously diagnosed with hypertension and one of them was on medication, and additionally, one obese and two lean adolescents, all males, met thresholds for hypertension when evaluated in our laboratory. Obese adolescents also had significantly lower HDL (15 obese/7 lean) and higher LDL levels as well as non-significantly higher triglycerides (4 obese/3 lean had elevated triglycerides). Obese adolescents had significantly elevated plasma C-reactive protein (CRP) levels, even after excluding those with values ≥10 mg/dL, who we argue could have an infection or acute inflammation. The groups did not differ on ratings of obstructive sleep apnea, subclinical depressive symptoms, or level of physical activity.
Table 1.
Demographic and Endocrine Data
| Measures | Obese (n = 30) Mean ± SD |
Lean (n = 30) Mean ± SD |
Effect Size | P |
|---|---|---|---|---|
| Age (yr) | 17.64 ± 1.62 (14.89–20.76) | 17.22 ± 1.55 (14.28–20.21) | 0.27 | 0.30 |
| Genderc | 17 F / 13 M | 19 F / 11 M | −0.13 | 0.61 |
| Socioeconomic statusa | 1.96 ± 1.12 | 2.20 ± 1.15 | −0.28 | 0.40 |
| School gradea | 11.87 ± 1.67 | 11.47 ± 1.84 | −0.10 | 0.42 |
| Ethnicity (White, Hispanic, African American, Asian)c | 6 / 15 / 6 / 3 | 5 / 13 / 8 / 4 | ||
| BMI (kg/m2)a | 35.47 ± 5.88 | 21.12 ± 2.18 | −0.86 | <0.001 |
| Waist measurement (cm)b | 106.82 ± 13.33 | 75.93 ± 6.19 | 2.97 | <0.001 |
| HOMA-IR indexa | 1.95 ± 0.86 | 1.40 ± 0.69 | −0.30 | 0.02 |
| Glucose (mg/dL)a | 74.93 ± 6.37 | 75.83 ± 6.85 | −0.06 | 0.64 |
| Insulin (μIU/mL) | 10.56 ± 4.71 | 7.49 ± 3.53 | 0.74 | 0.01 |
| HbA1C (%)a | 5.33 ± 0.33 | 5.24 ± 0.25 | −0.18 | 0.17 |
| HDL (mg/dL) | 45.90 ± 9.31 | 54.93 ± 11.64 | −0.86 | 0.002 |
| LDL (mg/dL) | 102.97 ± 25.47 | 90.50 ± 22.80 | 0.52 | 0.05 |
| Triglycerides (mg/dL)a | 79.13 ± 32.53 | 69.03 ± 28.61 | −0.20 | 0.11 |
| Systolic BP (mm Hg)a | 113.27 ± 12.80 | 100.93 ± 9.17 | −0.51 | <0.001 |
| Diastolic BP (mm Hg)a | 67.40 ± 9.93 | 63.07 ± 7.33 | −0.23 | 0.08 |
| CRP (mg/L)a | 3.06 ± 2.46 | 0.88 ± 1.69 | −0.59 | <0.001 |
| Self-rating of sleep apneaa | 0.20 ± 0.16 | 0.15 ± 0.11 | −0.14 | 0.27 |
| Beck Depression Inventory scorea | 9.45 ± 7.17 | 7.28 ± 7.06 | −0.18 | 0.18 |
| IPAQ total score (MET-mins/week)a | 4873.14 ± 3563.48 | 4233.54 ± 2384.29 | −0.05 | 0.71 |
Normally distributed continuous variables were evaluated with the t-test (effect size Cohen’s d) unless indicated otherwise.
The Mann-Whitney U test was used (effect size r: 0.1, small; 0.3, medium; 0.5, large).
Adjusted for unequal variances (t-test)
The chi-square test was used for categorical variables.
Note: Clinical cutoffs for abnormal values – HOMA-IR > 3.99; fasting glucose > 100 mg/dL; fasting insulin > 22 μIU/mL; HbA1C ≥ 5.7%; HDL < 40 mg/dL; LDL ≥ 130/110 mg/dL; triglycerides > 110 mg/dL; systolic/diastolic BP, for those 18 years of age ≥ 90th percentile for age, gender, and height; for those over 18 years of age, systolic BP ≥ 130 mmHg or diastolic BP ≥ 85mmHg; CRP > 3 mg/L.
Neuropsychological results
Obese adolescents had lower academic achievement, with statistically significant reductions in arithmetic and spelling skills (Table 2). Working memory was the only memory measure that trended lower in the obese group. Mental flexibility measured by Trails B total time was the only executive function that also trended lower. Obese adolescents tended to perform worse on WRAML Attention-Concentration Index and Trails A Test but the groups did not differ on DVT total time. Obese adolescents also tended to score lower on psychomotor efficiency. These cognitive differences remained largely unchanged after controlling for age, sex, self-ratings of sleep apnea, BDI scores, or level of physical activity.
Table 2.
Cognitive Data
| Measures | Obese (n = 30) Mean ± SD |
Lean (n = 30) Mean ± SD |
Effect Size | P |
|---|---|---|---|---|
| Intellectual functioning and academic achievement | ||||
| Estimated full-scale IQ | 102.56 ± 11.49 | 107.44 ± 13.18 | −0.40 | 0.15 |
| WRAT arithmetic standard score | 96.04 ± 11.02 | 103.52 ± 13.82 | −0.60 | 0.03 |
| WRAT spelling standard scorea | 101.71 ± 12.10 | 106.81 ± 11.46 | −0.28 | 0.04 |
| WRAT reading standard scorec | 106.61 ± 12.13 | 107.85 ± 9.44 | −0.11 | 0.68 |
| Memory function | ||||
| WRAML general index | 103.30 ± 12.79 | 106.61 ± 12.52 | −0.26 | 0.32 |
| WRAML verbal index score | 105.37 ± 12.14 | 104.29 ± 11.57 | 0.09 | 0.73 |
| WRAML visual index scorec | 102.52 ± 10.32 | 100.31 ± 12.98 | 0.19 | 0.48 |
| WRAML working memory index | 100.17 ± 15.57 | 107.69 ± 13.96 | −0.51 | 0.06 |
| Executive function | ||||
| Trails B time (s)c | 64.56 ± 21.17 | 55.31 ± 15.68 | 0.50 | 0.08 |
| TOL excess movesa | 16.77 ± 13.15 | 12.32 ± 7.01 | −0.13 | 0.33 |
| WCST perseverative errorsa | 10.85 ± 8.39 | 9.96 ± 5.56 | −0.01 | 0.92 |
| Stroop interference score | 0.07 ± 7.32 | −2.00 ± 6.02 | 0.31 | 0.24 |
| COWAT total scoreb | 34.39 ± 8.27 | 38.97 ± 14.71 | −0.38 | 0.15 |
| Attention and psychomotor efficiency | ||||
| WRAML attention-concentration index | 101.40 ± 13.65 | 108.86 ± 15.94 | −0.50 | 0.06 |
| Trails A time (s)a | 28.14 ± 8.91 | 24.04 ± 7.27 | −0.23 | 0.08 |
| DVT total timea,c | 396.43 ± 128.12 | 358.58 ± 72.33 | −0.17 | 0.22 |
| DSST total score | 60.19 ± 10.57 | 65.89 ± 12.20 | −0.50 | 0.07 |
Normally distributed continuous variables were evaluated with the t-test (effect size Cohen’s d) unless indicated otherwise.
COWAT, Controlled Oral Word Association Test; DVT, Digit Vigilance Test; DSST, Digit Symbol Substitution Test; TOL, Tower of London Test; WCST, Wisconsin Card Sorting Test; WRAML, Wide Range Assessment of Memory and Learning; WRAT, Wide Range Achievement Test.
The Mann-Whitney U test was used (effect size r: 0.1, small; 0.3, medium; 0.5, large).
Adjusted for unequal variances (t-test).
Scores more than 3 SDs within the group mean were excluded.
Imaging results
One obese adolescent with an ICV volume 3 SDs larger than the group mean was excluded from brain volumetric analysis but was retained in the voxelwise DTI analyses, which are independent of brain size. As expected, the groups had comparable ICV volume and whole brain cortical thickness and did not differ for any of the ICV-adjusted volumes (Table 3). Although there were no significant differences in prefrontal lobe volumes, obese adolescents had reductions in the ICV-adjusted cortical thickness of OFC (P<0.05) and ACC (P<0.10), both with medium effect sizes.
Table 3.
Brain Data
| Measures | Obese (n = 26) Mean ±SD |
Lean (n = 27) Mean±SD |
Effect Size | P |
|---|---|---|---|---|
| ICV volume (cc) | 1198.98 ± 99.31 | 1209.62 ± 118.91 | −0.10 | 0.73 |
| Overall CSF volumea | 31.83 ± 19.22 | 30.39 ± 10.82 | −0.06 | 0.64 |
| Hippocampal volume | 2.96 ± 0.36 | 2.94 ± 0.38 | 0.11 | 0.71 |
| PFC volume | 313.73 ± 45.96 | 305.61 ± 42.32 | 0.43 | 0.14 |
| OFC gray matter volume | 27.52 ± 2.73 | 28.34 ± 2.84 | −0.39 | 0.17 |
| ACC gray matter volume | 8.28 ± 1.47 | 8.53 ± 1.21 | −0.18 | 0.52 |
| Whole brain cortical thickness | 2.46 ± 0.08 | 2.47 ± 0.07 | −0.13 | 0.64 |
| Total OFC cortical thickness | 2.76 ± 0.14 | 2.83 ± 0.10 | −0.55 | 0.05 |
| Total ACC cortical thickness | 2.83 ± 0.15 | 2.90 ± 0.16 | −0.52 | 0.07 |
All brain data are residualized to the ICV volume. For ease of interpretation, raw values for the descriptive data are presented (volumes are expressed in cc and cortical thickness in mm3).
Normally distributed continuous variables were evaluated with the t-test (effect size Cohen’s d); otherwise,
the Mann-Whitney U test was used (effect size r: 0.1, small; 0.3, medium; 0.5, large).
In the absence of gross brain volume differences or clinically-significant WM hyperintensities on the FLAIR image, the VANCOVA analysis of the FA maps identified seven significant clusters (1651 voxels or 1.65 cc in volume), six of which showed age-adjusted WM FA reductions among obese adolescents (P <0.005). The clusters showing FA reduction were located, by order of size, in the left temporal stem, right optic radiation, left internal capsule, left splenium, left external capsule, and left optic radiation (see Figure 2 for the largest six clusters). The single cluster showing FA elevation was located in the right prefrontal region and had partial GM contamination. The temporal stem cluster, the largest identified (790 voxels), also had some GM contamination, but given its prominent size, the cluster would have remained the largest and substantial in size even after excluding those potentially contaminated voxels. At a more conservative P-value threshold of 0.001, only the left temporal stem cluster remained significant (373 voxels). These results remained the same even after controlling for sex or hypertension status.
Discussion
To our knowledge, this is the first preliminary report of reduced brain structural integrity and lower cognitive performance among adolescents with uncomplicated obesity. Notably, none of our participants had IR or met criteria for MetS, thus allowing us to examine the brain effects in obesity alone. We found that relative to demographically matched lean adolescents, obese adolescents with no clear evidence of IR had significantly lower academic achievement and trended towards lower scores for selective frontal lobe-based functions. As hypothesized, their memory function was largely unaffected. Also, as anticipated, obese adolescents did not have gross brain volume changes, but rather demonstrated reductions in the cortical thickness of the OFC and ACC, two important regions implicated in eating behaviors and impulse inhibition. Additionally, we uncovered widespread reductions in the microstructural integrity of major cerebral WM tracts.
Obese adolescents, though still performing within the normal range, scored descriptively lower than their lean counterparts on many of the cognitive tests. Similar to prior reports in adolescents with obesity co-morbidities (13,15), adolescents with uncomplicated obesity also had significantly lower academic achievement (i.e. arithmetic and spelling). They also tended to score lower on some frontal lobe functions including working memory, attention, and psychomotor efficiency. Mental flexibility was the only type of executive function that trended towards significance. In agreement with our report on obese non-diabetic adolescents with MetS (15), memory functions were unaffected in obese adolescents without IR. It is likely that actual metabolic disturbance, such as IR, is needed to compromise memory.
Obese adolescents without IR, unlike obese adolescents with MetS (15) or T2DM (13), did not have gross brain volume changes. Here we demonstrated for the first time that non-IR obese adolescents had reduced cortical thickness in the OFC and ACC but contrary to prior reports that did not exclude adolescents with clear IR (e.g., 34), we did not find volume changes in those regions. Studies of other disease conditions in adolescents have suggested that cortical thickness is a more sensitive measure of cortical integrity than volume (e.g., 35) as it is more related to GM density. Despite the modest sample size, the DTI results are consistent with our prior reports of obese adolescents with IR (15), and demonstrate FA reduction in major fiber tracts involved in cortico-subcortical as well as interhemispheric signal transmission, and importantly, these observations were independent of hypertension. Notably, our most prominent FA finding was in the left temporal stem, which is consistent with our previous report in adolescent T2DM (13). This cluster may contain the uncinate fasciculus, a major component of the temporal stem connecting between the frontal lobe and the limbic system, which may in part contribute to deficits in reward processing in obesity (36). DTI tractography using a more sophisticated DTI protocol with at least 30 diffusion directions would help clarify the involvement of the temporal stem.
Contrary to expectation, we did not find reduced WM microstructural integrity in the frontal lobes similar to those reported in adults. It is likely that more metabolic dysregulation, such as clinically-significant IR, is necessary to impact WM maturation in the frontal lobe of the adolescent brain. Unlike our prior findings in adolescent with MetS (15) and T2DM (13) where we saw no clear lateralization, the current WM findings are mostly left-lateralized. These findings may not be directly comparable to prior data on adults and children since here the obese adolescents have no significant co-morbidities.
Both groups had individuals with obesity co-morbidities (only 4 obese/3 lean with hypertriglyceridemia, 3 obese/2 lean with hypertension, and 15 obese/7 lean with low HDL); however, their links with brain abnormalities are less well-established, particularly in the pediatric literature. We conducted exploratory correlation analyses (data not presented) but did not uncover any robust associations with the cognitive or brain measures. Although marked fasting hyperinsulinemia, or fasting hyperglycemia may be needed to cause gross brain structural damage and functional disturbances, it is possible that sub-threshold IR can contribute to subtle brain structural and functional damage. Our obese adolescents had no clear IR or fasting hyperglycemia but their HOMA-Index or fasting insulin values were significantly higher than lean controls, but these elevations were not associated with our cognitive and brain observations. A more sensitive measure of insulin sensitivity measured using the intravenous glucose tolerance test may shed light on the possible effects of subclinical IR on cognition and brain. Future work should better characterize these associations in an expanded set of adolescents and ascertain for the presence of possible sex effects.
Although we do not anticipate adolescents carrying excess weight to have significant occlusive vascular disease, which is often linked to WM disease in adults, we know that subclinical vascular findings, such as increased carotid intima-media thickness (37) and increased stiffness (38), have been described in obese adolescents and there is mounting evidence that obesity-associated inflammation is related to cardiovascular disease. We do not have data regarding endothelial function, but as anticipated our obese adolescents had marked elevation in both fibrinogen and CRP levels. It is possible that obesity alone, or when coupled with subtle IR, may increase inflammation and oxidative stress (39), which in turn contribute to endothelial dysfunction and subsequently impair vascular reactivity, thus diminishing blood supply necessary for maintaining brain structural integrity and function (please see theoretical model presented in Convit [2005]) (40).
This study has several strengths. The groups were well-matched to minimize socio-economic and education bias. We used reliable, validated and sensitive brain assessment methods so as to detect the anticipated subtle changes. The fact that our obese adolescents are free of clinically-significant IR allows us to explore possible associations between uncomplicated obesity and brain structure and function. Furthermore, our controls are not a sanitized group of individuals without any abnormality, but a real world sample: seven had low HDL, three high triglycerides, two high BP, and one with abdominal obesity (but a normal BMI of 21.7 kg/m2). Had our lean adolescents been all metabolically healthy, or the sample size been larger, the group differences would likely have been more prominent. These data are in line with our prior report of progressive reductions of brain structural and functional integrity with increasing MetS factors met (15).
This study is limited by its modest sample size and the relatively large number of comparisons. We minimized the chance of obtaining spurious significant results by removing extreme cognitive outliers and using conservative thresholds in our brain microstructural assessments. Although many of the cognitive differences were subtle and may not be clinically relevant, which we had anticipated in this group of adolescents with “uncomplicated” obesity, these data provide some unique insights into the possible early negative consequences of childhood obesity on brain and cognition, along with indication of future areas of exploration. Thus, we felt justified in not controlling for multiple comparisons in this preliminary report. Lastly, to better understand brain involvement, future studies should include a more comprehensive brain evaluation including direct assessments of the components of the neural networks thought to be involved in obesity.
Conclusions
We conclude that uncomplicated obesity may be sufficient to induce subtle brain structural alterations prior to clinically-significant obesity co-morbidities being present. However, to cause gross structural damage, further metabolic dysregulation, such as marked fasting hyperinsulinemia, or fasting hyperglycemia may be necessary. The present findings are a significant contribution to the small pediatric literature on brain and obesity, particularly among obese adolescents without clear evidence of IR or MetS. These data suggest that early interventions are warranted to protect the brain. Future work should also clarify whether these cognitive and brain alterations are reversible with lifestyle intervention and weight loss.
Figure 1.
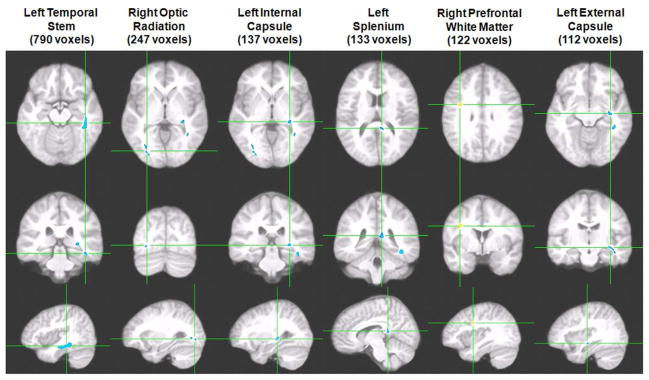
Six of the seven clusters demonstrating significant FA group differences are displayed in order of cluster size (VANCOVA analysis controlling for age; minimum cluster size of 100 voxels; P<0.005; clusters in blue represent FA reductions in obese adolescents whereas positive associations in yellow represent FA elevation). Each column shows three orthogonal orientations of the average normalized structural image illustrating a significant cluster with the axes passing through the centroid of the cluster. The largest cluster, found in the left temporal stem, was the only one that remained significant at a more conservative P-vlaue threshold of 0.001.
What is already known about this subject
The prevalence of childhood obesity is rising at an alarming rate. Data regarding the impact of obesity on brain structure and function are available in adults but are limited in children, particularly among obese adolescents without co-morbid insulin resistance.
What this study adds
We demonstrate reductions in academic achievement and trends towards lower performance in frontal lobe functions (i.e. working memory and attention) as well as subtle brain structural abnormalities in adolescents with uncomplicated obesity, thus providing preliminary evidence that the brain is impacted by obesity prior to clinically-significant obesity-associated insulin resistance.
Acknowledgments
Funding agencies: This work was funded by the National Institutes of Health grant number DK 083537 and also funded in part by grant 1UL1RR029893 from the National Center for Research Resources.
Footnotes
Conflict of Interest: The authors have indicated they have no potential conflicts of interest to disclose.
Author contributions: Each author made substantial contributions to this manuscript. Dr. Convit designed, performed and supervised the study. Dr. Yau, Dr. Convit, Ms. Kang, and Mr. Javier acquired and analyzed the data. Drs. Yau and Convit wrote the manuscript. All authors have seen and approved of the final version of the manuscript.
References
- 1.James PT. Obesity: the worldwide epidemic. Clin Dermatol. 2004;22:276–280. doi: 10.1016/j.clindermatol.2004.01.010. [DOI] [PubMed] [Google Scholar]
- 2.Wang Y, Beydoun MA. The obesity epidemic in the United States--gender, age, socioeconomic, racial/ethnic, and geographic characteristics: a systematic review and meta-regression analysis. Epidemiol Rev. 2007;29:6–28. doi: 10.1093/epirev/mxm007. [DOI] [PubMed] [Google Scholar]
- 3.Constantino MI, Molyneaux L, Limacher-Gisler F, Al-Saeed A, Luo C, Wu T, et al. Long-term complications and mortality in young-onset diabetes: type 2 diabetes is more hazardous and lethal than type 1 diabetes. Diabetes Care. 2013;36:3863–3869. doi: 10.2337/dc12-2455. [DOI] [PMC free article] [PubMed] [Google Scholar]
- 4.Pannacciulli N, Del Parigi A, Chen K, Le DS, Reiman EM, Tataranni PA. Brain abnormalities in human obesity: a voxel-based morphometric study. Neuroimage. 2006;31:1419–1425. doi: 10.1016/j.neuroimage.2006.01.047. [DOI] [PubMed] [Google Scholar]
- 5.Gunstad J, Paul RH, Cohen RA, Tate DF, Spitznagel MB, Gordon E. Elevated body mass index is associated with executive dysfunction in otherwise healthy adults. Compr Psychiatry. 2007;48:57–61. doi: 10.1016/j.comppsych.2006.05.001. [DOI] [PubMed] [Google Scholar]
- 6.Li X. A study of intelligence and personality in children with simple obesity. Int J Obes Relat Metab Disord. 1995;19:355–357. [PubMed] [Google Scholar]
- 7.Falkner NH, Neumark-Sztainer D, Story M, Jeffery RW, Beuhring T, Resnick MD. Social, educational, and psychological correlates of weight status in adolescents. Obes Res. 2001;9:32–42. doi: 10.1038/oby.2001.5. [DOI] [PubMed] [Google Scholar]
- 8.Lokken KL, Boeka AG, Austin HM, Gunstad J, Harmon CM. Evidence of executive dysfunction in extremely obese adolescents: a pilot study. Surg Obes Relat Dis. 2009;5:547–552. doi: 10.1016/j.soard.2009.05.008. [DOI] [PubMed] [Google Scholar]
- 9.Cserjesi R, Luminet O, Poncelet AS, Lenard L. Altered executive function in obesity. Exploration of the role of affective states on cognitive abilities. Appetite. 2009;52:535–539. doi: 10.1016/j.appet.2009.01.003. [DOI] [PubMed] [Google Scholar]
- 10.Gunstad J, Spitznagel MB, Paul RH, Cohen RA, Kohn M, Luyster FS, et al. Body mass index and neuropsychological function in healthy children and adolescents. Appetite. 2008;50:246–251. doi: 10.1016/j.appet.2007.07.008. [DOI] [PubMed] [Google Scholar]
- 11.Moreno-Lopez L, Soriano-Mas C, Delgado-Rico E, Rio-Valle JS, Verdejo-Garcia A. Brain structural correlates of reward sensitivity and impulsivity in adolescents with normal and excess weight. PLoS One. 2012;7:e49185. doi: 10.1371/journal.pone.0049185. [DOI] [PMC free article] [PubMed] [Google Scholar]
- 12.Thamotharan S, Lange K, Zale EL, Huffhines L, Fields S. The role of impulsivity in pediatric obesity and weight status: a meta-analytic review. Clin Psychol Rev. 2013;33:253–262. doi: 10.1016/j.cpr.2012.12.001. [DOI] [PubMed] [Google Scholar]
- 13.Yau PL, Javier DC, Ryan CM, Tsui WH, Ardekani BA, Ten S, et al. Preliminary evidence for brain complications in obese adolescents with type 2 diabetes mellitus. Diabetologia. 2010;53:2298–2306. doi: 10.1007/s00125-010-1857-y. [DOI] [PMC free article] [PubMed] [Google Scholar]
- 14.Bruehl H, Sweat V, Tirsi A, Shah B, Convit A. Obese Adolescents with type 2 diabetes mellitus have hippocampal and frontal lobe volume reductions. Neurosci Med. 2011;2:34–42. doi: 10.4236/nm.2011.21005. [DOI] [PMC free article] [PubMed] [Google Scholar]
- 15.Yau PL, Castro MG, Tagani A, Tsui WH, Convit A. Obesity and metabolic syndrome and functional and structural brain impairments in adolescence. Pediatrics. 2012;130:e856–864. doi: 10.1542/peds.2012-0324. [DOI] [PMC free article] [PubMed] [Google Scholar]
- 16.Maayan L, Hoogendoorn C, Sweat V, Convit A. Disinhibited eating in obese adolescents is associated with orbitofrontal volume reductions and executive dysfunction. Obesity (Silver Spring) 2011;19:1382–1387. doi: 10.1038/oby.2011.15. [DOI] [PMC free article] [PubMed] [Google Scholar]
- 17.Davids S, Lauffer H, Thoms K, Jagdhuhn M, Hirschfeld H, Domin M, et al. Increased dorsolateral prefrontal cortex activation in obese children during observation of food stimuli. Int J Obes. 2010;34:94–104. doi: 10.1038/ijo.2009.193. [DOI] [PubMed] [Google Scholar]
- 18.Centers for Disease Control and Prevention. BMI for children and teens. 2009 Retrieved August 10, 2009, from http://www.cdc.gov/healthyweight/assessing/bmi/childrens_bmi/about_childrens_bmi.html.
- 19.National High Blood Pressure Education Program Working Group on High Blood Pressure in Children and Adolescents. The fourth report on the diagnosis, evaluation, and treatment of high blood pressure in children and adolescents. Pediatrics. 2004;114(2 suppl 4th report):555–576. [PubMed] [Google Scholar]
- 20.Turchiano M, Sweat V, Fierman A, Convit A. Obesity, metabolic syndrome, and insulin resistance in urban high school students of minority race/ethnicity. Arch Pediatr Adolesc Med. 2012:1–7. doi: 10.1001/archpediatrics.2012.1263. [DOI] [PMC free article] [PubMed] [Google Scholar]
- 21.Lezak MD, Howieson DB, Loring DW. Neuropsychological Assessment. Oxford University Press; New York: 2004. [Google Scholar]
- 22.Mindell JA, Owens JA. A clinical guide to pediatric sleep: Diagnosis and management of sleep problems. Lippincott Williams & Wilkins; Philadelphia: 2003. [Google Scholar]
- 23.Macey PM, Kumar R, Woo MA, Valladares EM, Yan-Go FL, Harper RM. Brain structural changes in obstructive sleep apnea. Sleep. 2008;31:967–977. [PMC free article] [PubMed] [Google Scholar]
- 24.Gozal D, Kheirandish-Gozal L. Neurocognitive and behavioral morbidity in children with sleep disorders. Curr Opin Pulm Med. 2007;13:505–509. doi: 10.1097/MCP.0b013e3282ef6880. [DOI] [PubMed] [Google Scholar]
- 25.Beck A, Steer RA, Brown GK. Manual for Beck Depression Inventory-II. Psychological Corporation; San Antonio, TX: 1996. [Google Scholar]
- 26.Craig CL, Marshall AL, Sjostrom M, Bauman AE, Booth ML, Ainsworth BE, et al. International physical activity questionnaire: 12-country reliability and validity. Med Sci Sports Exerc. 2003;35:1381–1395. doi: 10.1249/01.MSS.0000078924.61453.FB. [DOI] [PubMed] [Google Scholar]
- 27.Convit A, de Leon MJ, Tarshish C, De Santi S, Tsui W, Rusinek H, et al. Specific hippocampal volume reductions in individuals at risk for Alzheimer’s disease. Neurobiol Aging. 1997;18:131–138. doi: 10.1016/s0197-4580(97)00001-8. [DOI] [PubMed] [Google Scholar]
- 28.Convit A, Wolf OT, de Leon MJ, Patalinjug M, Kandil E, Cardebat D, et al. Volumetric analysis of the pre-frontal regions: findings in aging and schizophrenia. Psychiatry Res. 2001;107:61–73. doi: 10.1016/s0925-4927(01)00097-x. [DOI] [PubMed] [Google Scholar]
- 29.Fischl B, Liu A, Dale AM. Automated manifold surgery: constructing geometrically accurate and topologically correct models of the human cerebral cortex. IEEE Trans Med Imaging. 2001;20:70–80. doi: 10.1109/42.906426. [DOI] [PubMed] [Google Scholar]
- 30.Fischl B, Sereno MI, Dale AM. Cortical surface-based analysis. II: Inflation, flattening, and a surface-based coordinate system. Neuroimage. 1999;9:195–207. doi: 10.1006/nimg.1998.0396. [DOI] [PubMed] [Google Scholar]
- 31.Fischl B, Salat DH, van der Kouwe A, Makris N, Segonne F, Quinn BT, et al. Sequence-independent segmentation of magnetic resonance images. Neuroimage. 2004;23:S69–84. doi: 10.1016/j.neuroimage.2004.07.016. [DOI] [PubMed] [Google Scholar]
- 32.Ardekani BA, Guckemus S, Bachman A, Hoptman MJ, Wojtaszek M, Nierenberg J. Quantitative comparison of algorithms for inter-subject registration of 3D volumetric brain MRI scans. J Neurosci Methods. 2005;142:67–76. doi: 10.1016/j.jneumeth.2004.07.014. [DOI] [PubMed] [Google Scholar]
- 33.Yau PL, Javier D, Tsui W, Sweat V, Bruehl H, Borod JC, et al. Emotional and neutral declarative memory impairments and associated white matter microstructural abnormalities in adults with type 2 diabetes. Psychiatry Res. 2009;174:223–230. doi: 10.1016/j.pscychresns.2009.04.016. [DOI] [PMC free article] [PubMed] [Google Scholar]
- 34.Maayan LHC, Sweat V, Convit A. Disinhibited eating in obese adolescents is associated with orbitofrontal volume reductions and executive dysfunction. Obesity. 2011 doi: 10.1038/oby.2011.15. In Press. [DOI] [PMC free article] [PubMed] [Google Scholar]
- 35.Widjaja E, Zarei Mahmoodabadi S, Go C, Raybaud C, Chuang S, Snead OC, et al. Reduced cortical thickness in children with new-onset seizures. AJNR Am J Neuroradiol. 2012;33:673–677. doi: 10.3174/ajnr.A2982. [DOI] [PMC free article] [PubMed] [Google Scholar]
- 36.Nummenmaa L, Hirvonen J, Hannukainen JC, Immonen H, Lindroos MM, Salminen P, et al. Dorsal striatum and its limbic connectivity mediate abnormal anticipatory reward processing in obesity. PLoS One. 2012;7:e31089. doi: 10.1371/journal.pone.0031089. [DOI] [PMC free article] [PubMed] [Google Scholar]
- 37.Huang K, Zou CC, Yang XZ, Chen XQ, Liang L. Carotid intima-media thickness and serum endothelial marker levels in obese children with metabolic syndrome. Arch Pediatr Adolesc Med. 2010;164:846–851. doi: 10.1001/archpediatrics.2010.160. [DOI] [PubMed] [Google Scholar]
- 38.Iannuzzi A, Licenziati MR, Acampora C, Renis M, Agrusta M, Romano L, et al. Carotid artery stiffness in obese children with the metabolic syndrome. Am J Cardiol. 2006;97:528–531. doi: 10.1016/j.amjcard.2005.08.072. [DOI] [PubMed] [Google Scholar]
- 39.Montero D, Walther G, Perez-Martin A, Roche E, Vinet A. Endothelial dysfunction, inflammation, and oxidative stress in obese children and adolescents: markers and effect of lifestyle intervention. Obes Rev. 2012;13:441–455. doi: 10.1111/j.1467-789X.2011.00956.x. [DOI] [PubMed] [Google Scholar]
- 40.Convit A. Links between cognitive impairment in insulin resistance: An explanatory model. Neurobiol Aging. 2005;26:31–35. doi: 10.1016/j.neurobiolaging.2005.09.018. [DOI] [PubMed] [Google Scholar]