

Abstract
Background
The kidney can increase glomerular filtration rate (GFR) in response to a protein load (renal reserve). In a pilot study of healthy young adults we examined renal reserve using changes in serum cystatin C (cysC).
Methods
Glomerular filtration rate was obtained using iohexol single slope plasma disappearance. To stimulate GFR, subjects ingested a beefburger containing 60 grams of protein. CysC was measured by immunonephelometry before and 125–141 minutes after protein loading.
Results
All subjects were found to have a normal iohexol plasma disappearance GFR with a mean of 104.6 ± 9.9 mL/min per 1.73 m2. CysC decreased in each subject after the meat meal. Baseline cysC-based estimated GFR was 98.1 ± 9.1 mL/min per 1.73 m2 with a mean increase of 12.0 ± 5.2 (p = 0.0003).
Conclusions
Our study showed a consistent decrease in serum cysC and increase in cysC-based estimated GFR following a protein load in young adults. Further studies are needed using renal clearance methods to confirm that cysC accurately determines renal reserve in patients with and without chronic kidney disease.
Keywords: Chronic kidney disease, clearance, creatinine, cystatin C, estimated GFR, glomerular filtration rate
Introduction
The concept of a renal reserve refers to the normal kidney’s ability to increase its filtration rate in response to a stimulus such as a protein load. As a consequence of acute renal injury, a kidney may be operating at its maximal filtration capacity at baseline and, therefore, have no residual nephrons available to increase the glomerular filtration rate (GFR) in response to a protein load [1]. These individuals may have a normal serum creatinine, urinalysis, blood pressure, and GFR, but a decreased renal reserve. A lack of renal reserve may indicate a poor long-term renal prognosis. Studies have shown a maximal increase in GFR to occur anywhere from 20–150 minutes after a meat meal [1,2]. The published values of renal reserve are highly variable with studies showing increases in GFR after a protein meal ranging from 10–81% [1–4].
There are no published studies on the use of cystatin C for the determination of renal reserve. The majority of studies on renal reserve have used renal inulin or creatinine clearances for measuring GFR. The use of inulin in determining GFR necessitates continuous infusions of inulin along with the collection of timed urine samples by a bladder catheter making this approach undesirable for use in determining GFR, especially in children [5]. Cystatin C is a small molecular weight protein that is freely filtered by the kidneys and produced at a relatively constant rate [6]. The production of cystatin C is thought to be independent of muscle mass, sex, body composition, inflammatory conditions and age [7,8]. Due in part to the shorter half-life of cystatin C, subtle changes in GFR are more readily detected by changes in cystatin C than by serum creatinine [9]. Schwartz et al. [10] developed a univariate cystatin C-based GFR estimating equation for which the correlation of the estimated GFR with GFR determined by iohexol plasma disappearance (iGFR) was 0.85. Given that cystatin C has been found to be a rapidly responsive renal biomarker, it may be a useful measure for the detection of renal reserve.
Our aim was to determine if there is a significant change in cystatin C-based GFR, measured before and after a protein load, as a determinant of renal reserve in a group of healthy young adults.
Subjects and methods
Study population
The six subjects were between the ages of 18 and 25 with no known history of kidney disease or hypertension. Each subject was given instructions for adherence to a low protein diet the night before the study and a low protein liquid diet thereafter until the time of the study. Subjects were sent a container for a first morning urine collection for microalbumin and creatinine. The University of Rochester Institutional Review Board approved the study protocol.
Study design
The study was conducted at the Clinical Research Center at the University of Rochester as previously published [10,11]. Vital signs including blood pressure were obtained to confirm normotension, and subjects were asked to drink 10 mL/kg of water or juice. Ingestion of fluids was encouraged throughout the study in order to limit volume-mediated decreases in GFR. A pregnancy test was confirmed to be negative in all females. Four subjects were female. An IV was inserted into one arm for blood sampling. Sera were obtained for an iohexol blank, a basic metabolic panel and cystatin C. The basic metabolic panel and urine microalbumin were measured on a Roche/Hitachi Modular Analyzer at the University of Rochester Medical Center. Through a second IV line 10 mL of iohexol (Omnipaque 300, corresponding to 647 mg iohexol per mL or 300 mg iodine per mL) was given over 1–2 min via a pre weighed filled syringe. The empty syringe was then weighed again on the same scale after administration of the iohexol. Vital signs were obtained 10 min after the administration of iohexol. Blood was obtained at 120, 180 and 240 min after injection to determine a baseline GFR. GFR was determined from the dose of iohexol and the area under the curve using the one compartment model log-linear disappearance as a function of time [11,12]. All GFR measurements were corrected to 1.73 m2 BSA.
Iohexol concentrations were measured by HPLC and GFR values were determined by the authors (DYF and GJS). Inter-assay coefficients of variation of 30 separate runs of quality control iohexol samples was 5.8% at a level of 12.1 mg/L and 3.0% at 117 mg/L. The intra-assay coefficients of variation obtained from spiked iohexol samples at two levels, six injections per level, on three different days averaged 1.95% at 14.77 mg/L and 1.23% at 99.25 mg/L. The limit of quantification was 2 mg/L. Cystatin C was measured by immunonephelometry using a BN II analyzer (Siemens Diagnostics, Tarrytown, NY, USA), as previously described [10]. Specifically, the assay was performed with a six-point calibration generated from multiple dilutions of a cystatin C calibrator obtained from human urine. Each run included 1–2 sera of known cystatin C concentration to rule out drift of the assay. Each run of serum samples was preceded by measurement of quality controls of low (1.06 mg/L) and high (1.93 mg/L) cystatin C concentrations, and the runs were not performed until the quality controls differed by less than 6% at the onset of the assay. The assay range was 0.195–7.330 mg/L and the inter-assay coefficient of variation was 2.3–3.1%.
Subjects ate a beefburger containing 60 grams of protein. A second sample of blood for cystatin C was taken 125–141 min after the protein load (see Table I). GFR was estimated from cystatin C using the equation eGFR = 70.69*(cystatin C)−0.931 [10] before and after the protein load.
Table I.
Iohexol GFR and cystatin C-based GFR before and after the protein load.
| RR# | Age (y) | Serum creatinine μmol/L | Urine Microalbumin/ creatinine (μg/mg) | Iohexol GFR (mL/min per 1.73 m 2) | Time (min) | Baseline eGFR (mL/min per 1.73 m 2) | Post eGFR (mL/min per 1.73 m 2) |
|---|---|---|---|---|---|---|---|
| 101b | 25 | 79.56 | 2.3 | 88.6 | 130 | 91.3 | 108.7 |
| 102b | 21 | 53.04 | 5.9 | 92.3 | 125 | 96.0 | 112.0 |
| 108a | 18 | 67.18 | 3.3 | 114.7 | 138 | 94.8 | 102.6 |
| 108b | 19 | 67.84 | 3.7 | 110.2 | 138 | 104.1 | 110.3 |
| 108c | 21 | 80.44 | 1.4 | 111.8 | 140 | 86.0 | 104.1 |
| 109 | 25 | 86.63 | 1.6 | 98.9 | 141 | 94.7 | 110.3 |
| 111 | 23 | 67.18 | 9.2 | 111.7 | 138 | 115.5 | 121.3 |
| 112 | 21 | 68.95 | 3.7 | 108.7 | 135 | 102.6 | 112.0 |
| Mean ± SD | 69.12 ± 13.75 | 3.9 ± 2.6 | 104.6 ± 9.9 | 135 ± 5.5 | 98.1 ± 9.1 | 110.1 ± 5.7 |
RR#, Renal reserve subject number. Serum creatinine (normal = 26.52–88.4 μmol/L), urine microalbumin/creatinine (normal = 0–29.9 μg/mg), Iohexol obtained GFR. Time = time from completion of the beefburger to the measurement of cystatin C (minutes) and cystatin C-based GFR in eight studies in six subjects.
Statistics
Continuous variables are reported as mean ± standard deviation. The data were found to be normally distributed based on the Shapiro-Wilk and Kolmogorov-Smirnov tests of normality. Comparison of estimated GFRs as measured cystatin C before and after a protein load were performed by paired t-test. Renal reserve was defined as the difference between the cystatin C-based GFR before and after the protein load. The analysis was run using SAS 9.3. A p value < 0.05 was considered significant.
Results
The six subjects were between the ages of 18–25 and were found to be normal in terms of GFR obtained by iohexol (Table I). Also, all subjects had a normal serum creatinine as well as urine microalbumin/creatinine ratio. There were no adverse reactions to iohexol administration.
In eight studies, subjects ate the 60 gram protein-containing beefburger. The mean GFR obtained by iohexol plasma disappearance was 104.6 mL/min per 1.73 m2. The average baseline cystatin C-based GFR was 98.1 ± 9.1 mL/min per 1.73m2 with a mean increase in GFR of 12.0 ± 5.2 (p = 0.0003) after eating the beefburger. All eight studies showed a decrease in serum cystatin C and an increase in cystatin C-based GFR after the protein load (Table I and Figure 1). One subject (RR108) participated in the study three times with study visits separated by 3 months and 31 months, respectively. When this subject was accounted for once in the analysis (total of six subject visits), the mean baseline cystatin C-based GFR was 99.2 ± 8.8 mL/min per 1.73 m2 with the mean increase in cystatin C-based GFR of 12.0 ± 4.9 (p = 0.0019).
Figure 1.
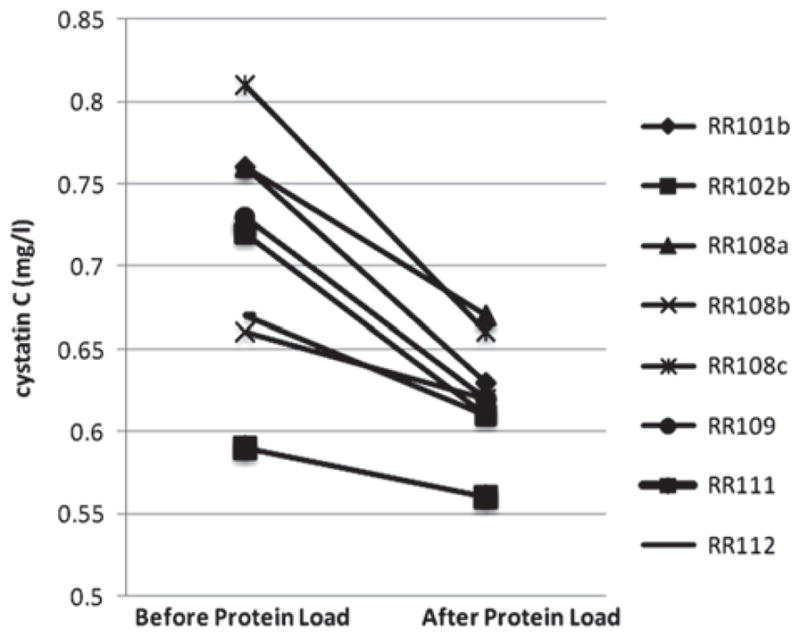
Serum cystatin C concentrations before and after ingestion of a beefburger containing 60 grams of protein.
Cystatin C-based GFR values were obtained using additional published equations (Table II). The four equations presented are of different forms but based on studies that used the particle-enhanced nephelometric immunoassay to determine cystatin C concentrations. Renal reserve was comparably demonstrated using each of these equations.
Table II.
Estimated GFR using univariate cystatin C prediction equations.
| Cystatin C-based GFR equation | Filler and Lepage [13] 91.62 × (1/cysC) 1.123 | Hoek et al. [14] − 4.32 + (80.35/ cysC) | Le Bricon et al. [15] (78/cysC) + 4 | Zappitelli et al. [16] (75.94* cysC) −1.17 | Overall mean ± SD |
|---|---|---|---|---|---|
| RR 101b | |||||
| Baseline eGFR | 124.69 | 101.40 | 106.63 | 104.69 | 109.35 ± 10.45 |
| Post eGFR | 153.93 | 123.22 | 127.81 | 130.39 | 133.84 ± 13.72 |
| Renal reserve | 29.24 | 21.82 | 21.18 | 25.70 | 24.49 ± 3.75 |
| RR 102b | |||||
| Baseline eGFR | 132.50 | 107.28 | 112.33 | 111.53 | 115.91 ± 11.28 |
| Post eGFR | 159.62 | 127.40 | 131.87 | 135.40 | 138.58 ± 14.41 |
| Renal reserve | 21.11 | 20.12 | 19.54 | 23.88 | 21.16 ± 1.92 |
| RR108a | |||||
| Baseline eGFR | 124.69 | 101.40 | 106.63 | 104.69 | 109.35 ± 10.45 |
| Post eGFR | 143.65 | 115.61 | 120.42 | 121.33 | 125.25 ± 12.52 |
| Renal reserve | 18.96 | 14.20 | 13.79 | 16.64 | 15.90 ± 2.40 |
| RR108b | |||||
| Baseline eGFR | 146.10 | 117.42 | 122.18 | 123.48 | 127.30 ± 12.80 |
| Post eGFR | 156.72 | 125.28 | 129.81 | 132.85 | 136.17 ± 14.05 |
| Renal reserve | 10.63 | 7.85 | 7.62 | 9.37 | 8.87 ± 1.41 |
| RR108c | |||||
| Baseline eGFR | 116.08 | 94.88 | 100.30 | 97.17 | 102.11 ± 9.58 |
| Post eGFR | 146.10 | 117.42 | 122.18 | 123.48 | 127.30 ± 12.80 |
| Renal reserve | 30.02 | 22.54 | 21.89 | 26.31 | 25.19 ± 3.76 |
| RR109 | |||||
| Baseline eGFR | 130.46 | 105.75 | 110.85 | 109.74 | 114.20 ± 11.06 |
| Post eGFR | 156.72 | 125.28 | 129.81 | 132.85 | 136.17 ± 14.05 |
| Renal reserve | 26.26 | 19.53 | 18.96 | 23.12 | 21.97 ± 3.40 |
| RR111 | |||||
| Baseline eGFR | 165.70 | 131.87 | 136.20 | 140.79 | 143.64 ± 15.15 |
| Post eGFR | 175.70 | 139.16 | 143.29 | 149.65 | 151.95 ± 16.41 |
| Renal reserve | 10.00 | 7.30 | 7.08 | 8.86 | 8.31 ± 1.38 |
| RR112 | |||||
| Baseline eGFR | 143.65 | 115.61 | 120.42 | 121.33 | 125.25 ± 12.52 |
| Post eGFR | 159.61 | 127.40 | 131.87 | 135.40 | 138.57 ± 14.40 |
| Renal reserve | 15.96 | 11.80 | 11.45 | 14.08 | 13.32 ± 2.11 |
| Overall mean baseline | 135.48 ± 15.75 | 109.45 ± 11.74 | 114.44 ± 11.39 | 114.18 ± 13.85 | |
| eGFR ± SD | |||||
| Overall mean post | 156.51 ± 9.77 | 125.1 0 ± 7.18 | 129.63 ± 6.97 | 132.67 ± 8.63 | |
| eGFR ± SD | |||||
Estimated glomerular filtration rate (mL/min per 1.73 mL/min per 1.73 m2) before and after a 60-gram beefburger protein load.
Discussion
In caring for patients after recovery from acute kidney injury, clinicians will commonly refer to a loss or decrease in renal reserve filtration capacity. However, there is currently no easily obtainable means to measure changes in renal reserve and potentially predict which patients may be at risk for early chronic kidney disease. A loss of renal reserve may predispose patients to chronic kidney disease with its associated cardiovascular complications. Prior to evaluating the presence of renal reserve in patients after acute kidney injury, there is a need to establish a valid, reliable, rapid, and easily replicated measure of renal reserve in individuals with no history of renal disease.
Previous studies on renal reserve have used creatinine clearance and renal inulin clearance methodology. Our findings suggest that measurement of serum cystatin C before and after a protein meal may be a convenient and rapid determinant of renal reserve. These findings are consistent with the observation that cystatin C has a relatively short half-life with levels that respond more rapidly to acute changes in GFR than does serum creatinine [9] or iohexol plasma disappearance curves (data not shown).
Further studies should be carried out comparing renal clearance methods to cystatin C-based GFR estimates for measuring renal reserve in healthy young adults. Comparison of changes in iGFR and cystatin C-based GFR after meat protein loading should help establish if cystatin C can serve as a surrogate measure of renal reserve.
Acknowledgments
We are grateful to GE Healthcare, Amersham Division, for providing the iohexol (Omnipaque™ 300 for the baseline GFR measurements. The content is solely the responsibility of the authors and does not necessarily represent the official views of the National Institutes of Health.
This study was supported in part by a grant from the National Kidney Foundation (D.Y.F.) as well as from the National Institutes of Health T32 Training Grant (T32HD057821). The project described in this publication was also supported by the University of Rochester CTSA award numbers UL1 RR024160 and UL1 TR000042 from the National Center for Research Resources and the National Center for Advancing Translational Sciences of the National Institutes of Health.
Footnotes
Declaration of interest: The authors report no conflict of interest. The authors alone are responsible for the content and writing of the article.
References
- 1.Bosch JP, Saccaggi A, Lauer A, Ronco C, Belledonne M, Glabman S. Renal functional reserve in humans. Effect of protein intake on glomerular filtration rate. Am J Med. 1983;75:943–50. doi: 10.1016/0002-9343(83)90873-2. [DOI] [PubMed] [Google Scholar]
- 2.Solling K, Christensen CK, Solling J, Christiansen JS, Mogensen CE. Effect on renal haemodynamics, glomerular filtration rate and albumin excretion of high oral protein load. Scand J Clin Lab Invest. 1986;46:351–7. doi: 10.3109/00365518609083682. [DOI] [PubMed] [Google Scholar]
- 3.Rodriguez-Iturbe B, Herrera J, Garcia R. Relationship between glomerular filtration rate and renal blood flow at different levels of protein-induced hyperfiltration in man. Clin Sci (Lond) 1988;74:11–5. doi: 10.1042/cs0740011. [DOI] [PubMed] [Google Scholar]
- 4.Hostetter TH. Human renal response to meat meal. Am J Physiol. 1986;250:F613–8. doi: 10.1152/ajprenal.1986.250.4.F613. [DOI] [PubMed] [Google Scholar]
- 5.Schwartz GJ, Work DF. Measurement and estimation of GFR in children and adolescents. Clin J Am Soc Nephrol. 2009;4:1832–43. doi: 10.2215/CJN.01640309. [DOI] [PubMed] [Google Scholar]
- 6.Newman DJ. Cystatin C. Ann Clin Biochem. 2002;39:89–104. doi: 10.1258/0004563021901847. [DOI] [PubMed] [Google Scholar]
- 7.Finney H, Newman DJ, Thakkar H, Fell JM, Price CP. Reference ranges for plasma cystatin C and creatinine measurements in premature infants, neonates, and older children. Arch Dis Child. 2000;82:71–5. doi: 10.1136/adc.82.1.71. [DOI] [PMC free article] [PubMed] [Google Scholar]
- 8.Bokenkamp A, Domanetzki M, Zinck R, Schumann G, Brodehl J. Reference values for cystatin C serum concentrations in children. Pediatr Nephrol. 1998;12:125–9. doi: 10.1007/s004670050419. [DOI] [PubMed] [Google Scholar]
- 9.Dworkin LD. Serum cystatin C as a marker of glomerular filtration rate. Curr Opin Nephrol Hypertens. 2001;10:551–3. doi: 10.1097/00041552-200109000-00001. [DOI] [PubMed] [Google Scholar]
- 10.Schwartz GJ, Schneider MF, Maier PS, Moxey-Mims M, Dharnidharka VR, Warady BA, Furth SL, Munoz A. Improved equations estimating GFR in children with chronic kidney disease using an immunonephelometric determination of cystatin C. Kidney Int. 2012;82:445–453. doi: 10.1038/ki.2012.169. [DOI] [PMC free article] [PubMed] [Google Scholar]
- 11.Schwartz GJ, Abraham AG, Furth SL, Warady BA, Munoz A. Optimizing iohexol plasma disappearance curves to measure the glomerular filtration rate in children with chronic kidney disease. Kidney Int. 2010;77:65–71. doi: 10.1038/ki.2009.398. [DOI] [PMC free article] [PubMed] [Google Scholar]
- 12.Ng DK, Schwartz GJ, Jacobson LP, Palella FJ, Margolick JB, Warady BA, Furth SL, Munoz A. Universal GFR determination based on two time points during plasma iohexol disappearance. Kidney Int. 2011;80:423–30. doi: 10.1038/ki.2011.155. [DOI] [PMC free article] [PubMed] [Google Scholar]
- 13.Filler G, Lepage N. Should the Schwartz formula for estimation of GFR be replaced by cystatin C formula? Pediatr Nephrol. 2003;18:981–5. doi: 10.1007/s00467-003-1271-5. [DOI] [PubMed] [Google Scholar]
- 14.Hoek FJ, Kemperman FA, Krediet RT. A comparison between cystatin C, plasma creatinine and the Cockcroft and Gault formula for the estimation of glomerular filtration rate. Nephrol Dial Transplant. 2003;18:2024–31. doi: 10.1093/ndt/gfg349. [DOI] [PubMed] [Google Scholar]
- 15.Le Bricon T, Thervet E, Froissart M, Benlakehal M, Bousquet B, Legendre C, Erlich D. Plasma cystatin C is superior to 24-h creatinine clearance and plasma creatinine for estimation of glomerular filtration rate 3 months after kidney transplantation. Clin Chem. 2000;46:1206–7. [PubMed] [Google Scholar]
- 16.Zappitelli M, Parvex P, Joseph L, Paradis G, Grey V, Lau S, Bell L. Derivation and validation of cystatin C-based prediction equations for GFR in children. Am J Kidney Dis. 2006;48:221–30. doi: 10.1053/j.ajkd.2006.04.085. [DOI] [PubMed] [Google Scholar]