

Abstract
Although regular exercise is associated with reduced cardiometabolic disease risk among overweight adults, it remains unclear whether much of the health benefits of exercise are derived from the most recent session(s) of exercise or if they are the result of adaptations stemming from weeks, months, or even years of training. The purpose of this study was to compare the effects of habitual and acute exercise on key markers of cardiometabolic disease risk in overweight adults. We compared insulin sensitivity index (ISI) using an oral glucose tolerance test, blood pressure (BP), blood lipids, and systemic inflammatory cytokines in 12 overweight to mildly obese adults (BMI: 27–34 kg/m2) who exercise regularly (EX; >2.5 h exercise per week) with a well-matched cohort of 12 nonexercisers (Non-EX). Baseline measurements in EX were performed exactly 3 days after exercise, whereas Non-EX remained sedentary. We repeated these measurements the day after a session of exercise in both groups. At baseline, ISI was significantly greater in EX versus Non-EX (3.1 ± 0.2 vs. 2.3 ± 0.2; p = 0.02), but BP, blood lipids, and plasma concentration of the systemic inflammatory cytokines we measured were not different between groups. Acute exercise increased ISI the next morning in Non-EX (2.3 ± 0.2 vs. 2.8 ± 0.3; p = 0.03) but not EX. As a result, ISI was similar between groups the morning after exercise. In summary, exercising regularly was accompanied by a persistent improvement in insulin sensitivity that lasted at least 3 days after exercise in overweight adults, but just one session of exercise increased insulin sensitivity among sedentary overweight adults to levels equivalent to the regular exercisers.
Keywords: exercise training, physical activity, obesity, inflammation, cytokines
Introduction
Along with the rise in obesity prevalence (Flegal et al. 2012), the incidence of obesity-related cardiometabolic complications including insulin resistance, dyslipidemia, and hypertension are rising in parallel (Rodbard et al. 2012; Tattersall et al. 2013). Although modest weight loss (5%–10% of initial body weight) has been found to reduce cardiometabolic disease risk (Klein et al. 2004), even this very modest weight loss can be very difficult to both achieve and sustain (Douketis et al. 2005). Additionally, physical activity or exercise has been highlighted as an important therapeutic tool for reducing cardiometabolic disease risk among overweight and obese adults (Colberg et al. 2010). Although regular exercise has been identified as a very important factor in delaying and (or) preventing cardiometabolic disease risk, the factors underlying the health improvements associated with exercise are still not well understood, particularly in overweight and obese adults.
A physically active lifestyle is commonly associated with a lower incidence of cardiometabolic diseases (Ekblom-Bak et al. 2010). However, the effects of exercise on cardiometabolic risk factors (e.g., insulin resistance, hypertension) are often found to be transient, dissipating after only a few days (or less) without exercise (Oshida et al. 1991; King et al. 1995). Additionally, a single session of exercise is often found to improve insulin resistance as well as improve blood lipid profile and lower blood pressure in people who do not exercise regularly (Devlin and Horton. 1985; Quinn 2000). Therefore, although regular exercise is clearly an important contributor to long-term health and disease prevention, it remains unclear how much of these health benefits stem from the acute effects of the most recent session(s) of exercise and how much can be attributed to physiologic adaptations accrued as a result of habitual exercise. The aims of this study were to compare key markers of cardiometabolic disease risk in overweight adults who exercise regularly with a well-matched cohort of overweight adults who do not exercise and to assess the metabolic impact of a single session of exercise in these groups.
Materials and methods
Subjects
A total of 24 overweight to mildly obese (body mass index (BMI): 27–34 kg/m2) men (n = 10) and women (n = 14) participated in this study. Twelve subjects (male/female: 5/7) were classified as regular “Exercisers” (EX; >2.5 h of planned endurance-type exercise per week), whereas 12 subjects (male/female: 5/7) were classified as “Non-exercisers” (Non-EX; no planned exercise). Subjects had no history of metabolic or cardiovascular disease and were weight stable (i.e., ±2 kg for ≥6 months). Participants were not taking any medications (with the exception of oral contraceptives for some female subjects). Female participants were tested during the follicular phase of their menstrual cycle based on the onset of their last reported menses. Written informed consent was obtained from all subjects prior to participation. All procedures were approved by the University of Michigan Institutional Review Board.
Preliminary testing
Participants completed a physical activity questionnaire to classify them as either EX (≥2.5 h of moderate to vigorous exercise per week for >6 months) or Non-EX (no planned exercise). Within at least 1 month of the experimental protocol, participants completed a sub-maximal exercise test to predict maximal oxygen consumption (V̇O2max) (Faulkner et al. 2007), and we measured each subject’s body composition using hydrostatic weighing technique (Clasey et al. 1999).
Experimental protocol
All subjects participated in a 2-day experimental trial performed on consecutive days (Fig. 1). Subjects in the EX group abstained from their normal exercise routine exactly 3 days before Day 1 of the experimental trial. All participants wore a pedometer (New Lifestyles, Lee’s Summit, MO) on the day before the experiment and were instructed to remain relatively sedentary by completing <5000 steps. Participants also wore an ambulatory blood pressure monitor (A&D Company, Tokyo, Japan) to assess blood pressure every 30 min between 1400 and 2200 h during the afternoon and evening before the experiment.
Fig. 1.
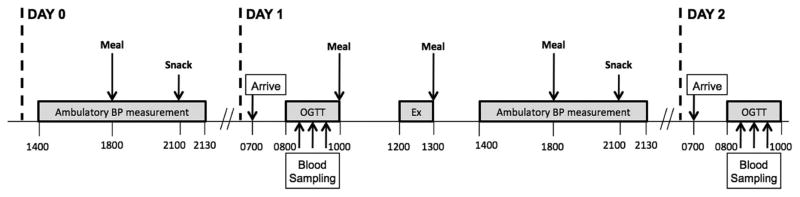
Timeline of experimental events.
On Day 1 of the experiment, subjects came to the laboratory at 0700 h, after an overnight fast. After resting quietly for 30 min, resting blood pressure was measured. We then placed an intravenous catheter in an arm vein and collected a baseline blood sample. We then performed a 2-h oral glucose tolerance test (OGTT) with a 75 g glucose load (Glucose Tolerance Test Beverage, Fisher Scientific). At noon, participants performed a session of exercise on a treadmill for 1 h at an intensity eliciting 70% of their age-predicted maximal heart rate. Subjects were then fed a standardized meal and were discharged from the laboratory with a pedometer and ambulatory blood pressure monitor, which they wore for the remainder of the day. Subjects were again required to remain relatively sedentary (<5000 steps per day). They returned to the laboratory at 0700 h the next morning (Day 2) after an overnight fast – at which time we again measured their resting blood pressure, collected a baseline blood sample, and performed another 2-h OGTT to determine the responses the day after a single session of exercise in both cohorts. Importantly, a weight maintaining, energy-balanced diet was provided throughout the 2-day experimental trial.
Study diets
Diets were designed to maintain “energy balance” (i.e., energy intake = energy expenditure) to avoid the confounding influence of a negative energy balance on insulin sensitivity (Assali et al. 2001). In the evening before the experiment, the total energy content of the standardized dinner and snack were approximately 30% and 10% of estimated daily energy expenditure, which was assessed using calculations from Cunningham (1991). To maintain energy balance on Day 1 of the experiment, we estimated the amount of energy expended during the exercise session and energy intake was provided to match this calculated energy expenditure. Breakfast (including the OGTT), lunch, and dinner on Day 1 each contained approximately 30% of participants’ estimated daily energy expenditure, and the evening snack contained approximately 10% of the estimated daily energy expenditure. The macronutrient composition of meals and snacks was: 55% carbohydrate, 30% fat, and 15% protein.
Analytical procedures
Plasma substrate and hormone concentrations
Blood samples were collected in chilled EDTA tubes, centrifuged (1600 g for 20 min. at 4 °C) within 30 min of collection and then stored at −80 °C until analysis. Plasma concentrations of glucose (glucose oxidase assay; Thermo Fisher Scientific, Waltham, MO), triglyceride (Triglyceride Reagent; Sigma Adrich, St. Louis, MO), total- and high-density lipoprotein (HDL; Cholesterol E and HDL-Cholesterol E; WAKO Life Sciences, Inc., Richmond, VA) were measured using commercially available colorimetric assay kits. Plasma insulin concentration was measured using a radioimmunoassay (Human insulin RIA kit; EMD Millipore, Billerica, MA). Plasma markers of systemic inflammation (i.e., tumor necrosis factor-alpha (TNF-α), interleukin (IL)-6, IL-1β, and monocyte chemotactic protein-1 (MCP-1)) were measured using commercially available Multiplex magnetic bead kits (EMD Millipore) and the Luminex L200 instrument (Luminex, Austin, TX, USA). Data from the Multiplex bead kits were quantified using xPONENT software (Luminex). Concentration of systemic inflammatory markers was below detectable limits for 4 samples from each cohort (i.e., EX and Non-EX). Therefore, inflammatory data presented in the results section reflects n = 8 for both groups.
Calculations
Index of whole body insulin sensitivity
Plasma glucose and insulin concentrations measured immediately before and during the OGTT were used to calculate the insulin sensitivity index (ISI) using the Matsuda Composite Index (Matsuda and DeFronzo 1999).
We also calculated whole-body insulin resistance using the Homeostatic Model Assessment of Insulin Resistance (HOMA-IR), which provided a supplementary index of insulin action in our subjects (Matsuda and DeFronzo 1999).
Low-density lipoprotein cholesterol concentration (LDL-C)
Plasma LDL-C was calculated from measurements of plasma concentrations of total cholesterol (Total-C), HDL-C, and triglyceride
Percent body fat
Body volume and density were assessed by hydrostatic weighing technique and the Siri equation was used to determine body fat percentage (Clasey et al. 1999).
Statistical analysis
Student’s t tests were used to compare baseline characteristics between participants in our EX and Non-EX cohorts. A 2-way ANOVA with 1 factor repeating (group × day) with Tukey post-hoc analysis was used to assess significant differences in insulin sensitivity, blood pressure, blood lipids, and markers of systemic inflammation between cohorts and in response to the single session of exercise. A p value of ≤0.05 was considered statistically significant.
Results
Subject characteristics and intensity during the experimental exercise session
As designed, subjects in our EX and Non-EX cohorts were very well matched for body weight, BMI, and body composition (Table 1). Also as designed there was a great disparity in the planned exercise between the groups. Although our Non-EX subjects reported no planned exercise our EX group averaged >32 metabolic equivalent (MET) hours per week of planned exercise (Table 1). In conjunction with their habitual exercise, mean V̇O2max in EX was more than 20% higher than Non-EX, but this difference did not reach statistical significance (p = 0.12; Table 1). Ambulatory activity (i.e., steps per day) was similar between groups on the day before the experiment (Table 1), as well as on the day of the experimental exercise session. During the experimental exercise session, the relative and absolute exercise intensities were not different between groups (Table 2).
Table 1.
Baseline participant characteristics.
| EX | Non-EX | |
|---|---|---|
| Sex (M/F) | 5/7 | 5/7 |
| Age (y) | 26.5±1.7 | 28.3±2.0 |
| Body weight (kg) | 92.0±3.1 | 89.9±2.7 |
| BMI (kg/m2) | 30.9±1.0 | 30.1±0.5 |
| Body fat (%) | 35.0±1.6 | 35.1±1.6 |
| Fat mass (kg) | 32.3±2.1 | 31.4±1.5 |
| Fat free mass (kg) | 59.7±2.1 | 58.5±2.4 |
| Fasting glucose (mmol/L) | 4.3±0.1 | 4.5±0.1 |
| Fasting insulin (μU/mL) | 17.7±1.7 | 23.8±2.1 |
| V̇O2max (ml/kg/min) | 33.6±3.0 | 27.3±2.5 |
| Ambulatory activity (steps per day) | 2222±381 | 2525±709 |
| Planned exercise (MET hours per week) | 32.3±2.6 | 0.0±0.0* |
Note: Values are expressed mean ± SE.
Significantly different than EX, p < 0.05. (EX, exercisers; Non-EX, nonexercisers; MET, metabolic equivalent.)
Table 2.
Oxygen consumption and heart rate during the exercise session.
| EX | Non-EX | |
|---|---|---|
| VO2 during exercise (L/min) | 1.6±0.2 | 1.4±0.1 |
| VO2 max (%) | 53±3 | 58±4 |
| Heart rate (beats per minute) | 137.9±1.5 | 137.4±1.7 |
| Predicted HRmax (%) | 71.2±0.5 | 71.6±0.7 |
Note: Values are expressed mean ± SE. (EX, exercisers; Non-EX, nonexercisers; HRmax, maximum heart rate.)
Insulin Sensitivity Index
Despite similar body weight and adiposity, ISI was significantly higher in EX than Non-EX (Fig. 2). Importantly, the EX participants abstained from exercise for 3 days to wash out the effects of their most recent session of exercise. The calculation of HOMA-IR supported the notion that insulin sensitivity was higher in our EX versus Non-EX subjects (HOMA-IR: 3.4 ± 0.3 vs. 4.5 ± 0.5, respectively; p = 0.01). The single session of exercise performed in the afternoon of Day 1 of the experiment increased ISI the next morning in Non-EX, but not EX (Fig. 2). As a result of this increase in ISI in the Non-EX group, there was no longer a difference in ISI between EX and Non-EX the day after the single session of exercise (Day 2).
Fig. 2.
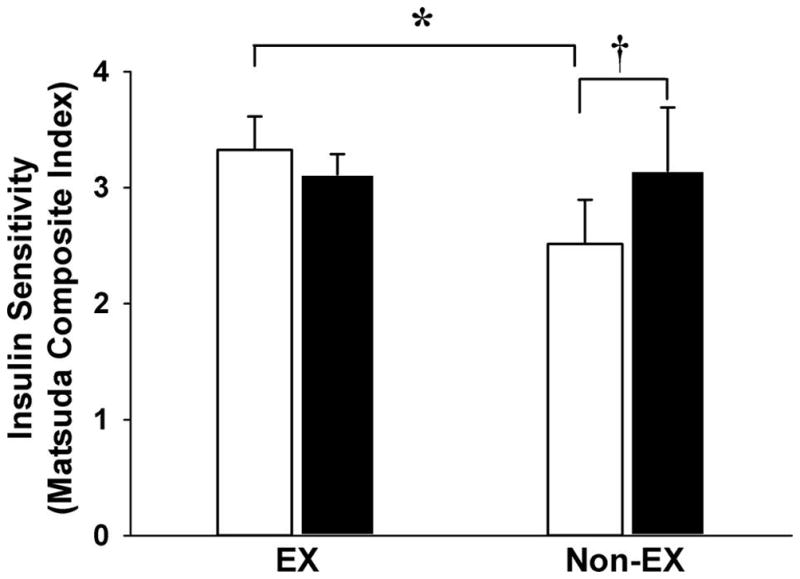
Insulin Sensitivity Index measured during an oral glucose tolerance test before (Day 1; white bars) and the day after a single session of exercise (Day 2; black bars). *Significantly different than the exerciser (EX) cohort on Day 1, p < 0.05). †Significant difference between Day 1 and Day 2 within the nonexerciser (Non-EX) cohort.
Markers of systemic inflammation
In the morning of Day 1 of the experiment, fasting plasma cytokine concentrations were not different between Non-EX and EX (Fig. 3). Interestingly, the improvement in ISI found the morning after acute exercise in our Non-Ex group was significantly correlated with the change in plasma IL-1β concentration (p = 0.03; Fig. 4). There was no such relationship between the change in ISI and any of the other inflammatory markers measured for either the EX or Non-EX subjects.
Fig. 3.

(A) Interleukin-6 (IL-6), (B) monocyte chemoattractant protein (MCP-1), (C) tumor necrosis factor-α (TNF-α), and (D) interleukin-1β (IL-1β) concentration measured before (Day 1; white bars) and the day after a single session of exercise (Day 2; black bars) in our exercisers (EX) (n = 8) and nonexercisers (Non-EX) (n = 8).
Fig. 4.

Relationship between percent change in fasting interleukin-1β (IL-1β) concentration and percent change in Insulin Sensitivity Index as measured during an oral glucose tolerance test using the Matsuda Composite Index before (Day 1) and the day after a single session of exercise (Day 2) in our nonexercisers (n = 8).
Blood pressure and blood lipid profile
Neither habitual nor acute exercise appeared to affect blood pressure in our subjects because both resting and ambulatory blood pressures were very similar between EX and Non-EX on Day 1 and Day 2 (Fig. 5). We also did not detect differences in blood lipids (i.e., Total-C, HDL-C, LDL-C, triglyceride) between our EX and Non-EX groups, and the acute exercise session did not significantly alter the plasma concentration of these blood lipids in either group (Table 3).
Fig. 5.

(A) Ambulatory systolic, (B) ambulatory diastolic, (C) resting systolic, and (D) resting diastolic blood pressure before (Day 1; white bars) and the day after a single session of exercise (Day 2; black bars).
Table 3.
Plasma lipid profile.
| EX
|
Non-EX
|
|||
|---|---|---|---|---|
| Day 1 | Day 2 | Day 1 | Day 2 | |
| Total-C (mg/dL) | 154±11 | 154±10 | 150±9 | 148±6 |
| LDL-C (mg/dL) | 105±12 | 104±10 | 103±8 | 101±5 |
| HDL-C (mg/dL) | 25±3 | 25±3 | 30±3 | 28±3 |
| Triglyceride (mg/dL) | 123±17 | 132±18 | 92±10 | 98±10 |
Note: Values are expressed mean ± SE.
Significant difference between Day 1 and Day 2 within EX, p < 0.05. (EX, exercisers; Non-EX, nonexercisers; Total-C, total Cholesterol; LDL-C, low-density lipoprotein cholesterol; HLD-C, high-density lipoprotein cholesterol.)
Discussion
A physically active lifestyle is widely identified as being an important contributor to improved health and disease prevention (Colberg et al. 2010; Ekblom-Bak et al. 2010). However, it is still unclear whether these health benefits stem largely from acute responses to the most recent session(s) of exercise or from more persistent effects due to physiological adaptations that accrue in response to regular exercise. Our findings indicate that overweight adults who exercise regularly were more insulin sensitive than their well-matched sedentary counterparts, even when the acute effects of exercise were removed by abstaining from exercise for 3 days. In contrast to our findings, many studies report that the increase in insulin sensitivity with exercise training is very transient, often returning to levels found in nonexercisers after only a few days without exercise (Mikines et al. 1989; Oshida et al. 1991; King et al. 1995). It is conceivable that some of this discrepancy may be explained by the possibility that some effects of acute exercise may still persist 3 days after the exercise in our habitually active subjects. However, Oshida et al. (1991) reported that the acute effects of exercise on insulin action were gone 38 h after the most recent session of exercise. Perhaps more importantly, these earlier studies reporting short-lived improvements after exercise were largely performed in lean subjects (Oshida et al. 1991; King et al. 1995), and the response in overweight adults may be different. The improvement in insulin resistance with habitual exercise in overweight or obese adults may not be isolated to adaptations occurring exclusively in the exercising muscles. Exercise training in obese adults has been found to improve hepatic insulin resistance (Kirwan et al. 2009), pancreatic beta-cell function (Bloem and Chang 2008; Solomon et al. 2013), and adiponectin secretion from adipose tissue (Kelly et al. 2012; Liu et al. 2013), all of which are linked with improvements in whole-body insulin sensitivity. Because these tissues work collectively with skeletal muscle to maintain plasma glucose levels, it is possible that the persistent improvement in insulin sensitivity in our regular exercisers was the result of exercise-induced adaptions in multiple tissues.
Consistent with previous reports (Devlin and Horton 1985; Newsom et al. 2013), we found that, despite our relatively modest sample size, a single session of exercise was sufficient to improve insulin sensitivity the next day in overweight adults who do not exercise regularly. In contrast, we did not observe an improvement in ISI after acute exercise in regular exercisers, and as a result, the difference in ISI between groups was no longer apparent the day after exercise. The mechanisms underlying the improvement in ISI in response to chronic versus acute exercise are likely very different. However, the clinical relevance of this finding is intriguing because it suggests that when compared with the enhanced insulin action stemming from exercising routinely, a similar degree of improved insulin action can be achieved nearly immediately without having to wait for the accrual of adaptations in response to weeks, months, or years of exercise training. Over time, as an individual adopts a more active lifestyle, the mechanisms underlying the exercise-induced improvement in insulin action may change, but the clinical outcome remains the same (i.e., improved insulin sensitivity). However, it is important to note that the ISIs measured after exercise in our overweight subjects were still less than half of values reported in sedentary lean adults (Niakaris et al. 2005; Duvivier et al. 2013). Moreover this is consistent with previous findings indicating that an acute session of exercise is not enough of a stimulus to ameliorate differences in measures of insulin sensitivity between insulin resistant and lean, insulin sensitivity adults (Devlin et al. 1987). Therefore, although exercise is clearly an important therapeutic tool for reducing metabolic disease risk among overweight to mildly obese adults, important additional benefits may be gained from weight loss.
The reason why the single session of exercise did not enhance insulin action in our habitually active participants is unclear. Perhaps the exercise stimulus in our study was below some “threshold” required to further enhance insulin action the next day in these subjects who exercise regularly. Factors determining the magnitude of an exercise stimulus that may be required to improve insulin sensitivity are not completely understood, but certainly the intensity, duration, and energy expended during exercise are likely candidates. Exercise intensity is a major determinant for the magnitude of muscle glycogen used during exercise (Romijn et al. 1993), and the exercise-induced reduction in muscle glycogen concentration is often linked with improved insulin sensitivity after exercise (Wojtaszewski et al. 2003). Because habitual exercise training is known to markedly reduce the contribution of muscle glycogen use during exercise (Jeukendrup 2002), this may help explain the lack of an acute effect of exercise on ISI in our habitually active subjects. The relatively mild exercise session in our study may have also contributed to this finding. The acute 1-h session of brisk walking in our study was equal to approximately 4.5 METs, whereas on average our active subjects reported participating in an hour of exercise equal to over 6 METs. Therefore, an exercise stimulus closer to, or perhaps even greater than, that performed regularly may be required to further enhance insulin action in a group of overweight adults who exercise routinely. This notion is generally consistent with the progressive overload principle (Hickson et al. 1981) indicating that a progressive increase in “stress” must be provided to induce physiological changes or adaptations. It is also important to note that because our assessment of insulin sensitivity was based on an established calculation using plasma glucose and insulin concentrations during an OGTT (Matsuda and DeFronzo 1999) rather than more sensitive measures, such as a hyperinsulinemic–euglycemic clamp (DeFronzo et al. 1979), it is possible we were unable to detect a relatively subtle improvement in insulin sensitivity the day after an acute session of moderate-intensity exercise in our cohort of regular exercisers.
Pro-inflammatory cytokines, including: IL-1β, IL-6, TNF-α, and MCP-1 are associated with insulin resistance (Olefsky and Glass 2010), and plasma concentrations of these cytokines are often found to be elevated in overweight and obese adults (Bruun et al. 2003; Kim et al. 2006). Weight loss is consistently found to lower the systemic abundance of many of these pro-inflammatory cytokines in conjunction with improvements in insulin sensitivity (Bruun et al. 2003). Similarly, when exercise training is accompanied by weight loss, the improvement in insulin sensitivity has been found to parallel the reduction in systemic inflammatory markers (Ryan and Nicklas 2004). However, the effect of exercise without weight loss is less clear. Although plasma concentrations of most of the systemic inflammatory markers we measured were not affected by exercise training or acute exercise in our study, the exercise-induced improvement in ISI we found the day after the acute session of exercise in Non-Ex was related to the change in plasma IL-1β concentration. IL-1β is a pro-inflammatory cytokine primarily produced and secreted by monocytes, macrophages, and neutrophils. IL-1β secretion is elevated in obesity, and accumulating evidence implicates IL-1β in the pathogenesis of insulin resistance (Nov et al. 2010; Grant and Dixit 2013). The effects of exercise on IL-1β are complex. In lean healthy adults, plasma IL-1β concentration has been found to increase during a session of exercise and then return to pre-exercise levels soon after exercise (Scott et al. 2013). But our finding that acute exercise lowered plasma IL-1β the day after exercise in our group of nonexercising overweight subjects suggests the effects of acute exercise in overweight adults is different, and this lowering of IL-1β may contribute to the exercise-induced improvement in ISI found in this group. This is in agreement with findings from a recent study in obese rodents (Oliveira et al. 2013). Therefore, although causality cannot be determined in the current study, our results support the growing body of literature highlighting the role of pro-inflammatory cytokines such as IL-1β in the pathogenesis of insulin resistance among overweight adults as well as a contributing mechanism by which exercise may lead to an improvement in whole body insulin sensitivity.
Although exercise training is commonly linked with reduced risk for cardiovascular disease (Ekblom-Bak et al. 2010), we found subjects’ blood lipid profile and blood pressure to be similar between our exercisers and nonexercisers. Importantly, the influence of exercise training on blood lipids and blood pressure is inconsistent (Thorogood et al. 2011). Additionally, even in studies that report exercise-induced improvement, these changes are often very modest (Thorogood et al. 2011). For example, meta-analysis from randomized control trials indicate that on average exercise training lowered total cholesterol by only 1.5 mg/dL (Thorogood et al. 2011; Hayashino et al. 2012) and systolic and diastolic blood pressure by <2 mm Hg (Thorogood et al. 2011). More consistent improvements in blood lipids and blood pressure are observed in individuals who show signs of dyslipidemia and hypertension (Duncan et al. 2005; Liu et al. 2012), but these improvements are still rather modest (e.g., 2 mg/dL increase in HDL-C and 5–7 mm Hg reduction in systolic blood pressure (Duncan et al. 2005; Liu et al. 2012).
Assessing the direct contribution of regular exercise on important clinical outcomes like insulin resistance, blood lipids, and blood pressure can be very challenging. For example, because a relatively minor reduction in body weight can increase insulin sensitivity, improve blood lipid profile, and lower blood pressure (Klein et al. 2004) if exercise is accompanied by even a subtle degree of weight loss, this would confound the interpretation of the underlying cause for the improvements in cardiometabolic risk. Although our cross-sectional study design certainly has limitations, we were very strict about weight stability among all of our subjects, and we tightly matched key phenotypic characteristics of our group of regular exercisers and nonexercisers (e.g., body weight, body composition, waist circumference), which increases confidence regarding the independent effects of regular exercise on ISI and the other clinical outcomes that we reported here. Understanding the independent effects of exercise behavior (separate from the effects of weight loss and energy balance) on important health outcomes is very valuable in the development of lifestyle programs aimed at improving metabolic health. It is also important to note that the habitual physical activity and exercise behavior of our two groups was estimated from participants’ self-reports. Because self-reported physical activity tends to be over reported compared with objective measures of physical activity (Ekblom-Bak et al. 2010), is possible that the disparity in exercise volume between our two groups was narrower than our estimates suggest. Additionally, to minimize any potential confounding sex differences we studied female participants during the follicular phase of their menstrual cycle. Because this was based on self-report, not ovarian hormone concentration, we cannot determine if female participants were in the early, mild, or late stages of the follicular phase.
In summary, we found that habitually engaging in a regular exercise routine was associated with a persistently elevated ISI in overweight adults, but not with a reduction in other key cardiometabolic disease risk factors (i.e., blood lipids or blood pressure). It is important to note that despite this beneficial effect of habitual exercise on insulin sensitivity, the ISI in our obese exercisers was still well below that commonly found in healthy, but sedentary, nonobese adults (Niakaris et al. 2005; Duvivier et al. 2013). In response to a single session of moderate-intensity exercise, ISI improved the day after exercise in overweight adults who do not normally exercise, but not in those who exercise regularly. As a result the difference in insulin sensitivity between our group of regular exercisers and nonexercisers was largely eliminated. The exercise session lowered plasma IL-1β concentration in the habitually sedentary overweight subjects, suggesting a reduction in systemic inflammation may contribute to their enhanced insulin action after exercise. Therefore, although habitual exercise is associated with enhanced insulin sensitivity among overweight adults, just 1 session of exercise was enough to increase insulin sensitivity among sedentary overweight adults to levels similar to that found in regular exercisers.
Acknowledgments
We are grateful to Sachi Y. Gianchandani and Stephen Doll for their excellent laboratory assistance, Lisa Michael and Suzette Howton for designing and preparing standardized meals, as well as to our many wonderful participants for their contribution to this study.
Footnotes
Competing interests: the authors have no competing interests.
References
- Assali AR, Ganor A, Beigel Y, Shafer Z, Hershcovici T. Insulin resistance in obesity: body-weight or energy balance. J Endocrinol. 2001;171:293–298. doi: 10.1677/joe.0.1710293. [DOI] [PubMed] [Google Scholar]
- Bloem CJ, Chang AM. Short-term exercise improves beta-cell function and insulin resistance in older people with impaired glucose tolerance. J Clin Endocrinol Metab. 2008;93:387–392. doi: 10.1210/jc.2007-1734. [DOI] [PMC free article] [PubMed] [Google Scholar]
- Bruun JM, Verdich C, Toubro S, Astrup A, Richelsen B. Association between measures of insulin sensitivity and circulating levels of interleukin-8, interleukin-6 and tumor necrosis factor-alpha. Effect of weight loss in obese men. Eur J Endocrinol. 2003;148:535–542. doi: 10.1530/eje.0.1480535. [DOI] [PubMed] [Google Scholar]
- Clasey JL, Kanaley JA, Wideman L, Heymsfield SB, Teates CD, Gutgesell ME, et al. Validity of methods of body composition assessment in young and older men and women. J Appl Physiol. 1999;86:1728–1738. doi: 10.1152/jappl.1999.86.5.1728. [DOI] [PubMed] [Google Scholar]
- Colberg SR, Albright AL, Blissmer BJ, Braun B, Chasan-Taber L, Fernhall B, et al. Exercise and type 2 diabetes: American College of Sports Medicine and the American Diabetes Association: joint position statement. Exercise and type 2 diabetes. Med Sci Sports Exerc. 2010;42:2282–2303. doi: 10.1249/MSS.0b013e3181eeb61c. [DOI] [PubMed] [Google Scholar]
- Cunningham JJ. Body composition as a determinant of energy expenditure: a synthetic review and a proposed general prediction equation. Am J Clin Nutr. 1991;54:963–969. doi: 10.1093/ajcn/54.6.963. [DOI] [PubMed] [Google Scholar]
- DeFronzo R, Tobin J, Andres R. Glucose clamp technique: a method for quantifying insulin secretion and resistance. Am J Physiol Endocrinol Metab. 1979;237:E214–E223. doi: 10.1152/ajpendo.1979.237.3.E214. [DOI] [PubMed] [Google Scholar]
- Devlin JT, Horton ES. Effects of prior high-intensity exercise on glucose metabolism in normal and insulin-resistant men. Diabetes. 1985;34:973–979. doi: 10.2337/diabetes.34.10.973. [DOI] [PubMed] [Google Scholar]
- Devlin JT, Hirshman M, Horton ED, Horton ES. Enhanced peripheral and splanchnic insulin sensitivity in NIDDM men after single bout of exercise. Diabetes. 1987;36:434–439. doi: 10.2337/diab.36.4.434. [DOI] [PubMed] [Google Scholar]
- Douketis JD, Macie C, Thabane L, Williamson DF. Systematic review of long-term weight loss studies in obese adults: clinical significance and applicability to clinical practice. Int J Obes (Lond) 2005;29:1153–1167. doi: 10.1038/sj.ijo.0802982. [DOI] [PubMed] [Google Scholar]
- Duncan GE, Anton SD, Sydeman SJ, Newton RL, Jr, Corsica JA, Durning PE, et al. Prescribing exercise at varied levels of intensity and frequency: a randomized trial. Arch Intern Med. 2005;165:2362–2369. doi: 10.1001/archinte.165.20.2362. [DOI] [PubMed] [Google Scholar]
- Duvivier BM, Schaper NC, Bremers MA, van Crombrugge G, Menheere PP, Kars M, et al. Minimal intensity physical activity (standing and walking) of longer duration improves insulin action and plasma lipids more than shorter periods of moderate to vigorous exercise (cycling) in sedentary subjects when energy expenditure is comparable. PLoS One. 2013;8:e55542. doi: 10.1371/journal.pone.0055542. [DOI] [PMC free article] [PubMed] [Google Scholar]
- Ekblom-Bak E, Hellenius ML, Ekblom O, Engstrom LM, Ekblom B. Independent associations of physical activity and cardiovascular fitness with cardiovascular risk in adults. Eur J Cardiovasc Prev Rehabil. 2010;17:175–180. doi: 10.1097/HJR.0b013e32833254f2. [DOI] [PubMed] [Google Scholar]
- Faulkner J, Parfitt G, Eston R. Prediction of maximal oxygen uptake from the ratings of perceived exertion and heart rate during a perceptually-regulated sub-maximal exercise test in active and sedentary participants. Eur J Appl Physiol. 2007;101:397–407. doi: 10.1007/s00421-007-0508-6. [DOI] [PubMed] [Google Scholar]
- Flegal KM, Carroll MD, Kit BK, Ogden CL. Prevalence of obesity and trends in the distribution of body mass index among US adults, 1999–2010. JAMA. 2012;307:491–497. doi: 10.1001/jama.2012.39. [DOI] [PubMed] [Google Scholar]
- Grant RW, Dixit VD. Mechanisms of disease: inflammasome activation and the development of type 2 diabetes. Front Immunol. 2013;4:50. doi: 10.3389/fimmu.2013.00050. [DOI] [PMC free article] [PubMed] [Google Scholar]
- Hayashino Y, Jackson JL, Fukumori N, Nakamura F, Fukuhara S. Effects of supervised exercise on lipid profiles and blood pressure control in people with type 2 diabetes mellitus: a meta-analysis of randomized controlled trials. Diabetes Res Clin Pract. 2012;98:349–360. doi: 10.1016/j.diabres.2012.10.004. [DOI] [PubMed] [Google Scholar]
- Hickson RC, Hagberg JM, Ehsani AA, Holloszy JO. Time course of the adaptive responses of aerobic power and heart rate to training. Med Sci Sports Exerc. 1981;13:17–20. doi: 10.1249/00005768-198101000-00012. [DOI] [PubMed] [Google Scholar]
- Jeukendrup AE. Regulation of fat metabolism in skeletal muscle. Ann NY Acad Sci. 2002;967:217–235. doi: 10.1111/j.1749-6632.2002.tb04278.x. [DOI] [PubMed] [Google Scholar]
- Kelly KR, Blaszczak A, Haus JM, Patrick-Melin A, Fealy CE, Solomon TP, et al. A 7-d exercise program increases high-molecular weight adiponectin in obese adults. Med Sci Sports Exerc. 2012;44:69–74. doi: 10.1249/MSS.0b013e318228bf85. [DOI] [PubMed] [Google Scholar]
- Kim CS, Park HS, Kawada T, Kim JH, Lim D, Hubbard NE, et al. Circulating levels of MCP-1 and IL-8 are elevated in human obese subjects and associated with obesity-related parameters. Int J Obes (Lond) 2006;30:1347–1355. doi: 10.1038/sj.ijo.0803259. [DOI] [PubMed] [Google Scholar]
- King DS, Baldus PJ, Sharp RL, Kesl LD, Feltmeyer TL, Riddle MS. Time course for exercise-induced alterations in insulin action and glucose tolerance in middle-aged people. J Appl Physiol. 1995;78:17–22. doi: 10.1152/jappl.1995.78.1.17. [DOI] [PubMed] [Google Scholar]
- Kirwan JP, Solomon TP, Wojta DM, Staten MA, Holloszy JO. Effects of 7 days of exercise training on insulin sensitivity and responsiveness in type 2 diabetes mellitus. Am J Physiol Endocrinol Metab. 2009;297:E151–E156. doi: 10.1152/ajpendo.00210.2009. [DOI] [PMC free article] [PubMed] [Google Scholar]
- Klein S, Burke LE, Bray GA, Blair S, Allison DB, Pi-Sunyer X, et al. Clinical implications of obesity with specific focus on cardiovascular disease: a statement for professionals from the American Heart Association Council on Nutrition, Physical Activity, and Metabolism: endorsed by the American College of Cardiology Foundation. Circulation. 2004;110:2952–2967. doi: 10.1161/01.CIR.0000145546.97738.1E. [DOI] [PubMed] [Google Scholar]
- Liu S, Goodman J, Nolan R, Lacombe S, Thomas SG. Blood pressure responses to acute and chronic exercise are related in prehypertension. Med Sci Sports Exerc. 2012;44:1644–1652. doi: 10.1249/MSS.0b013e31825408fb. [DOI] [PubMed] [Google Scholar]
- Liu Y, Turdi S, Park T, Morris NJ, Deshaies Y, Xu A, et al. Adiponectin corrects high-fat diet-induced disturbances in muscle metabolomic profile and whole-body glucose homeostasis. Diabetes. 2013;62:743–752. doi: 10.2337/db12-0687. [DOI] [PMC free article] [PubMed] [Google Scholar]
- Matsuda M, DeFronzo RA. Insulin sensitivity indices obtained from oral glucose tolerance testing: comparison with the euglycemic insulin clamp. Diabetes Care. 1999;22:1462–1470. doi: 10.2337/diacare.22.9.1462. [DOI] [PubMed] [Google Scholar]
- Mikines KJ, Sonne B, Tronier B, Galbo H. Effects of acute exercise and detraining on insulin action in trained men. J Appl Physiol. 1989;66:704–711. doi: 10.1063/1.343541. [DOI] [PubMed] [Google Scholar]
- Newsom SA, Everett AC, Hinko A, Horowitz JF. A single session of low-intensity exercise is sufficient to enhance insulin sensitivity into the next day in obese adults. Diabetes Care. 2013;36:2516–2522. doi: 10.2337/dc12-2606. [DOI] [PMC free article] [PubMed] [Google Scholar]
- Niakaris K, Magkos F, Geladas N, Sidossis LS. Insulin sensitivity derived from oral glucose tolerance testing in athletes: disagreement between available indices. J Sports Sci. 2005;23:1065–1073. doi: 10.1080/02640410400023241. [DOI] [PubMed] [Google Scholar]
- Nov O, Kohl A, Lewis EC, Bashan N, Dvir I, Ben-Shlomo S, et al. Interleukin-1beta may mediate insulin resistance in liver-derived cells in response to adipocyte inflammation. Endocrinology. 2010;151:4247–4256. doi: 10.1210/en.2010-0340. [DOI] [PubMed] [Google Scholar]
- Olefsky JM, Glass CK. Macrophages, inflammation, and insulin resistance. Annu Rev Physiol. 2010;72:219–246. doi: 10.1146/annurev-physiol-021909-135846. [DOI] [PubMed] [Google Scholar]
- Oliveira AG, Araujo TG, Carvalho BM, Guadagnini D, Rocha GZ, Bagarolli RA, et al. Acute exercise induces a phenotypic switch in adipose tissue macrophage polarization in diet-induced obese rats. Obesity (Silver Spring) 2013;21:2545–2556. doi: 10.1002/oby.20402. [DOI] [PubMed] [Google Scholar]
- Oshida Y, Yamanouchi K, Hayamizu S, Nagasawa J, Ohsawa I, Sato Y. Effects of training and training cessation on insulin action. Int J Sports Med. 1991;12:484–486. doi: 10.1055/s-2007-1024718. [DOI] [PubMed] [Google Scholar]
- Quinn TJ. Twenty-four hour, ambulatory blood pressure responses following acute exercise: impact of exercise intensity. J Hum Hypertens. 2000;14:547–553. doi: 10.1038/sj.jhh.1001106. [DOI] [PubMed] [Google Scholar]
- Rodbard HW, Bays HE, Gavin JR, III, Green AJ, Bazata DD, Lewis SJ, et al. Rate and risk predictors for development of self-reported type-2 diabetes mellitus over a 5-year period: the SHIELD study. Int J Clin Pract. 2012;66:684–691. doi: 10.1111/j.1742-1241.2012.02952.x. [DOI] [PubMed] [Google Scholar]
- Romijn JA, Coyle EF, Sidossis LS, Gastaldelli A, Horowitz JF, Endert E, et al. Regulation of endogenous fat and carbohydrate metabolism in relation to exercise intensity and duration. Am J Physiol. 1993;265:E380–E391. doi: 10.1152/ajpendo.1993.265.3.E380. [DOI] [PubMed] [Google Scholar]
- Ryan AS, Nicklas BJ. Reductions in plasma cytokine levels with weight loss improve insulin sensitivity in overweight and obese postmenopausal women. Diabetes Care. 2004;27:1699–705. doi: 10.2337/diacare.27.7.1699. [DOI] [PubMed] [Google Scholar]
- Scott JP, Sale C, Greeves JP, Casey A, Dutton J, Fraser WD. Cytokine response to acute running in recreationally-active and endurance-trained men. Eur J Appl Physiol. 2013;113:1871–1182. doi: 10.1007/s00421-013-2615-x. [DOI] [PubMed] [Google Scholar]
- Solomon TP, Malin SK, Karstoft K, Kashyap SR, Haus JM, Kirwan JP. Pancreatic beta-cell function is a stronger predictor of changes in glycemic control after an aerobic exercise intervention than insulin sensitivity. J Clin Endocrinol Metab. 2013;98:4176–4186. doi: 10.1210/jc.2013-2232. [DOI] [PMC free article] [PubMed] [Google Scholar]
- Tattersall MC, Gangnon RE, Karmali KN, Cullen MW, Stein JH, Keevil JG. Trends in low-density lipoprotein cholesterol goal achievement in high risk United States adults: longitudinal findings from the 1999–2008 national health and nutrition examination surveys. PLoS One. 2013;8:e59309. doi: 10.1371/journal.pone.0059309. [DOI] [PMC free article] [PubMed] [Google Scholar]
- Thorogood A, Mottillo S, Shimony A, Filion KB, Joseph L, Genest J, et al. Isolated aerobic exercise and weight loss: a systematic review and meta-analysis of randomized controlled trials. Am J Med. 2011;124:747–755. doi: 10.1016/j.amjmed.2011.02.037. [DOI] [PubMed] [Google Scholar]
- Wojtaszewski JF, Jorgensen SB, Frosig C, MacDonald C, Birk JB, Richter EA. Insulin signalling: effects of prior exercise. Acta Physiol Scand. 2003;178:321–328. doi: 10.1046/j.1365-201X.2003.01151.x. [DOI] [PubMed] [Google Scholar]