

Abstract
Adaptive execution and inhibition of behavior are guided by the activity of neuronal populations across multiple frontal cortical areas. The rodent medial prefrontal cortex has been well studied with respect to these behaviors, influencing behavioral execution/inhibition based on context. Other frontal regions, in particular the orbitofrontal cortex (OFC), are critical in directing behavior to obtain rewards, but the relationship between OFC neuronal activity and response execution or inhibition has been poorly characterized. In particular, little is known about OFC with respect to extinction learning, an important example of context-guided response inhibition. Here, we recorded the activity of OFC neurons while rats performed a discriminative-stimulus (DS)-driven sucrose-seeking task followed by multiple days of extinction of the DS. OFC neuronal activity was maximally responsive (1) to reward-predicting stimuli (RS) that triggered a lever press (i.e., lever-response initiation) and (2) during reward-well approach in pursuit of sucrose (i.e., well-response initiation). RS presentation that was not followed by a lever press or RS presentation during extinction produced weak activation, as did nonrewarded stimulus (NS) presentation regardless of response (press or withhold) or session (DS-sucrose or extinction). Activity related to nonrewarded well entry was minor, and activity was significantly inhibited during reward consumption. Finally, OFC neuronal activity switched selectivity to track rewarded behaviors when the RS/NS contingencies were reversed. Thus, rather than signaling variables related to extinction or response inhibition, activity in OFC was strongest at the initiation of multiple components of reward-seeking behavior, most prominently when valid reward-predicting cues drove these behaviors.
Keywords: motivation, orbital cortex, prefrontal cortex, response-inhibition, salience, single-neuron
Introduction
The orbitofrontal cortex (OFC) regulates goal-directed behaviors and decisions through encoding multiple cognitive/motivational parameters (Mainen and Kepecs, 2009; Schoenbaum et al., 2009; Grabenhorst and Rolls, 2011; Schultz et al., 2011; Wallis, 2012). OFC lesions or inactivation weakens stimulus-outcome updating (Gallagher et al., 1999; Schoenbaum et al., 2002; Chudasama and Robbins, 2003; McAlonan and Brown, 2003; Roberts, 2006; Riceberg and Shapiro, 2012). Outcome-related signals in OFC are modulated by valence, size, preference, and time (Schoenbaum and Eichenbaum, 1995; Schoenbaum et al., 2003; Roesch and Olson, 2004, 2005; Roesch et al., 2006; Padoa-Schioppa, 2007; van Duuren et al., 2007, 2008; Wallis, 2012). Activity is also influenced by location (Feierstein et al., 2006; Roesch et al., 2006; Kennerley and Wallis, 2009), outcome probability, certainty or confidence (Kepecs et al., 2008; van Duuren et al., 2009), salience (Ogawa et al., 2013), and risk (O'Neill and Schultz, 2010; Roitman and Roitman, 2010).
Despite extensive studies, questions remain regarding the relationship of OFC to reward-seeking, response inhibition, and learning. First, although rewards, punishments, and their predictors are encoded by OFC neurons, it is unclear how OFC represents null stimuli that predict absence of a reward or punishment (but see van Duuren et al., 2009; Ogawa et al., 2013; and Discussion). Second, recent work suggests that OFC encodes outcomes in Pavlovian contexts (Ostlund and Balleine, 2007), but this hypothesis has only begun to be tested (Luk and Wallis, 2013). Third, there is a developing perspective that OFC activity does not encode response inhibition (Schoenbaum et al., 2009), despite studies proposing its role in such behavior (Aron et al., 2003; Chudasama et al., 2003; Eagle et al., 2008; Eagle and Baunez, 2010). Fourth, and related, some studies have reported an OFC influence in extinction learning (Butter et al., 1963; Gottfried and Dolan, 2004; Izquierdo and Murray, 2005; Finger et al., 2008; Zeeb and Winstanley, 2013; Panayi and Killcross, 2014) but others have not (Burke et al., 2008, 2009). OFC activity decreased during extinction of compound probes in a Pavlovian overexpectation task, but not during extinction of separate reward-predicting cues (Takahashi et al., 2013). It has been hypothesized that Pavlovian extinction is a model-free process and that OFC is involved in model-based behaviors (McDannald et al., 2011, 2012). Instrumental extinction may be model-based, requiring an update of “if-then” contingencies, analogous to the role of OFC in inferred value (Jones et al., 2012).
We recorded from OFC neurons while rats performed an instrumental, discriminative-stimulus driven go/nogo task, during extinction, and finally, during reversal. OFC neurons responded to salient (conditioned) stimuli, particularly when these predicted reward availability. OFC activity was strongest at the initiation of reward-seeking behaviors (initiation of lever press and of well-approach) compared to when reward-predicting stimuli elicited no behavior, or when nonrewarded or extinguished stimuli produced a behavioral response. These results indicate that OFC neurons encode the interaction of reward expectation and initiation of reward-seeking, and argue against any explicit representation of response inhibition or extinction.
Materials and Methods
Animals.
Male Long–Evans rats (∼300–400 g upon arrival; Charles River Laboratories; n = 4) were used in these experiments. Rats were single-housed under temperature- and humidity-controlled conditions on a reversed light cycle (6:00 A.M. off to 6:00 P.M. on) and allowed ad libitum access to commercial chow and tap water. All protocols and procedures followed the National Institutes of Health Guidelines for the Care and Use of Laboratory Animals, and were approved by the Medical University of South Carolina Institutional Animal Care and Use Committee.
Surgery.
Anesthesia was induced with isoflurane in a closed container, and maintained with 1.5–2.5% isoflurane in air delivered through a nose-cone. Animals were placed in a stereotaxic frame, and body temperature was maintained at ∼37°C using a thermistor-controlled electric heating pad. All incision points were infiltrated with a long-lasting anesthetic (2% lidocaine). The skull was exposed and bilateral holes were drilled above the lateral OFC (∼3.2 mm rostral and ∼3.2 mm lateral to bregma). Three or four additional holes were drilled and screws were implanted to secure array implants. An array of 16 stainless-steel microwires (50 μm) arranged in a 4 × 4 pattern (∼200 μm spacing) were lowered into the ventral/lateral orbitofrontal cortex in each hemisphere (2 arrays per animal; DV = 5.2). Craniotomies were filled with gel-foam, secured with cyanoacrylate, and arrays were secured to the skull screws using dental cement. Animals were given antibiotic (0.1 ml cefazolin, 330 mg/ml, i.m.) and analgesic (meloxicam, 1 mg/kg, s.c.) and allowed to recover at least 1 week following surgery, during which time weight, activity, and other measures of general health were monitored.
Behavioral training and task.
Following recovery, rats were trained to self-administer sucrose using a fixed-ratio (FR1) paradigm in sound-attenuated operant chambers (Med-Associates). During training, rats were presented with two levers (1 active and 1 inactive). Pressing of the active lever resulted in retraction of both levers and illumination of a light in the reward well. The well light (signaling reward availability) remained illuminated for 10 s. Upon well entry, the well light turned off and 0.1 ml of 15% sucrose was delivered. Inactive lever presses were recorded but produced no outcome. Animals received a 20–30 s time-out following either well entry or lever-retraction (if the active lever was pressed but the well was not entered).
Following successful acquisition of the FR1 sucrose task, animals were trained on the discriminative-stimulus (DS)-sucrose task. (Fig. 1A). In this task, the active and inactive levers were presented individually and in a pseudorandom fashion. Lever presentations were paired with unique tones (active = 10 kHz, inactive = 5 kHz), forming a rewarded-stimuli (RS) and a nonrewarded stimuli (NS) complex. Tones were played for a maximum of 3 s, and levers remained extended for a maximum of 10 s. RS-lever presses resulted in tone offset, lever retraction, and illumination of a light in the reward well. The well light (signaling reward availability) remained illuminated for 10 s or until well entry, at which point 0.1 ml of 15% sucrose was delivered. NS-lever presses were recorded but produced no outcome. Animals received a 20–30 s time-out following either well entry or lever retraction (after the NS-lever was retracted or if the RS-lever was pressed but the well was not entered). Rats ran for 1 h per day on the DS-driven sucrose-seeking (DS-sucrose) task. Recording commenced upon stable successful performance (>75% responses to RS-presentation along with <25% responses to NS-presentation for >2 d).
Figure 1.

A, Rats were presented with RS or NS consisting of cue/lever combinations. Stimulus tones lasted 3 s or until rats pressed the RS lever. Responding on the NS lever (gray) produced no outcome. Ten seconds after NS presentation, lever retraction and house-light onset signified time out. Responding on the RS lever within 10 s produced tone cessation and lever retraction. If RS lever press was followed by well entry within 10 s the rat received 0.1 ml of 15% sucrose solution (black). During extinction sessions, all events were as during DS-sucrose except that well entry led to no reward (dashed line). B, Lever press and well entry behavior. RS lever presses (χ2(4,19) = 19.37, p < 0.001, Kruskal–Wallis) and well-entries (χ2(4,19) = 20.03, p < 0.001) decreased significantly across extinction days. C, Distribution of reaction times. Red: RS onset → lever press reaction times; blue: RS lever press → well entry reaction times; green: RS onset → response initiation reaction times (based on video analysis). D, Placement of recording wire tips. All wires tips were histologically localized to the lateral OFC/anterior insula region.
Neurons were recorded for two sessions/rat during performance of the DS-sucrose task, one session for each implanted array. Following the final DS-sucrose session, neuronal activity was recorded during extinction sessions for 4 consecutive days. During this time, stimuli were presented as during the DS-sucrose task. RS-lever presses resulted in lever-retraction and illumination of the well light. Well entry, however, resulted only in offset of the well light and no delivery of sucrose. NS-lever presses produced no results. Recordings from the same population of neurons were made on Extinction Days 1 and 3, and Extinction Days 2 and 4. Therefore, recording sessions from Extinction Days 1 and 2 were grouped together as “early extinction” and Extinction Days 3 and 4 as “late extinction.”
Following conclusion of the extinction study, a subset of animals (N = 3) were retrained on DS-sucrose (rewarded). Upon successful reacquisition of the task, animals were then trained in a reversal version of the task in which, after 30 min, the RS and NS lever/tone-reward relationships were switched. Thus, for example, “Tone1 + Left Lever = reward” was switched to “Tone1 + Left Lever = no reward,” and “Tone 2 + Right Lever = no reward” was switched to “Tone 2 + Right Lever = reward.” The reversed task was the same as previously described (except for reversed lever-tone complexes). Animals were trained on the reversal version of the task over multiple sessions to reach reliable switching task performance, at which point we recorded within-session neuronal activity pre-reversal and postreversal.
Electrophysiological recording.
Arrays were connected to a headstage during recording sessions (20× gain, Plexon). Signals were passed through a cable (Omnetics Connector) to an electrical commutator (Keyo Electric) to allow free movement. Commutator output was delivered to a Plexon recording system (MAP/16), where signals were amplified (50×), filtered (100 Hz–8 kHz), and sampled (40 kHz). Action potentials were recorded using RASPUTIN software (Plexon) where gain and thresholds were set to isolate single-neuron activity. Recorded spikes were further sorted offline using Offline Sorter (Plexon) using a combination of template-matching and principal components analyses. Well-isolated single units that fired consistently throughout the recording session were included for analysis. Timestamps for behavioral events were sent from the Med-Associates behavioral control system to the Plexon recording system for use in aligning neural activity to behavior. All experimental sessions were recorded onto digital video (Cineplex, Plexon) for additional behavioral analyses.
Histology.
Following experimental testing and recording, rats were anesthetized with 1.5–2.5% isoflurane, and constant current (25 μA) was delivered to each recording wire for 15 s to produce lesions and iron deposits to mark the tips of recording electrodes. Following lesions, rats recovered from anesthesia and were killed and perfused 1 d later to allow development of lesion-induced gliosis. Animals were perfused with ∼50 ml of 0.9% NaCl solution followed by 400–500 ml of 4% paraformaldehyde followed by 50–100 ml of a 5% potassium ferricyanide/5% HCl solution to stain iron deposits with the Prussian blue method. Brains were postfixed overnight in 4% paraformaldehyde and transferred to a 20% solution of sucrose/0.1% sodium azide in phosphate buffer at 4°C for at least 3 d. Coronal, 40-μm-thick sections of brains were cut on a cryostat. Orbitofrontal sections were transferred to slides, counterstained with neutral red (Fisher), dehydrated with graded alcohol solutions, cleared with xylene, and coverslipped with Permount (Fisher). Prussian blue-stained iron deposits were used to confirm accurate electrode placements (Fig. 1D).
Data analysis.
Timestamps of sorted spikes and behavioral events were imported into MATLAB (MathWorks), where custom analyses were used to assess the relationship of neuronal activity to behavior. All well isolated neurons were included in analyses, although subsets were selected for additional analysis based on response criteria (e.g., significant increase or decrease of firing rate above or below baseline in relation to task events). Neuronal activity aligned on task events (e.g., stimulus presentation) was grouped in 50 ms bins, and spike density functions were generated by Gaussian smoothing the resulting event-related histogram. Neuronal activity was Z-score normalized against a 2000 ms baseline epoch preceding the onset of RS/NS presentations for comparisons across neurons by subtracting mean and dividing by SD of baseline. Neurons were characterized as significantly modulated based on paired Wilcoxon signed rank tests comparing firing rate 500 to 0 ms prestimulus to 100 to 600 ms poststimulus (to account for response onset latency) across trials when trials were equivalent (e.g., comparing neuronal responses with RS and NS presentations). For comparisons of activity across conditions with unequal numbers of trials (e.g., comparing RS-press with RS-withhold), significance was calculated using paired Wilcoxon signed rank tests on Z-score normalized population averages. Both types of analyses produced similar outcomes although significance calculated based on averages resulted in an overall increase in significantly modulated neurons. Peri-lever press and peri-well entry epochs were 250 ms pre-event to 250 ms postevent. Other epochs are described in Results.
For each extinction day we characterized the trial-to-trial relationship of OFC activity to lever-pressing for every neuron. To do this, we took the mean activity 100–600 ms post-RS onset for each trial and plotted the cumulative sum of this activity across trials for the whole recording session for each neuron. We then plotted the similar cumulative sum of lever presses for each trial across trials, so activity for each neuron was analyzed in a trial-by-trial fashion with respect to lever-press behavior. Both lever press behavior and neural responses were trial normalized (within the same animal, so that the relationship was consistent) such that the maximum number of observations (lever-presses or mean activity) was 1. Trials were also normalized to the maximum number of trials to facilitate comparison across animals/sessions with different total number of trials. We then compared the resulting cumulative behavior and firing curves, by measuring the area under each curve, to determine whether changes in neural activity over the course of each extinction session preceded decreases in lever pressing (firing curves shifted to the left of behavior curves) or lagged decreases in lever pressing (firing curves shifted to the right of behavior curves). Curves were compared statistically using Kolmogorov–Smirnov analysis and both significant and nonsignificant differences were quantified.
Additional parametric or nonparametric analyses, as appropriate, were applied to firing rate data as described in Results. Main effects were calculated using ANOVAs, Kruskal–Wallis, and Friedman tests were performed based on whether the data were parametric and whether data were paired. Within-neuron comparisons were made using paired t tests/Wilcoxon signed rank tests when trials were equivalent. Analyses of numbers of significant neurons were made using Fisher's exact test. Nonequivalent or cross-neuron analyses were performed using unpaired t tests or Mann–Whitney U tests.
Results
Behavior
We recorded neuronal activity from 89 neurons in four rats implanted with 16 wire arrays bilaterally in OFC during performance of a DS-sucrose task, and then also during extinction sessions when reward was omitted (See Materials and Methods; Fig. 1A). Rats performed the task highly accurately (Fig. 1B), responding significantly more frequently to the RS than the NS (signed rank = 36, p < 0.001; Wilcoxon signed rank). Rats always went to the reward well following lever press (Fig. 1B). Stimulus onset-to-lever press and lever press-to-well entry reaction times (Fig. 1C) were relatively long, but well within the time constraints dictated by the task.
We also used video analysis to characterize the time of response initiation, i.e., the first frame (10 frames/s) where animals began their orientation to the RS lever. Using this metric, we found a much shorter and consistent response initiation time (Fig. 1C). Both lever press and response initiation times were used for neural analysis. RS lever presses and well entries decreased significantly across extinction days, consistent with the fact that behavior was motivated by sucrose reward and that RS-related behavior was extinguished when reward was not presented (Fig. 1B).
OFC neurons responded more to RS than to NS presentations
Neurons histologically localized to OFC (89 cells; Fig. 1D) were strongly modulated during task performance. Single neuron examples in Figure 2A are representative of the population response to RS and NS presentations (Fig. 2B). Onset latency (first bin >2SD + baseline) was rapid (RS: median = 200 ms, mean = 332 ms; NS: median = 200 ms, mean = 572 ms), far in advance of lever presses (Fig. 1C) and, on the whole, preceded response initiation (Fig. 1A; and see the following section: OFC neurons selectively responded for RS-driven response initiation). We therefore focused the majority of our analyses on stimulus-evoked responses that occurred 100–600 ms following RS-/NS-presentation (lever press- and well entry-related analyses are below; Fig. 3).
Figure 2.
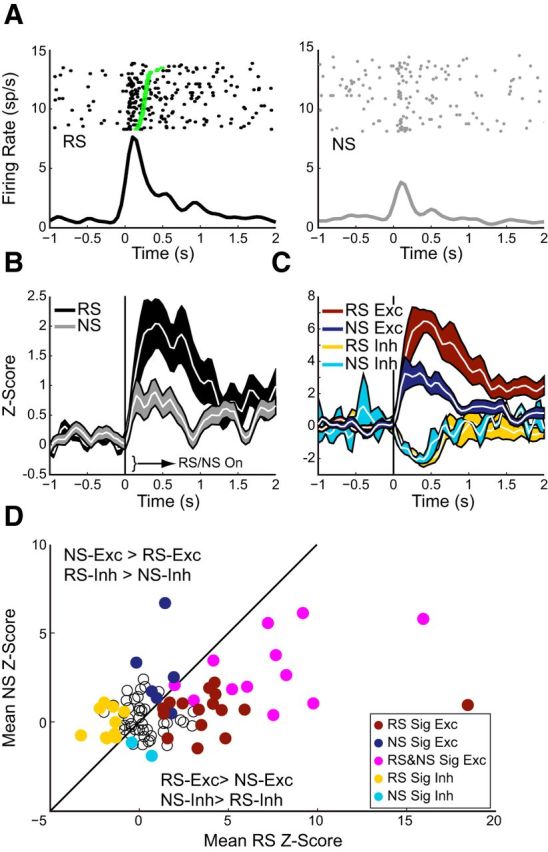
Orbitofrontal neurons exhibited stimulus-evoked neural activity during DS-sucrose. All responses aligned on stimulus onset (time = 0). A, Single-neuron examples of the prevalent responses to RS (left, black) and NS (right, gray) presentation. Green squares in the left panel represent initiation of behavioral response (see Materials and Methods) and demonstrate that OFC activity increases immediately preceding behavior. B, Mean Z-scores ±SE of all recorded neurons (n = 89) during DS-sucrose for RS (black) and NS (gray) demonstrate stronger RS versus NS signaling (z = 2.55, p = 0.011; Wilcoxon signed rank). C, Mean Z-score activity for neurons that exhibited significant RS/NS-evoked increases (dark red, n = 28/dark blue, n = 18) or decreases (yellow, n = 10/cyan n = 2) during the poststimulus epoch. Excitation (z = 2.65, p < 0.001; Mann–Whitney U) but not inhibition (rank sum = 63, p > 0.05) was greater for RS than NS. D, Mean Z-scores for individual neurons in RS (x-axis) and NS (y-axis) conditions. Open circles represent nonsignificantly modulated neurons. Filled circles represent neurons exhibiting significant excitatory or inhibitory responses in RS/NS conditions (colors as in C). Neurons significantly modulated in RS and NS conditions are magenta. Unity line represents equivalent activity. Neurons to the right of the line were more excited in RS or inhibited in NS conditions. Neurons to the left of the line were more excited in NS and inhibited in RS conditions.
Figure 3.

RS-evoked OFC activity was strongly associated with initiation of reward-seeking behavior. A, Mean Z-score activity for all recorded neurons (n = 89) aligned on RS response initiation (based on video analysis) at time 0 (solid vertical line). Dashed line represents approximate time of RS onset based on median reaction times. RS Go (black trace) is aligned on behavioral response initiation. NS “Go” (gray line) is aligned on time points in NS trials derived from behavioral response initiation in RS trials such that each RS Go generated a matched NS Go. This allowed comparison of the same distribution of times in RS and NS trials despite NS trials having no response initiation. B, Mean amount of change in Z-score in either the 500 ms Pre-RS Go epoch or the 500 ms Post-RS Go epoch. Note that in neurons either excited (dark red line) or inhibited (yellow line), the onset of change occurred more frequently (greater magnitude change) Pre-RS Go (left) compared with Post-RS Go (right). This finding indicates that the onset of RS-evoked neural response occurred before initiation of RS-Go, supporting a role for OFC in initiation of reward seeking. C, Mean Z-scores for individual neurons in press (x-axis) and withhold (y-axis) conditions in RS- (C1, top) and NS- (C2, bottom) presentation trials. Colors as in Figure 2. Neurons excited by press and withhold are shown in magenta. Other combinations (e.g., excited in press, inhibited in withhold) are shown as color combinations (e.g., dark red/cyan). C1 (top): Significant excitation (z = 3.03, p < 0.005, Mann–Whitney U) and inhibition (z = 4.26, p ≪ 0.0001) was stronger for RS-press than RS-withhold. C2 (bottom): Significant excitation (z = 2.31, p < 0.05) but not inhibition (z = 1.89, p = 0.06) was stronger for NS-withhold than NS press. Note that more neurons appear significantly influenced by RS/NS press and withhold than RS or NS presentation (Fig. 5B for numbers in comparison with extinction) due to the relatively less stringent criteria for statistical significance in comparing uneven numbers of trials (see Materials and Methods). D, Mean RS-evoked Z-scores for all recorded neurons aligned on RS onset and sorted based on trials in which animals pressed the lever (RS On Press, black) or withheld response (RS On With, gray). Responses were much stronger for RS presentations followed by a lever press (z = 2.248, p < 0.05, Wilcoxon signed rank). E, Mean NS-evoked Z-scores for all NS-excited neurons aligned on NS onset and sorted based on trials in which animals pressed the lever (NS On Press, black) or withheld response (NS On With, gray). Excitatory responses were slightly, but significantly stronger for NS presentations followed by a withheld lever press (z = 2.31, p < 0.05, Wilcoxon signed rank). F, Mean Z-score activity for all recorded neurons aligned on RS (black) and NS (gray) lever press shows that lever press related activity changes were minor compared with RS onset (left-most red arrow) or well entry (right-most red arrow). G, Mean Z-scores for all recorded neurons (n = 89) aligned on well entry during DS-sucrose, including the period when animals are consuming sucrose. Black: well entry-related activity following RS presentation and lever press; gray: all other (non-RS-evoked) well entries. H, Mean activity at the time of well entry (x-axis) was highly correlated with mean activity at the time of response initiation (y-axis) in individual neurons.
Of 89 recorded neurons, 38 (42.7%) were significantly modulated by RS (Fig. 2). Approximately half as many neurons were modulated by NS (n = 20), significantly fewer than by RS (p < 0.01, Fisher's exact test). Of the modulated neurons, 28 and 18 were excited by RS and NS respectively (p > 0.05, Fisher's exact test), and 10 and 2 were inhibited (p < 0.05, Fisher's exact test). Significant responses are plotted in Figure 2C,D and counts of neurons are shown in Figure 4B (for comparison with extinction). As shown in Figure 2D, most neurons were selectively modulated by RS (not modulated by NS; 16 excited, 10 inhibited). Another subset was modulated by both (12 excited, 0 inhibited), and a minority were selectively modulated by NS (6 excited, 2 inhibited). In general, therefore, neurons were more frequently selectively modulated by RS than NS, though a number of neurons were NS-modulated.
Figure 4.
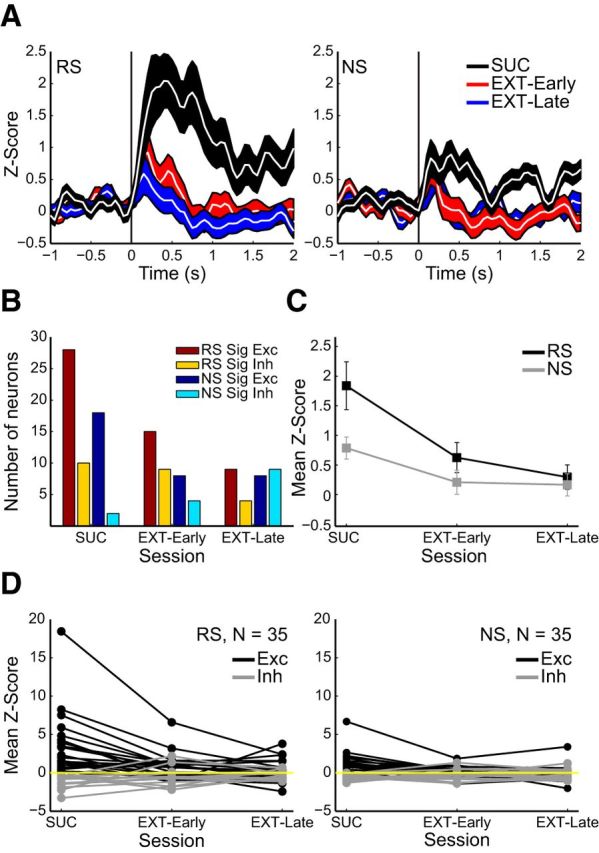
Stimulus-evoked OFC responses decreased during extinction. A, Z-scores aligned on RS (left) and NS (right) during DS-sucrose (black, n = 89), early extinction session (days 1 and 2; red, n = 90) and late extinction sessions (days 3 and 4, blue, n = 87). B, Numbers of neurons exhibiting significant excitatory/inhibitory evoked responses to RS and NS presentation during DS-sucrose and extinction. Dark red/yellow bars = numbers of neurons significantly excited/inhibited by RS. Dark blue/cyan bars = numbers of neurons significantly excited/inhibited by NS. C, Mean Z-scores evoked by RS (χ2(2,263) = 9.99, p < 0.01, Kruskal–Wallis) and NS (χ2(2,263) = 12.08, p < 0.01) decreased between DS-sucrose and extinction. D, Responses of individual neurons recorded across all five sessions in response to RS (left) and DS (right) presentation. Both RS and NS stimulus-excited (black; RS: χ2(2,40) = 17.24, p < 0.001; NS: χ2(2,38) = 26.8, p ≪ 0.001) and RS but not NS stimulus-inhibited neurons (gray; RS: χ2(2,26) = 13, p < 0.005; NS: χ2(2,28) = 3.73, p > 0.05) showed decreased strength of evoked responses during extinction.
The overall strength of responses for modulated neurons was significantly greater for RS than for NS trials (Fig. 2B–D). Neurons significantly excited by RS had larger responses than those excited for NS (Fig. 2C,D). Even neurons significantly excited by NS were more strongly excited by RS presentation (z = 2.16, p < 0.05; Fig. 2D, magenta circles). There was no difference between significantly inhibited neuronal responses to RS versus NS, primarily because only two neurons were inhibited by NS presentation (Fig. 2D). Thus, OFC neurons responded most frequently and robustly on trials that predicted reward. The fact that a subset of neurons responded to NS in addition to RS presentation indicates that some OFC neurons may multiplex different forms of information (e.g., stimulus salience, reward prediction), although the strongest influence on activity was most directly related to reward.
OFC neurons selectively responded for RS-driven response initiation
We characterized the responses of OFC neurons aligned on the initiation of reward-seeking (i.e., orientation toward the RS lever, based on video analyses described previously). As shown on the population histogram aligned on response initiation (RS Go; Fig. 3A), onset of activity occurred almost immediately after stimulus onset (50–100 ms after RS On; Fig. 3A) and increased before, and peaked around the time of response initiation (100 ms postinitiation). This can also be seen in the single-unit example in Figure 2A. Across all neurons we defined, on a trial-by-trial basis, an epoch extending from post-RS onset to initiation of reward-seeking. We used this epoch for statistical analysis of cued preresponse OFC activity. During this short epoch, we found that the firing rate of 26 neurons was significantly modulated (16 excited, 10 inhibited). Of course, this analysis was not possible for NS presentations since these presentations largely did not evoke a behavioral response. However, we approximated this epoch by applying trial-based response initiation times from RS trials to NS trials; therefore, each NS trial had a “response initiation” based on a matched RS trial. This epoch was then used to calculate significant responses. In these circumstances, 12 neurons showed significant changes in firing rate (8 excited, 4 inhibited). Thus, although more (approximately twice as many) OFC neurons exhibit activity related to initiation of reward-seeking, a small population of neurons encoded salient stimuli independent of behavioral response, consistent with the differences in activity shown in Figure 2.
These results indicate that more than two thirds of the neurons characterized as significantly modulated in our original 100–600 ms post-RS epoch (26/38) exhibited significant changes in firing rate preceding the onset of the behavioral response. However, this type of analysis ignores changes in firing that began before initiation of the behavioral response and may have peaked postresponse. To address this issue, we focused on the 38 neurons that exhibited significant modulation post-RS. We calculated the change in firing in each 50 ms time bin by subtracting activity in bin n from activity in bin n + 1. We then compared mean strength of changes in activity 500 ms before the initiation of the behavior to mean strength of changes in activity 500 ms after the initiation of the behavior and found that in almost all cases (33/38) the change in activity was greater before the response initiation than after (Fig. 3B; excited: z = 3.35, p < 0.001; inhibited, signed rank = 0, p < 0.005). Similar results were found if we used shorter durations, preresponse and postresponse initiation (e.g., 29/38 for 250 ms). We conclude from these results that the onset of activity observed following RS presentation before lever response is strongly related to the subsequent reward-seeking behavioral response.
We confirmed this observation by analyzing RS-evoked activity based on whether the rats responded to the RS lever. We included only recording sessions containing both RS-press and RS-withhold trials. These analyses revealed that RS-evoked activity during DS-sucrose was strongly modulated by whether the rat pressed or withheld pressing (Fig. 3C,D). Mean OFC responses across the population of all recorded neurons were significantly greater for RS-press than RS-withhold (Fig. 3C, D). Responses of neurons significantly excited by RS-press were dramatically and significantly stronger than those of neurons significantly excited by RS-withhold (Fig. 3C). Neuronal inhibition was also significantly stronger in RS-press compared with RS-withhold. Thus, across both excited and inhibited OFC neurons, the strength of response was greater when RS presentation resulted in a lever press than when it did not.
Rats rarely pressed the NS lever (Fig. 1). However, we compared NS evoked responses sorted by whether or not animals pressed the NS lever, based on trial-averaged Z-scores (see Materials and Methods). We found that mean OFC activity across the whole population was similar for NS presentations resulting in no press versus those resulting in a press (Fig. 3C; z = 1.21, p > 0.05). However, analysis of only neurons that exhibited an excitatory response to the NS (n = 56/89) revealed significantly stronger excitation for withholding a response to the NS (Fig. 3C,E; z = 2.31, p < 0.05). This selectivity was not seen in neurons inhibited by NS presentation. In keeping with the overall stronger RS modulation of OFC activity, the difference between RS press and withhold was greater than NS press versus withhold (Fig. 3C1, top vs C2, bottom). Thus, we observed a small, but significant enhancement of excitatory responses in OFC neurons when a behavioral response was inhibited following a stimulus that predicted no reward. This may reflect a contribution of OFC toward response inhibition or may reflect an influence of enhanced attention in NS-withhold versus NS-respond trials.
OFC neuronal activity related to lever press was moderate and selective for reward-seeking
We also analyzed neural activity related to lever press (Fig. 3F) and to well entry/reward consumption (Fig. 3G,H). Mean press-related activity across the population was modestly modulated around the time of the press (Fig. 3F; note little fluctuation around Time = 0). Despite moderate changes in overall press-related signaling, 24 neurons exhibited significant modulation (13 excited, 11 inhibited) in a peri-press epoch (−250 to 250 ms) compared with an epoch −1000 to −500 ms preceding the press. Importantly, lever press-related activity was selective for rewarded lever presses (Fig. 3F) and no neurons exhibited significant modulation for nonrewarded presses. In Figure 3F we illustrate that neural activity changed dramatically both at the approximate time of RS/NS onset and also at the approximate time of well entry (see above; Fig. 3G). This underscores the finding that OFC neurons were most activated by the initiation of each reward-seeking behavior (initiate lever-seeking and initiate well-seeking), and less by the actual lever press itself.
Neurons also displayed robust changes in activity at the time of the reward-well entry (Fig. 3G; ∼0 s) and during reward consumption (∼1–9 s). Neurons were predominantly excited around the time of rewarded well entry during DS-sucrose (21 excited and 13 inhibited neurons). Neurons were also significantly modulated for nonrewarded well entries, though the number of neurons (14 and 9 significantly excited and inhibited) was smaller and the magnitude of change was significantly lower (Fig. 3G; z = 5.51, p ≪ 0.001, Wilcoxon signed rank). Neurons that exhibited changes in activity for lever response initiation exhibited similar changes at the time of well entry (Fig. 3H). We found a strong and significant correlation across single neurons for mean activity at lever response initiation (250 ms pre-response to 750 ms postresponse initiation) and mean well entry activity (500 ms pre-well entry to 500 ms post-well entry). Thus, neurons that signaled lever response initiation also signaled well response initiation, arguing for a general role for OFC neurons in initiating reward seeking behaviors.
We also observed a long-lasting decrease in mean activity during reward consumption in DS-sucrose trials (Fig. 3G). This decrease across the population was significant compared with pre-well entry baseline (z = 3.85, p < 0.001) and was not observed for nonrewarded well entries or well entries during extinction sessions (see below; Fig. 5; all p > 0.05). This decrease in OFC activity therefore closely corresponded with reward consumption. Although not absolute, these data argue that increases in OFC activity are more related to the initiation of reward pursuit and decreases may be more related to reward acquisition/consumption.
Figure 5.
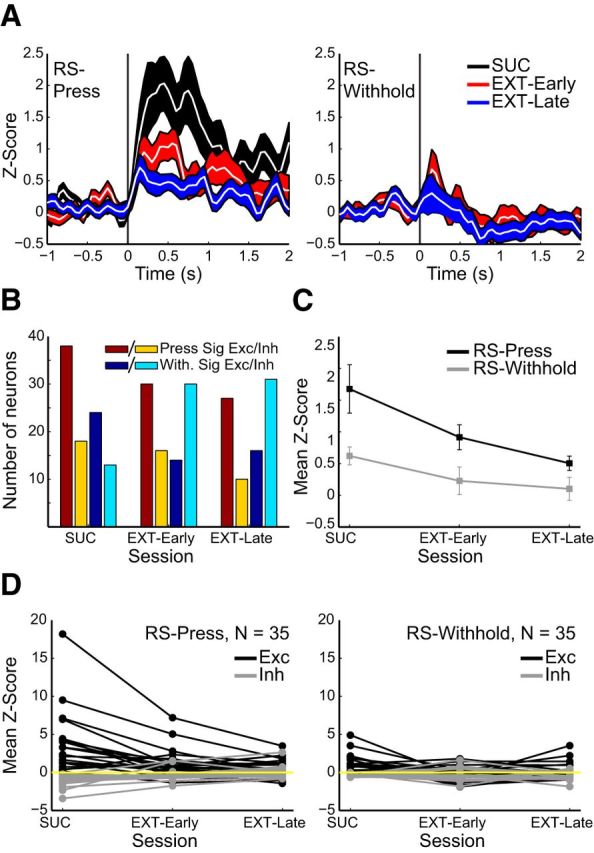
OFC responses to RS presentation that resulted in a lever press (RS-Press) decreased during extinction. A, Z-scores aligned on RS-Press (left) and RS presentations resulting in a withheld response (RS-Withhold, right) during DS-sucrose (black), early extinction session (days 1 and 2; red) and late extinction sessions (days 3 and 4, blue). B, Numbers of neurons that exhibited significant excitatory or inhibitory evoked responses to RS-Press or RS-Withhold during DS-sucrose and extinction. Dark red/yellow bars = numbers of neurons significantly excited/inhibited by RS followed by lever press. Dark blue/cyan bars = numbers of neurons significantly excited/inhibited by RS followed by withheld press. C, Mean Z-scores evoked by RS-Press and RS-Withhold during DS-sucrose and extinction. D, Responses of individual neurons recorded across all five sessions in response to RS-Press (left) or RS-Withhold (right) presentation. RS-Press-excited (black; χ2(2,38) = 17.2, p < 0.001) and RS-Press-inhibited neurons (gray; χ2(2,28) = 20.93, p ≪ 0.001) showed decreased RS-Press-evoked responses during extinction. RS-Withhold-excited (χ2(2,38) = 10.80, p < 0.005), but not-inhibited (χ2(2,28) = 0.93, p > 0.05) responses decreased over extinction.
OFC responses to RS diminished across extinction
OFC responses to RS decreased across extinction days (Fig. 4A–C). The number of neurons significantly excited by RS decreased over extinction (Fig. 4B; early: 15/90; late: 9/87), as did those excited by NS (early: 8/90; late: 8/87). The number of neurons significantly inhibited by RS decreased (early: 9/90; late: 4/87) and those inhibited by NS presentation increased slightly (early: 4/90, late: 9/87). Overall, there were fewer significantly modulated neurons, excited or inhibited, during late extinction.
The overall decrease in strength of RS-evoked activity between DS-sucrose and extinction days was significant (Fig. 4A,C). This was true for evoked responses in early extinction (z = 2.27, p < 0.05; Mann–Whitney U) and late extinction (z = 3.05, p < 0.005) compared with RS responses in DS-sucrose. There were no significant differences in evoked responses between early and late extinction (z = 0.71, p > 0.05). Mean responses to NS presentation also decreased slightly, but significantly (Fig. 4C). The decrease in strength of significantly RS-excited neurons almost reached significance (χ2(2,49) = 5.26, p = 0.07 Kruskal–Wallis), and the difference in response strength between DS-sucrose and late extinction was significant (z = 2.07, p < 0.05, Mann–Whitney U). Neurons significantly excited by NS showed no significant change in strength across extinction (χ2(2,31) = 1.30, p = 0.52), nor did neurons significantly inhibited by either RS (χ2(2,20) = 3.62, p > 0.05) or by NS (χ2(2,12) = 4.39, p > 0.05).
Thus, overall the number of RS-responsive neurons decreased by approximately one-half and two-thirds in early and late extinction respectively, and the overall signaling strength across the population was weaker in extinction than during task performance. These results indicate an overall diminution of the robust RS-evoked OFC signals across extinction. Although NS responses were relatively mild in comparison, they largely decreased across extinction, consistent with the view that OFC neuronal activity may represent both reward value/pursuit as well as onset of salient stimuli.
Individual OFC neurons decreased responding from DS-sucrose to extinction
We also characterized the response profiles of a subset of neurons recorded across all three epochs (DS-sucrose, early extinction, and late extinction), as indicated on recording channels that maintained the same number of units with the same waveforms across recording sessions. We verified for 35 neurons that fulfilled these criteria that the predominant change in signaling from DS-sucrose through extinction was decreased responding, rather than one population decreasing and another increasing activity (Fig. 4D). RS-evoked activity in these neurons decreased significantly across extinction (Fig. 4D, left). This was not observed when considering the population as a whole (χ2(2,68) = 1.2, p > 0.05, Friedman's test) due to decreases in strength of both excitation and inhibition. However, activity in RS-excited neurons (mean Z-score >0 in DS-sucrose, n = 21) was strongly and significantly diminished across extinction. Similarly, the strength of inhibitory responses in RS-press inhibited neurons (mean Z-score <0 in DS-sucrose, n = 14) was significantly reduced across extinction. NS-evoked responses decreased more subtly but significantly across extinction (χ2(2,68) = 8.23, p < 0.05; Fig. 5D, right), driven by changes in NS-excited, but not NS-inhibited, neurons.
Similar to the responses for all RS presentations (Fig. 4), activity related to RS presentations that produced a lever press diminished over extinction (Fig. 5). The number of neurons significantly excited and inhibited for RS-press decreased over extinction, as did the number of significantly excited RS-withhold neurons, to a lesser degree (Fig. 5B). The number of neurons significantly inhibited by RS-withhold actually increased over extinction.
Mean RS-evoked response magnitudes in RS-press trials also decreased between DS-sucrose and extinction (Fig. 5C). However, this decrease was not significant (χ2(2,263) = 1.32, p > 0.05; Kruskal–Wallis), likely due to cancellation between excitatory and inhibitory responses during DS-sucrose (Fig. 5D, left). However, neurons excited by RS-press decreased in response magnitude significantly between DS-sucrose and extinction (χ2(2,159) = 11.79, p < 0.005). Neurons inhibited by RS-press did not change response magnitudes (χ2(2,88) = 4.96, p > 0.05). Response magnitudes were not different between early and late extinction for either excited or inhibited neurons (z = 0.45, p > 0.05). Mean RS-evoked responses in withhold trials decreased subtly but significantly during extinction (χ2(2,258) = 15.87, p ≪ 0.001). Intriguingly, this effect was not seen in neurons excited by RS-withhold (χ2(2,121) = 0.67, p > 0.05), but neurons inhibited by RS-withhold were more strongly inhibited in extinction compared with DS-sucrose (χ2(2,134) = 18.74, p ≪ 0.001). Thus, neurons excited when RS produced a lever press decreased firing across extinction whereas neurons inhibited by RS followed by a withheld lever press showed increased inhibition over extinction.
Similar results were observed for individual neurons recorded across DS-sucrose and extinction sessions (Fig. 5D) Neural activity on RS-press trials decreased over the course of extinction (Fig. 5D, left), though this was not significant (χ2(2,68) = 0.06, p > 0.05; Friedman's Test); again, this was probably due to averaging excitatory and inhibitory neuronal responses. Excited neurons displayed significantly decreased RS-evoked responses over extinction and inhibited neurons exhibited significantly decreased inhibition (Fig. 5D, left). The mild responses on RS-withhold trials also decreased subtly, though significantly, over extinction (Fig. 5D, right; χ2(2,68) = 7.60, p < 0.05). Excitatory responses decreased significantly but there were no changes in inhibitory responses.
Thus, on the whole, OFC responses decreased across extinction. This effect was most prominent for neural responses to RS that elicited a lever press. There are two important details to consider in this regard. First, OFC activity on NS trials decreased over extinction, consistent with a salience/attentional component of activity in at least some OFC neurons during reward-seeking. Second, activity on RS-press trials decreased over extinction. This indicates that reward-seeking in a nonrewarded situation (here during extinction) minimally drives OFC activity, consistent with other evidence for a strong reward-prediction signal in OFC independent of eventual motor output.
Decreases in RS-evoked OFC responses followed decreases in lever responding
In each extinction session we characterized OFC activity in a trial-by-trial fashion to determine the time course of altered RS signaling during extinction (Fig. 6). For each neuron we calculated the rate of decrease in lever pressing and the rate of decrease in RS-evoked activity by plotting the cumulative summation of both lever presses and mean RS-evoked activity (Fig. 6C). Cumulative sums were normalized against maxima to generate equivalent curves that could be compared, so both lever press and neural activity cumulative sum curves had a maximum of 1 (see Materials and Methods). As exemplified by the single neuron in Figure 6, both lever pressing and OFC activity decreased across trials within extinction sessions. We compared the rates of decrease to determine whether decreases in lever pressing preceded or followed decreases in OFC activity (Fig. 6C). We found that decreases in OFC activity followed decreases in lever pressing across the majority of neurons: 74% versus 26% of 164 neurons measured across all extinction sessions exhibited trial-to-trial decreases in activity that lagged behind versus led decreases in lever-press behavior (Fig. 6D). Of these 164 neurons, 55% (91) and 15% (25) exhibited significant lagging versus leading (Fig. 6D; Kolmogorov–Smirnov performed on cumulative sums, p < 0.05). Thus, although lever press behavior varied somewhat over the course of each extinction session, the main trend observed was that RS-evoked OFC responses decreased at a slower rate than did lever pressing. This finding is consistent with a minor influence of OFC activity on the actual extinction process itself, and rather, likely reflects a general decrease in motivated reward-seeking.
Figure 6.
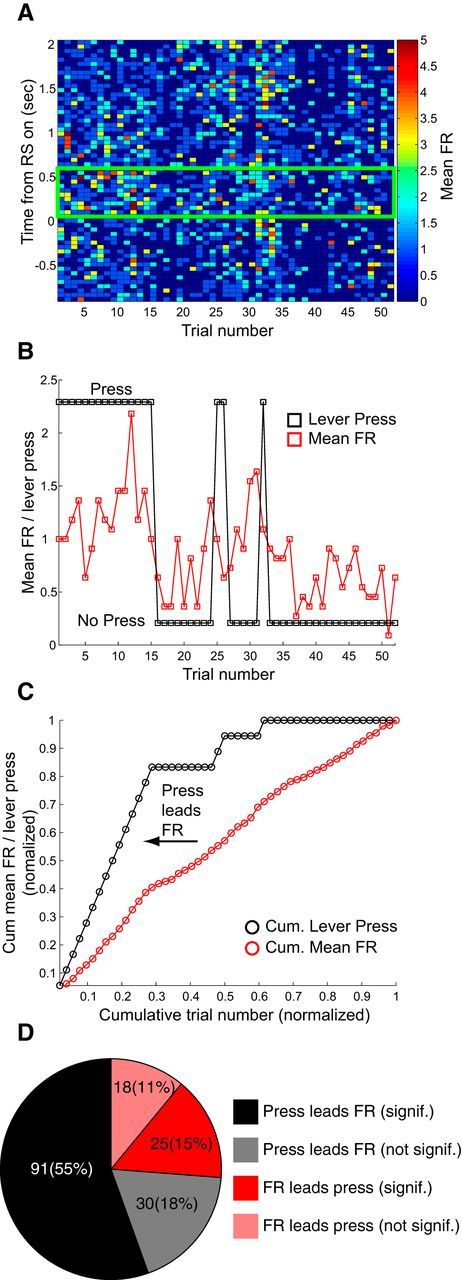
Decreases in lever pressing preceded decreases in RS-evoked OFC activity over the course of individual extinction sessions. A, Trial-by-trial activity of a single OFC neuron (in 50 ms bins) recorded on Extinction Day 1. Activity −1 to +2 s surrounding RS presentation is shown on the y-axis. Activity across trials is shown on the x-axis. Firing rate is represented by pseudocolor heat intensity (right, colored bar). Green box indicates time period of analysis corresponding to peak of activity during DS-sucrose (100–600 ms post-RS). B, Mean trial-by-trial activity from the same neuron as (A) across trials averaged across the epoch in the green box in (A). Red squares/lines indicate mean firing rate. Black squares/lines indicate whether or not the animal pressed the lever on each trial (high = press, low = no press). It is clear from both A and B that activity declined over the course of extinction trials but that activity followed lever-press behavior, and that activity declined at a slower rate than did lever pressing. C, Analysis of the trial-by-trial relationship between lever-press and firing rate for the same neuron in A and B. Cumulative sums are plotted across trials for both lever presses (black) and mean firing rate (red). Number of presses and mean firing rate were both normalized to their totals for that epoch to facilitate comparison. Curves were compared to determine whether lever press behavior decreased faster than RS-evoked activity (press curves shifted to the left of firing rate curves) or whether RS-evoked activity decreased faster than lever press behavior (firing rate curves shifted to the left of press curves). In this example, decreases in lever pressing preceded decreases in mean RS-evoked firing rate. D, Pie chart shows the overall proportions/numbers of neurons that either led (red/pale red) or lagged (black/gray) lever-press behavior across all four extinction days. Dark colors (red and black) indicate neurons significantly leading or lagging pressing behavior. Light colors (pale red and gray) indicate neurons that led or lagged, but not significantly. The majority of neurons displayed decreases in activity that lagged lever press behavior.
We also measured whether OFC activity was elevated during the initial stages of extinction, as might be expected if OFC neurons signaled the salience resulting from the RS changing from predicting rewarded to nonrewarded outcomes (Ogawa et al., 2013). We divided sessions into four blocks of 12 trials each and compared RS-evoked activity in the first block of DS-sucrose to the first block of Extinction Day 1. Mean lever-press behavior was similar across the two sessions in block 1 (DS-sucrose: 92.1% RS-presentations were followed by lever presses; Extinction Day 1: 81.1% RS-presentations were followed by lever presses). This similarity means that animals continued to attend to the RS and press the lever during the first one-fourth of Extinction Day 1. RS-evoked OFC activity was also similar in the first one-fourth of DS-sucrose and Extinction Day 1 (mean firing: z = 0.39, p > 0.05; Z-score: z = 0.19, p > 0.05, Mann–Whitney). This lack of difference indicates that any enhanced salience resulting from a change from rewarded to nonrewarded RS in Extinction Day 1 did not influence OFC activity.
OFC responses at well entry and during sucrose consumption decreased across extinction sessions
OFC neurons were excited before rewarded well entry, and were inhibited during sucrose consumption (Figs. 3G, 7). Over the course of extinction, these neural responses decreased for both well entry and reward consumption (Fig. 7). The decrease in activity at the time of well entry following RS-press during extinction was significant, as was the decrease in activity at the time of well entries without presses (Fig. 7B). Decreases in activity during reward consumption diminished significantly over the course of extinction (Fig. 7C), likely due to the absence of reward delivery. Thus, activity related to initiation of well entry declined over the course of extinction along with activity related to initiation of lever response. Combined, these data argue that, despite the mechanics of reward-seeking being engaged, OFC activity is decreased when reward expectation is extinguished.
Figure 7.
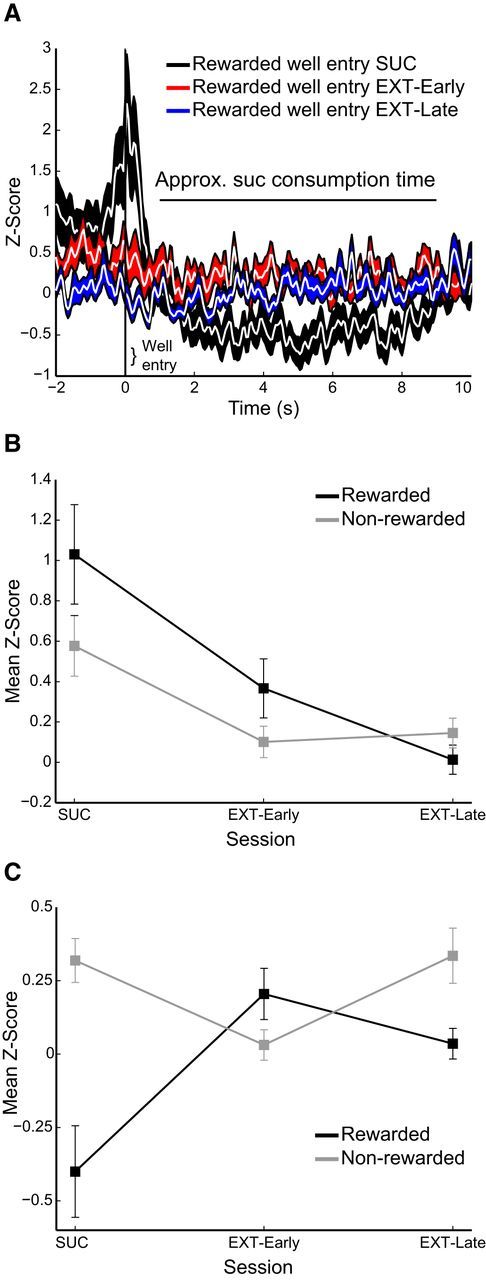
OFC activity related to well entry following a lever press (“rewarded” well entry) was absent during extinction, as was consumption epoch-related inhibition of activity. A, OFC activity aligned on well entry following RS lever press during DS-sucrose (black, n = 89), early extinction (red, n = 90), and late extinction (blue, n = 87). B, Mean activity at the time of well entry following RS lever press (rewarded) and all other well entries (“Nonrewarded”) during DS-sucrose, early extinction, and late extinction. Decreases in well entry neural responses over extinction were significant (rewarded: χ2(2,263) = 10.01, p < 0.01; nonrewarded: χ2(2,263) = 9.26, p < 0.01). C, Mean activity during the ∼8 s post-well entry/reward consumption period in DS-sucrose (“Approx. suc consumption time”). Activity was reduced during reward consumption in DS-sucrose but not any other post-well entry time (nonrewarded well entries or rewarded well entries during extinction when no sucrose was delivered: χ2(2,263) = 10.55, p < 0.01).
OFC activity tracked the RS during task reversal
Finally, we recorded OFC activity during a reversal task in a subset of animals (3 rats, 58 neurons). Neural activity was greater for RS than NS both before and after reversal (Fig. 8A). Mean evoked RS and NS responses were not significantly different (pre-reversal: z = 0.46, p > 0.05; postreversal: z = 1.02, p > 0.05), due to averaging of excitatory and inhibitory responses. However, differences between absolute values of RS and NS Z-scores were significant (pre-reversal: z = 2.69, p < 0.01; postreversal: z = 2.81, p = 0.005). Importantly, there were no significant differences in RS or NS signaling pre-reversal versus postreversal (RS: pre-reversal vs postreversal: z = 0.31, p > 0.05; NS: pre-reversal vs postreversal: z = 1.06, p > 0.05), even when absolute-value measures were considered (RS: z = 1.46, p > 0.05; NS: z = 1.41, p > 0.05). We plotted mean poststimulus activity pre-reversal versus postreversal for RS and NS presentation (Fig. 8B) and found a significant correlation between activity prereversal and postreversal for both RS and NS. Thus, both RS and NS presentation affected neurons similarly pre-reversal versus postreversal, and regardless of RS or NS lever position. These data are consistent with a role for OFC activity in driving the initiation of reward-seeking behaviors.
Figure 8.
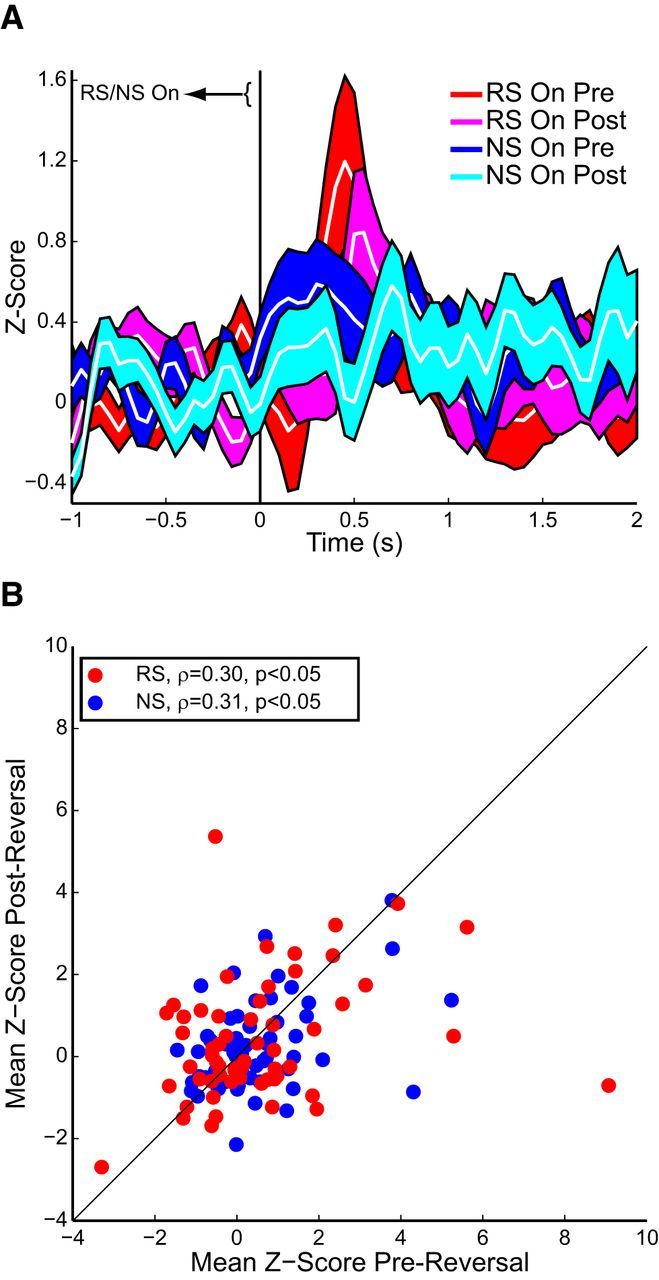
Stimulus-evoked OFC responses were strongest for RS versus NS both before and after reversing the positions of the RS/NS levers (n = 58 neurons from 3 rats). A, OFC activity aligned to RS (red/magenta) or NS (blue/cyan) presentation before (red/blue) or after (magenta/cyan) reversal. B, Mean evoked responses to both RS (red) and NS (blue) were correlated pre-reversal and postreversal.
Discussion
Here we demonstrated a strong relationship between OFC activity and reward-seeking, consistent with previous results (Roesch and Olson, 2004; Mainen and Kepecs, 2009; Schoenbaum et al., 2011; Noonan et al., 2012; Wallis, 2012), and a limited association between OFC activity and response inhibition or extinction. OFC responses were maximal following stimulus presentations that both: (1) validly predicted reward and (2) elicited reward-seeking behavior. Neither of these alone (reward prediction without a behavioral response during DS-sucrose, or lever press without a reward-predicting stimulus in either DS-sucrose or extinction) drove OFC responses. Activity elicited by reward-predicting stimuli was strongly associated with the orientation and initiation of movement to the rewarded lever (response initiation), and less related to the press itself. This supports lever press-related OFC activity seen in previous instrumental reward-seeing studies in which the lever press response was self-initiated (Kravitz and Peoples, 2008). Activity also increased as animals initiated well entry-directed behaviors, and this was correlated with response initiation-related activity. These data demonstrate that OFC neurons encode the expectation of reward delivery, consistent with previous findings, but further show that OFC activity is strongest at the initiation of individual reward-seeking behaviors, including those chained together to obtain reward.
OFC neurons responded modestly to stimuli that did not result in reward. This was similar for NSs, RSs during extinction, and RSs during DS-sucrose when the animals did not respond. Thus, a subset of neurons encoded salient stimuli regardless of their value prediction. NS-evoked activity was slightly but significantly stronger when animals withheld versus initiated responses (Fig. 3E), potentially indicating that response inhibition is encoded in some OFC neurons. However, activity was minimal when animals correctly withheld responding to the extinguished RS, arguing against a primary role for OFC in driving response inhibition. This enhancement during withholding may also represent an attentional signal that is present in addition to reward-related signaling. However, during extinction trials when animals responded to the RS (accurate stimulus detection), activity was reduced, indicating a minor influence of attention on OFC firing. We hypothesize that some OFC responses may reflect cue salience or attention (Ogawa et al., 2013), but that the majority of neuronal responses are maximal for reward-predicting stimuli (Tremblay and Schultz, 1999; Roesch et al., 2010; Padoa-Schioppa and Cai, 2011).
Minimal activation on NS trials and during extinction argues against an explicit representation of either response inhibition or extinction learning in OFC neurons, in line with previous studies (Burke et al., 2008; Schoenbaum et al., 2009; McDannald et al., 2012). Specifically, OFC neurons do not increase activity during the presentation of the NS or extinguished RS as neurons in infralimbic cortex do in fear-extinction studies (Milad and Quirk, 2002). This does not negate other potential ways of encoding response inhibition such as correlated or differential activation across populations or active inhibition of previously evoked responses. Recent work has shown decreased OFC signaling for extinguished compound, but not noncompound, reward-predicting stimuli (Takahashi et al., 2013), which in part supports our observations. Task differences preclude direct comparisons between this study and ours, although in both studies extinction of the most salient and/or rewarding stimulus resulted in decreased OFC activity.
There is considerable interest in the relationships among risk, confidence, salience, and reward signaling, particularly in OFC and related brain regions (Kepecs et al., 2008; van Duuren et al., 2009; O'Neill and Schultz, 2010; Roitman and Roitman, 2010; Padoa-Schioppa, 2011; Wallis, 2012; Ogawa et al., 2013). OFC neurons that appear to fire for risky conditions (e.g., reward probabilities of 33 and 67%) may actually encode heightened salience resulting from reward unpredictability (Ogawa et al., 2013), in line with models that combine reward prediction and uncertainty (Mackintosh, 1975; Pearce and Hall, 1980) in the framework of attentional salience (Esber and Haselgrove, 2011). Our data are consistent with the predictions of such models and the associated data. During extinction, activity declined as the RS-reward association decreased, supporting the idea that reward-driven salience is encoded in OFC neurons, and that cues predicting reward are more salient than those predicting no reward. However, our data also argue against the strict hypothesis that OFC neurons exclusively encode acquired salience. As noted above, neural activity related to salient stimuli not resulting in a reward was minimal, even when the animal responded to the cue (i.e., responses to NSs and extinguished RSs). More directly, in early extinction, the unexpected outcome of no reward following RS presentation was likely highly salient, particularly on Extinction Day 1. The unexpected absence of reward is somewhat analogous to the 33 and 67% conditions described by Ogawa et al. (2013) and is predicted by Esber and Haselgrove (2011) to produce a transient increase in cue salience. However, we found no significant elevation in OFC responses in early extinction and overall decreased responses as reward-seeking declined. One possible solution to this discrepancy is to consider the results of Ogawa et al. (2013) from the perspective of initiation of reward-seeking. In that study, reward-seeking (licking) was high and response latency was low in the high-risk/high-salience conditions (i.e., 33 and 67%), and OFC activity was well-correlated with these behavioral changes. These data align well with our finding that OFC neurons encode initiation of reward-seeking. An important future direction is to dissociate the influence of reward seeking versus acquired salience on OFC signaling.
We did not test whether negative outcome expectancy is specifically encoded by OFC neurons. However, responses were weaker when events reliably did not happen (e.g., 0% probability of reward predicted by NS or RS in extinction), arguing that expectancy or confidence encoding by OFC neurons is restricted to subsets of outcomes. Our experimental design provided a less-direct interrogation of confidence or certainty than previous studies (Kepecs et al., 2008; van Duuren et al., 2009; O'Neill and Schultz, 2010; Roitman and Roitman, 2010; Ogawa et al., 2013). However, during DS-sucrose, neurons fired strongly for 100% reward probability (RS) and weakly for 0% probability (NS), which is in line, broadly, with studies demonstrating value coding in OFC neurons (Tremblay and Schultz, 1999; Roesch and Olson, 2004; Padoa-Schioppa, 2007; O'Neill and Schultz, 2010; but see van Duuren et al., 2009 for counterexamples). During extinction, both RS and NS cued 0% reward probability, and neuronal firing was minimal, particularly during late extinction when reward-seeking behavior was rare. Thus, though coarsely addressing confidence or outcome probability, our results support a straightforward association between OFC activity and reward outcome.
We verified that RS-evoked activity was independent of spatial or sensory attributes (Feierstein et al., 2006; Roesch et al., 2006) by demonstrating that neural responses remained RS-selective after reversing the RS and NS contingencies. The reversal of OFC responses aligns with other studies that have posited a role for OFC in reversal behavior (Chudasama and Robbins, 2003; McAlonan and Brown, 2003; Kim and Ragozzino, 2005; Burke et al., 2009). In contrast, reversal of outcome-predicting odors disrupted OFC response selectivity (Schoenbaum et al., 1999; Roesch et al., 2007). Task differences may explain the discrepant findings. Behaviors in our study were instrumental and stimuli had a spatial component (as opposed to odor-based Pavlovian stimuli in other studies). Reversal studies by Rolls and colleagues demonstrated that a greater proportion of primate OFC neurons reversed selectivity for visual (i.e., more spatial) than olfactory (i.e., less spatial) stimuli (Rolls et al., 1996). Further investigations using different types of tasks are needed to understand the role of OFC neuronal function in behavioral change and flexibility.
The factors that drove OFC activity in our task, reward-predicting cues that triggered initiation of reward-seeking, also influence nucleus accumbens (NAc) neurons during a similar DS task (Nicola et al., 2004a,b; Yun et al., 2004; Ishikawa et al., 2008; Ambroggi et al., 2011). NAc responses related to reward-seeking also decrease over the course of extinction, in line with our extinction findings (Carelli and Ijames, 2000; Hollander et al., 2002; Ghazizadeh et al., 2012; but see Ghitza et al., 2003; Hollander and Carelli, 2007). These similarities may reflect a circuit involving OFC and NAc that regulates these behaviors, anatomically demonstrated by robust retrograde labeling in the lateral OFC and agranular insular cortex from injections in the NAc core (Reynolds and Zahm, 2005). Other studies, however, found almost no projections from lateral OFC to NAc (Schilman et al., 2008). Regardless, our results tentatively support a functional, if not structural, interaction. Additional interactions across OFC, medial prefrontal cortex (mPFC) and basolateral amygdala (BLA) may also play an important role in execution and extinction of reward-seeking (Peters et al., 2005, 2009), given the strong connectivity among these areas (Krettek and Price, 1977; McDonald, 1991a,b; Wright et al., 1996; Schoenbaum et al., 1998, 1999, 2000; Shi and Cassell, 1998; Saddoris et al., 2005). However, BLA neurons were less selective for rewarded versus nonrewarded stimuli than OFC neurons (Ambroggi et al., 2008), and a sizeable subset of BLA neurons showed enhanced responding during extinction (Tye et al., 2010) indicating that mPFC may be an important region to explore with respect to these behaviors.
Footnotes
This work was supported by PHS Grants R21-DA032005, P50-DA015369, R37-DA06214, R01-MH092868, P50-AA010761, and UL1-RR029882. We thank Cody Weidenthaler for excellent technical assistance.
The authors declare no competing financial interests.
References
- Ambroggi F, Ishikawa A, Fields HL, Nicola SM. Basolateral amygdala neurons facilitate reward-seeking behavior by exciting nucleus accumbens neurons. Neuron. 2008;59:648–661. doi: 10.1016/j.neuron.2008.07.004. [DOI] [PMC free article] [PubMed] [Google Scholar]
- Ambroggi F, Ghazizadeh A, Nicola SM, Fields HL. Roles of nucleus accumbens core and shell in incentive-cue responding and behavioral inhibition. J Neurosci. 2011;31:6820–6830. doi: 10.1523/JNEUROSCI.6491-10.2011. [DOI] [PMC free article] [PubMed] [Google Scholar]
- Aron AR, Fletcher PC, Bullmore ET, Sahakian BJ, Robbins TW. Stop-signal inhibition disrupted by damage to right inferior frontal gyrus in humans. Nat Neurosci. 2003;6:115–116. doi: 10.1038/nn1003. [DOI] [PubMed] [Google Scholar]
- Burke KA, Franz TM, Miller DN, Schoenbaum G. The role of the orbitofrontal cortex in the pursuit of happiness and more specific rewards. Nature. 2008;454:340–344. doi: 10.1038/nature06993. [DOI] [PMC free article] [PubMed] [Google Scholar]
- Burke KA, Takahashi YK, Correll J, Brown PL, Schoenbaum G. Orbitofrontal inactivation impairs reversal of Pavlovian learning by interfering with “disinhibition” of responding for previously unrewarded cues. Eur J Neurosci. 2009;30:1941–1946. doi: 10.1111/j.1460-9568.2009.06992.x. [DOI] [PMC free article] [PubMed] [Google Scholar]
- Butter CM, Mishkin M, Rosvold HE. Conditioning and extinction of a food-rewarded response after selective ablations of frontal cortex in rhesus monkeys. Exp Neurol. 1963;7:65–75. doi: 10.1016/0014-4886(63)90094-3. [DOI] [PubMed] [Google Scholar]
- Carelli RM, Ijames SG. Nucleus accumbens cell firing during maintenance, extinction, and reinstatement of cocaine self-administration behavior in rats. Brain Res. 2000;866:44–54. doi: 10.1016/S0006-8993(00)02217-4. [DOI] [PubMed] [Google Scholar]
- Chudasama Y, Robbins TW. Dissociable contributions of the orbitofrontal and infralimbic cortex to Pavlovian autoshaping and discrimination reversal learning: further evidence for the functional heterogeneity of the rodent frontal cortex. J Neurosci. 2003;23:8771–8780. doi: 10.1523/JNEUROSCI.23-25-08771.2003. [DOI] [PMC free article] [PubMed] [Google Scholar]
- Chudasama Y, Passetti F, Rhodes SE, Lopian D, Desai A, Robbins TW. Dissociable aspects of performance on the 5-choice serial reaction time task following lesions of the dorsal anterior cingulate, infralimbic and orbitofrontal cortex in the rat: differential effects on selectivity, impulsivity and compulsivity. Behav Brain Res. 2003;146:105–119. doi: 10.1016/j.bbr.2003.09.020. [DOI] [PubMed] [Google Scholar]
- Eagle DM, Baunez C. Is there an inhibitory-response-control system in the rat? Evidence from anatomical and pharmacological studies of behavioral inhibition. Neurosci Biobehav Rev. 2010;34:50–72. doi: 10.1016/j.neubiorev.2009.07.003. [DOI] [PMC free article] [PubMed] [Google Scholar]
- Eagle DM, Baunez C, Hutcheson DM, Lehmann O, Shah AP, Robbins TW. Stop-signal reaction-time task performance: role of prefrontal cortex and subthalamic nucleus. Cereb Cortex. 2008;18:178–188. doi: 10.1093/cercor/bhm044. [DOI] [PubMed] [Google Scholar]
- Esber GR, Haselgrove M. Reconciling the influence of predictiveness and uncertainty on stimulus salience: a model of attention in associative learning. Proc Biol Sci. 2011;278:2553–2561. doi: 10.1098/rspb.2011.0836. [DOI] [PMC free article] [PubMed] [Google Scholar]
- Feierstein CE, Quirk MC, Uchida N, Sosulski DL, Mainen ZF. Representation of spatial goals in rat orbitofrontal cortex. Neuron. 2006;51:495–507. doi: 10.1016/j.neuron.2006.06.032. [DOI] [PubMed] [Google Scholar]
- Finger EC, Mitchell DG, Jones M, Blair RJ. Dissociable roles of medial orbitofrontal cortex in human operant extinction learning. Neuroimage. 2008;43:748–755. doi: 10.1016/j.neuroimage.2008.08.021. [DOI] [PMC free article] [PubMed] [Google Scholar]
- Gallagher M, McMahan RW, Schoenbaum G. Orbitofrontal cortex and representation of incentive value in associative learning. J Neurosci. 1999;19:6610–6614. doi: 10.1523/JNEUROSCI.19-15-06610.1999. [DOI] [PMC free article] [PubMed] [Google Scholar]
- Ghazizadeh A, Ambroggi F, Odean N, Fields HL. Prefrontal cortex mediates extinction of responding by two distinct neural mechanisms in accumbens shell. J Neurosci. 2012;32:726–737. doi: 10.1523/JNEUROSCI.3891-11.2012. [DOI] [PMC free article] [PubMed] [Google Scholar]
- Ghitza UE, Fabbricatore AT, Prokopenko V, Pawlak AP, West MO. Persistent cue-evoked activity of accumbens neurons after prolonged abstinence from self-administered cocaine. J Neurosci. 2003;23:7239–7245. doi: 10.1523/JNEUROSCI.23-19-07239.2003. [DOI] [PMC free article] [PubMed] [Google Scholar]
- Gottfried JA, Dolan RJ. Human orbitofrontal cortex mediates extinction learning while accessing conditioned representations of value. Nat Neurosci. 2004;7:1144–1152. doi: 10.1038/nn1314. [DOI] [PubMed] [Google Scholar]
- Grabenhorst F, Rolls ET. Value, pleasure and choice in the ventral prefrontal cortex. Trends Cogn Sci. 2011;15:56–67. doi: 10.1016/j.tics.2010.12.004. [DOI] [PubMed] [Google Scholar]
- Hollander JA, Carelli RM. Cocaine-associated stimuli increase cocaine seeking and activate accumbens core neurons after abstinence. J Neurosci. 2007;27:3535–3539. doi: 10.1523/JNEUROSCI.3667-06.2007. [DOI] [PMC free article] [PubMed] [Google Scholar]
- Hollander JA, Ijames SG, Roop RG, Carelli RM. An examination of nucleus accumbens cell firing during extinction and reinstatement of water reinforcement behavior in rats. Brain Res. 2002;929:226–235. doi: 10.1016/S0006-8993(01)03396-0. [DOI] [PubMed] [Google Scholar]
- Ishikawa A, Ambroggi F, Nicola SM, Fields HL. Dorsomedial prefrontal cortex contribution to behavioral and nucleus accumbens neuronal responses to incentive cues. J Neurosci. 2008;28:5088–5098. doi: 10.1523/JNEUROSCI.0253-08.2008. [DOI] [PMC free article] [PubMed] [Google Scholar]
- Izquierdo A, Murray EA. Opposing effects of amygdala and orbital prefrontal cortex lesions on the extinction of instrumental responding in macaque monkeys. Eur J Neurosci. 2005;22:2341–2346. doi: 10.1111/j.1460-9568.2005.04434.x. [DOI] [PubMed] [Google Scholar]
- Jones JL, Esber GR, McDannald MA, Gruber AJ, Hernandez A, Mirenzi A, Schoenbaum G. Orbitofrontal cortex supports behavior and learning using inferred but not cached values. Science. 2012;338:953–956. doi: 10.1126/science.1227489. [DOI] [PMC free article] [PubMed] [Google Scholar]
- Kennerley SW, Wallis JD. Encoding of reward and space during a working memory task in the orbitofrontal cortex and anterior cingulate sulcus. J Neurophysiol. 2009;102:3352–3364. doi: 10.1152/jn.00273.2009. [DOI] [PMC free article] [PubMed] [Google Scholar]
- Kepecs A, Uchida N, Zariwala HA, Mainen ZF. Neural correlates, computation and behavioural impact of decision confidence. Nature. 2008;455:227–231. doi: 10.1038/nature07200. [DOI] [PubMed] [Google Scholar]
- Kim J, Ragozzino ME. The involvement of the orbitofrontal cortex in learning under changing task contingencies. Neurobiol Learn Mem. 2005;83:125–133. doi: 10.1016/j.nlm.2004.10.003. [DOI] [PMC free article] [PubMed] [Google Scholar]
- Kravitz AV, Peoples LL. Background firing rates of orbitofrontal neurons reflect specific characteristics of operant sessions and modulate phasic responses to reward-associated cues and behavior. J Neurosci. 2008;28:1009–1018. doi: 10.1523/JNEUROSCI.4344-07.2008. [DOI] [PMC free article] [PubMed] [Google Scholar]
- Krettek JE, Price JL. Projections from the amygdaloid complex to the cerebral cortex and thalamus in the rat and cat. J Comp Neurol. 1977;172:687–722. doi: 10.1002/cne.901720408. [DOI] [PubMed] [Google Scholar]
- Luk CH, Wallis JD. Choice coding in frontal cortex during stimulus-guided or action-guided decision-making. J Neurosci. 2013;33:1864–1871. doi: 10.1523/JNEUROSCI.4920-12.2013. [DOI] [PMC free article] [PubMed] [Google Scholar]
- Mackintosh NJ. Theory of attention: variations in associability of stimuli with reinforcement. Psychol Rev. 1975;82:276–298. doi: 10.1037/h0076778. [DOI] [Google Scholar]
- Mainen ZF, Kepecs A. Neural representation of behavioral outcomes in the orbitofrontal cortex. Curr Opin Neurobiol. 2009;19:84–91. doi: 10.1016/j.conb.2009.03.010. [DOI] [PubMed] [Google Scholar]
- McAlonan K, Brown VJ. Orbital prefrontal cortex mediates reversal learning and not attentional set shifting in the rat. Behav Brain Res. 2003;146:97–103. doi: 10.1016/j.bbr.2003.09.019. [DOI] [PubMed] [Google Scholar]
- McDannald MA, Lucantonio F, Burke KA, Niv Y, Schoenbaum G. Ventral striatum and orbitofrontal cortex are both required for model-based, but not model-free, reinforcement learning. J Neurosci. 2011;31:2700–2705. doi: 10.1523/JNEUROSCI.5499-10.2011. [DOI] [PMC free article] [PubMed] [Google Scholar]
- McDannald MA, Takahashi YK, Lopatina N, Pietras BW, Jones JL, Schoenbaum G. Model-based learning and the contribution of the orbitofrontal cortex to the model-free world. Eur J Neurosci. 2012;35:991–996. doi: 10.1111/j.1460-9568.2011.07982.x. [DOI] [PMC free article] [PubMed] [Google Scholar]
- McDonald AJ. Organization of amygdaloid projections to the prefrontal cortex and associated striatum in the rat. Neuroscience. 1991a;44:1–14. doi: 10.1016/0306-4522(91)90247-L. [DOI] [PubMed] [Google Scholar]
- McDonald AJ. Topographical organization of amygdaloid projections to the caudatoputamen, nucleus accumbens, and related striatal-like areas of the rat brain. Neuroscience. 1991b;44:15–33. doi: 10.1016/0306-4522(91)90248-M. [DOI] [PubMed] [Google Scholar]
- Milad MR, Quirk GJ. Neurons in medial prefrontal cortex signal memory for fear extinction. Nature. 2002;420:70–74. doi: 10.1038/nature01138. [DOI] [PubMed] [Google Scholar]
- Nicola SM, Yun IA, Wakabayashi KT, Fields HL. Cue-evoked firing of nucleus accumbens neurons encodes motivational significance during a discriminative stimulus task. J Neurophysiol. 2004a;91:1840–1865. doi: 10.1152/jn.00657.2003. [DOI] [PubMed] [Google Scholar]
- Nicola SM, Yun IA, Wakabayashi KT, Fields HL. Firing of nucleus accumbens neurons during the consummatory phase of a discriminative stimulus task depends on previous reward predictive cues. J Neurophysiol. 2004b;91:1866–1882. doi: 10.1152/jn.00658.2003. [DOI] [PubMed] [Google Scholar]
- Noonan MP, Kolling N, Walton ME, Rushworth MF. Re-evaluating the role of the orbitofrontal cortex in reward and reinforcement. Eur J Neurosci. 2012;35:997–1010. doi: 10.1111/j.1460-9568.2012.08023.x. [DOI] [PubMed] [Google Scholar]
- Ogawa M, van der Meer MA, Esber GR, Cerri DH, Stalnaker TA, Schoenbaum G. Risk-responsive orbitofrontal neurons track acquired salience. Neuron. 2013;77:251–258. doi: 10.1016/j.neuron.2012.11.006. [DOI] [PMC free article] [PubMed] [Google Scholar]
- O'Neill M, Schultz W. Coding of reward risk by orbitofrontal neurons is mostly distinct from coding of reward value. Neuron. 2010;68:789–800. doi: 10.1016/j.neuron.2010.09.031. [DOI] [PubMed] [Google Scholar]
- Ostlund SB, Balleine BW. Orbitofrontal cortex mediates outcome encoding in Pavlovian but not instrumental conditioning. J Neurosci. 2007;27:4819–4825. doi: 10.1523/JNEUROSCI.5443-06.2007. [DOI] [PMC free article] [PubMed] [Google Scholar]
- Padoa-Schioppa C. Orbitofrontal cortex and the computation of economic value. Ann N Y Acad Sci. 2007;1121:232–253. doi: 10.1196/annals.1401.011. [DOI] [PubMed] [Google Scholar]
- Padoa-Schioppa C. Neurobiology of economic choice: a good-based model. Ann Rev Neurosci. 2011;34:333–359. doi: 10.1146/annurev-neuro-061010-113648. [DOI] [PMC free article] [PubMed] [Google Scholar]
- Padoa-Schioppa C, Cai X. The orbitofrontal cortex and the computation of subjective value: consolidated concepts and new perspectives. Ann N Y Acad Sci. 2011;1239:130–137. doi: 10.1111/j.1749-6632.2011.06262.x. [DOI] [PMC free article] [PubMed] [Google Scholar]
- Panayi MC, Killcross S. Orbitofrontal cortex inactivation impairs between- but not within-session Pavlovian extinction: an associative analysis. Neurobiol Learn Mem. 2014;108:78–87. doi: 10.1016/j.nlm.2013.08.002. [DOI] [PubMed] [Google Scholar]
- Pearce JM, Hall G. A model for Pavlovian learning: variations in the effectiveness of conditioned but not of unconditioned stimuli. Psychol Rev. 1980;87:532–552. doi: 10.1037/0033-295X.87.6.532. [DOI] [PubMed] [Google Scholar]
- Peters J, Kalivas PW, Quirk GJ. Extinction circuits for fear and addiction overlap in prefrontal cortex. Learn Mem. 2009;16:279–288. doi: 10.1101/lm.1041309. [DOI] [PMC free article] [PubMed] [Google Scholar]
- Peters YM, O'Donnell P, Carelli RM. Prefrontal cortical cell firing during maintenance, extinction, and reinstatement of goal-directed behavior for natural reward. Synapse. 2005;56:74–83. doi: 10.1002/syn.20129. [DOI] [PubMed] [Google Scholar]
- Reynolds SM, Zahm DS. Specificity in the projections of prefrontal and insular cortex to ventral striatopallidum and the extended amygdala. J Neurosci. 2005;25:11757–11767. doi: 10.1523/JNEUROSCI.3432-05.2005. [DOI] [PMC free article] [PubMed] [Google Scholar]
- Riceberg JS, Shapiro ML. Reward stability determines the contribution of orbitofrontal cortex to adaptive behavior. J Neurosci. 2012;32:16402–16409. doi: 10.1523/JNEUROSCI.0776-12.2012. [DOI] [PMC free article] [PubMed] [Google Scholar]
- Roberts AC. Primate orbitofrontal cortex and adaptive behaviour. Trends Cogn Sci. 2006;10:83–90. doi: 10.1016/j.tics.2005.12.002. [DOI] [PubMed] [Google Scholar]
- Roesch MR, Olson CR. Neuronal activity related to reward value and motivation in primate frontal cortex. Science. 2004;304:307–310. doi: 10.1126/science.1093223. [DOI] [PubMed] [Google Scholar]
- Roesch MR, Olson CR. Neuronal activity in primate orbitofrontal cortex reflects the value of time. J Neurophysiol. 2005;94:2457–2471. doi: 10.1152/jn.00373.2005. [DOI] [PubMed] [Google Scholar]
- Roesch MR, Taylor AR, Schoenbaum G. Encoding of time-discounted rewards in orbitofrontal cortex is independent of value representation. Neuron. 2006;51:509–520. doi: 10.1016/j.neuron.2006.06.027. [DOI] [PMC free article] [PubMed] [Google Scholar]
- Roesch MR, Stalnaker TA, Schoenbaum G. Associative encoding in anterior piriform cortex versus orbitofrontal cortex during odor discrimination and reversal learning. Cereb Cortex. 2007;17:643–652. doi: 10.1093/cercor/bhk009. [DOI] [PMC free article] [PubMed] [Google Scholar]
- Roesch MR, Calu DJ, Esber GR, Schoenbaum G. All that glitters. dissociating attention and outcome expectancy from prediction errors signals. J Neurophysiol. 2010;104:587–595. doi: 10.1152/jn.00173.2010. [DOI] [PMC free article] [PubMed] [Google Scholar]
- Roitman JD, Roitman MF. Risk-preference differentiates orbitofrontal cortex responses to freely chosen reward outcomes. Eur J Neurosci. 2010;31:1492–1500. doi: 10.1111/j.1460-9568.2010.07169.x. [DOI] [PMC free article] [PubMed] [Google Scholar]
- Rolls ET, Critchley HD, Mason R, Wakeman EA. Orbitofrontal cortex neurons: role in olfactory and visual association learning. J Neurophysiol. 1996;75:1970–1981. doi: 10.1152/jn.1996.75.5.1970. [DOI] [PubMed] [Google Scholar]
- Saddoris MP, Gallagher M, Schoenbaum G. Rapid associative encoding in basolateral amygdala depends on connections with orbitofrontal cortex. Neuron. 2005;46:321–331. doi: 10.1016/j.neuron.2005.02.018. [DOI] [PubMed] [Google Scholar]
- Schilman EA, Uylings HB, Galis-de Graaf Y, Joel D, Groenewegen HJ. The orbital cortex in rats topographically projects to central parts of the caudate-putamen complex. Neurosci Lett. 2008;432:40–45. doi: 10.1016/j.neulet.2007.12.024. [DOI] [PubMed] [Google Scholar]
- Schoenbaum G, Eichenbaum H. Information coding in the rodent prefrontal cortex: I. Single-neuron activity in orbitofrontal cortex compared with that in pyriform cortex. J Neurophysiol. 1995;74:733–750. doi: 10.1152/jn.1995.74.2.733. [DOI] [PubMed] [Google Scholar]
- Schoenbaum G, Chiba AA, Gallagher M. Orbitofrontal cortex and basolateral amygdala encode expected outcomes during learning. Nat Neurosci. 1998;1:155–159. doi: 10.1038/407. [DOI] [PubMed] [Google Scholar]
- Schoenbaum G, Chiba AA, Gallagher M. Neural encoding in orbitofrontal cortex and basolateral amygdala during olfactory discrimination learning. J Neurosci. 1999;19:1876–1884. doi: 10.1523/JNEUROSCI.19-05-01876.1999. [DOI] [PMC free article] [PubMed] [Google Scholar]
- Schoenbaum G, Chiba AA, Gallagher M. Changes in functional connectivity in orbitofrontal cortex and basolateral amygdala during learning and reversal training. J Neurosci. 2000;20:5179–5189. doi: 10.1523/JNEUROSCI.20-13-05179.2000. [DOI] [PMC free article] [PubMed] [Google Scholar]
- Schoenbaum G, Nugent SL, Saddoris MP, Setlow B. Orbitofrontal lesions in rats impair reversal but not acquisition of go, no-go odor discriminations. Neuroreport. 2002;13:885–890. doi: 10.1097/00001756-200205070-00030. [DOI] [PubMed] [Google Scholar]
- Schoenbaum G, Setlow B, Ramus SJ. A systems approach to orbitofrontal cortex function: recordings in rat orbitofrontal cortex reveal interactions with different learning systems. Behav Brain Res. 2003;146:19–29. doi: 10.1016/j.bbr.2003.09.013. [DOI] [PubMed] [Google Scholar]
- Schoenbaum G, Roesch MR, Stalnaker TA, Takahashi YK. A new perspective on the role of the orbitofrontal cortex in adaptive behaviour. Nat Rev Neurosci. 2009;10:885–892. doi: 10.1038/nrn2753. [DOI] [PMC free article] [PubMed] [Google Scholar]
- Schoenbaum G, Roesch MR, Stalnaker TA, Takahashi YK. Orbitofrontal cortex and outcome expectancies: optimizing behavior and sensory perception. In: Gottfried JA, editor. Neurobiology of sensation and reward. Boca Raton, FL: CRC; 2011. [PubMed] [Google Scholar]
- Schultz W, O'Neill M, Tobler PN, Kobayashi S. Neuronal signals for reward risk in frontal cortex. Ann N Y Acad Sci. 2011;1239:109–117. doi: 10.1111/j.1749-6632.2011.06256.x. [DOI] [PubMed] [Google Scholar]
- Shi CJ, Cassell MD. Cortical, thalamic, and amygdaloid connections of the anterior and posterior insular cortices. J Comp Neurol. 1998;399:440–468. doi: 10.1002/(SICI)1096-9861(19981005)399:4<440::AID-CNE2>3.0.CO%3B2-1. [DOI] [PubMed] [Google Scholar]
- Takahashi YK, Chang CY, Lucantonio F, Haney RZ, Berg BA, Yau HJ, Bonci A, Schoenbaum G. Neural estimates of imagined outcomes in the orbitofrontal cortex drive behavior and learning. Neuron. 2013;80:507–518. doi: 10.1016/j.neuron.2013.08.008. [DOI] [PMC free article] [PubMed] [Google Scholar]
- Tremblay L, Schultz W. Relative reward preference in primate orbitofrontal cortex. Nature. 1999;398:704–708. doi: 10.1038/19525. [DOI] [PubMed] [Google Scholar]
- Tye KM, Cone JJ, Schairer WW, Janak PH. Amygdala neural encoding of the absence of reward during extinction. J Neurosci. 2010;30:116–125. doi: 10.1523/JNEUROSCI.4240-09.2010. [DOI] [PMC free article] [PubMed] [Google Scholar]
- van Duuren E, Escámez FA, Joosten RN, Visser R, Mulder AB, Pennartz CM. Neural coding of reward magnitude in the orbitofrontal cortex of the rat during a five-odor olfactory discrimination task. Learn Mem. 2007;14:446–456. doi: 10.1101/lm.546207. [DOI] [PMC free article] [PubMed] [Google Scholar]
- van Duuren E, Lankelma J, Pennartz CM. Population coding of reward magnitude in the orbitofrontal cortex of the rat. J Neurosci. 2008;28:8590–8603. doi: 10.1523/JNEUROSCI.5549-07.2008. [DOI] [PMC free article] [PubMed] [Google Scholar]
- van Duuren E, van der Plasse G, Lankelma J, Joosten RN, Feenstra MG, Pennartz CM. Single-cell and population coding of expected reward probability in the orbitofrontal cortex of the rat. J Neurosci. 2009;29:8965–8976. doi: 10.1523/JNEUROSCI.0005-09.2009. [DOI] [PMC free article] [PubMed] [Google Scholar]
- Wallis JD. Cross-species studies of orbitofrontal cortex and value-based decision-making. Nat Neurosci. 2012;15:13–19. doi: 10.1038/nn.2956. [DOI] [PMC free article] [PubMed] [Google Scholar]
- Wright CI, Beijer AV, Groenewegen HJ. Basal amygdaloid complex afferents to the rat nucleus accumbens are compartmentally organized. J Neurosci. 1996;16:1877–1893. doi: 10.1523/JNEUROSCI.16-05-01877.1996. [DOI] [PMC free article] [PubMed] [Google Scholar]
- Yun IA, Wakabayashi KT, Fields HL, Nicola SM. The ventral tegmental area is required for the behavioral and nucleus accumbens neuronal firing responses to incentive cues. J Neurosci. 2004;24:2923–2933. doi: 10.1523/JNEUROSCI.5282-03.2004. [DOI] [PMC free article] [PubMed] [Google Scholar]
- Zeeb FD, Winstanley CA. Functional disconnection of the orbitofrontal cortex and basolateral amygdala impairs acquisition of a rat gambling task and disrupts animals' ability to alter decision-making behavior after reinforcer devaluation. J Neurosci. 2013;33:6434–6443. doi: 10.1523/JNEUROSCI.3971-12.2013. [DOI] [PMC free article] [PubMed] [Google Scholar]