Abstract
Soil surface texture is an important environmental factor that influences crop productivity because of its direct effect on soil water and complex interactions with other environmental factors. Using 30-year data, an agricultural system model (DSSAT-CERES-Wheat) was calibrated and validated. After validation, the modelled yield and water use (WU) of spring wheat (Triticum aestivum L.) from two soil textures (silt loam and clay) under rain-fed condition were analyzed. Regression analysis showed that wheat grown in silt loam soil is more sensitive to WU than wheat grown in clay soil, indicating that the wheat grown in clay soil has higher drought tolerance than that grown in silt loam. Yield variation can be explained by WU other than by precipitation use (PU). These results demonstrated that the DSSAT-CERES-Wheat model can be used to evaluate the WU of different soil textures and assess the feasibility of wheat production under various conditions. These outcomes can improve our understanding of the long-term effect of soil texture on spring wheat productivity in rain-fed condition.
Understanding of the variable response of crop to the environment is vital to crop management in agricultural systems. Available growing season precipitation is the most influential factor1, to the productivity of spring wheat (Triticum aestivum L.) in the semiarid Canadian prairies. Productivity is also influenced by other environmental and management factors, including temperature, fertilizer rate, crop rotation, tillage, and cultivar2,3,4.
The soil texture is another factor that influences wheat productivity because of its significant influence on ecological and hydrological processes, such as water retention, ion exchange and nutrient cycling5,6,7. The study of soil texture effects under field conditions is challenging using short-term data and classical statistics because of confounding effects of factors in the field, such as precipitation, that interact with soil texture effects. For example, conflicting effects of texture were found by Turner et al. (2004)8 under a rain-fed growing condition. They found that the proportion of soil clay content has either a positive or negative effect on the water use efficiency (WUE) of wheat. This confusing result could be caused by many confounding factors acting together to reverse the soil texture effect on WUE depending on exact growing conditions.
Agricultural system simulation models that capture current knowledge of agricultural science have the potential to elucidate the effect of soil textures on crop productivity and water use (WU). Agricultural system simulation models, such as DSSAT (Decision Support System for Agrotechnology Transfer) Crop System Models, are often used as tools to estimate the environmental impacts on field crop production. A number of previous studies have used DSSAT-CERES to discern various influences on crop productivity, such as temperature9, irrigation10,11, nitrogen cycling12, tillage13, and crop rotation14. However, there are few studies in the literature15 that investigate the effect of soil texture, another important factor influencing spring wheat productivity. Our previous study16 simulated the crop productivity in different soil textures but predominantly focused on climate effect on seeding dates. Therefore, there is a need to evaluate the capability of DSSAT-CERES-Wheat model to simulate the effect of soil texture on crop productivity. It is also essential to demonstrate if DSSAT-CERES-Wheat model can be used to estimate the WU difference caused by soil texture.
Our objectives were to: 1) calibrate the DSSAT-CERES-Wheat model for simulation of wheat productivity in two soil textures (silt loam and clay soil); 2) validate the calibrated model by comparing simulated and measured wheat productivity and soil moisture data; and 3) compare the estimated water use (WU) difference between these two soil textures from the simulation results.
Methods
Study sties and experimental set-up
The study was conducted at two sites with contrasting soil texture that are located in the drier portion of the Canadian prairies17. The sites are about 30 km apart. These sites are located at southwest Saskatchewan, Canada on Brown chernozem soils18. The land was slightly sloping (0.5 to 2%). The annual average temperature and total precipitation near here is 6.9°C and 332 mm, respectively16. Precipitation during the summer and fall periods was usually in the form of rain, most of which evapotranspires, but some penetrates to deeper soil layers. During the winter, the precipitation was usually in the form of snow that lies on the frozen soil until March or April when it melts. Much of this snowmelt runs off and is lost to wheat production19.
The data used in this study was from a long-term tillage experiment and only data for the conventional tillage treatment was used. The experiment established on a silt loam site (Swift Current, 50.288°N, 107.794°W) and a clay soil site (Stewart Valley, (50.596°N, 107.805°W). Randomized complete block designs were used, with four replications on the silt loam site, and three replications on the clay site.
Management (tillage, fertilizer rate, etc.) was as consistent as possible between the two sites. The same wheat varieties that have similar phenology and yield performance were sown at both locations each year. A tillage operation occurred just prior to seeding, usually a day or two before the seeding operation. Tillage depth was approximately 5 cm. In-crop herbicide application normally occurred in early to mid-June, around the 5 to 6 leaf stage of the crop. Details of the fertilizer management on these two sites have been reported previously15,19,20; consequently, only that pertinent to this study are presented. The fertilizer rates of the two sites were quite similar (Table 1). Grain yield and above ground biomass (Table 1) were determined at full ripeness. Total aboveground yield and grain yield from a 1 m2 equivalent area were measured after air drying of the samples. A minimum of three samples were taken per plot for most measurements. Soil moisture was measured each year after harvest. Three 2.5-cm diameter cores were taken per plot with a truck-mounted hydraulic soil sampler. Gravimetric soil water content were determined for the 0–15, 15–30, 30–60, 60–90 and 90–120 cm depths and these values converted to volumetric basis using bulk densities.
Table 1. Growing season (May to August) precipitation (GSP, mm), nutrients applied, grain yield and biomass of wheat grown in silt loam and clay soil from 1982 to 2011.
| Year | GSP (mm) | Nutrients applied (NO3-N kg ha−1) | Grain yield (kg ha−1) | Biomass (kg ha−1) | |||
|---|---|---|---|---|---|---|---|
| Silt loam | Clay | Silt loam | Clay | Silt loam | Clay | ||
| 1982 | 243 | 62 | 43 | 2839 (245) | 1577 (63) | 8443 (837) | 3791 (216) |
| 1983 | 186 | 55 | 55 | 2111 (56) | - | 5355 (208) | - |
| 1984 | 94 | 50 | 55 | 651 (154) | 1166 (181) | 1933 (353) | 3062 (450) |
| 1985 | 73 | 35 | 25 | 764 (146) | 1156 (197) | 1999 (158) | 2552 (378) |
| 1986 | 205 | 20 | 20 | 2873 (237) | - | 6751 (551) | - |
| 1987 | 129 | 45 | 45 | 1399 (161) | 783 (124) | 2796 (366) | 1450 (251) |
| 1988 | 143 | 38 | 5 | 532 (83) | - | 1288 (176) | - |
| 1989 | 210 | 19 | 23 | 2258 (157) | 1663 (181) | 6216 (201) | 4881 (449) |
| 1990 | 179 | 45 | 32 | 2485 (62) | 2159 (150) | 6153 (138) | 5240 (486) |
| 1991 | 302 | 55 | 55 | 2770 (275) | 3052 (45) | 7827 (627) | 8669 (561) |
| 1992 | 183 | 58 | 60 | 1866 (56) | 2017 (28) | 5240 (98) | 4817 (54) |
| 1993 | 175 | 60 | 55 | 2430 (97) | 2783 (331) | 5950 (208) | 7167 (575) |
| 1994 | 160 | 54 | 58 | 2384 (149) | 2518 (340) | 7553 (600) | 6363 (859) |
| 1995 | 189 | 61 | 64 | 2809 (313) | 2499 (427) | 8069 (706) | 7459 (1264) |
| 1996 | 168 | 53 | 60 | 2320 (175) | 2276 (111) | 6331 (695) | 6263 (114) |
| 1997 | 163 | 58 | 62 | 2775 (432) | 2511 (148) | 6689 (813) | 6581 (394) |
| 1998 | 166 | 64 | 63 | 1072 (171) | 1337 (53) | 4220 (427) | 4041 (157) |
| 1999 | 240 | 49 | 62 | 2416 (186) | 3234 (256) | 6395 (707) | 7966 (817) |
| 2000 | 245 | 65 | 66 | 2035 (54) | 1962 (488) | 6386 (310) | 5415 (814) |
| 2001 | 112 | 63 | 64 | 970 (255) | 663 (101) | 2072 (588) | 1402 (216) |
| 2002 | 237 | 32 | 25 | 2354 (388) | 2100 (307) | 5463 (806) | 4643 (731) |
| 2003 | 129 | 60 | 51 | 1675 (227) | 2145 (152) | 5048 (773) | 4999 (394) |
| 2004 | 211 | 46 | 46 | 3009 (83) | 2690 (61) | 7668 (147) | 7305 (486) |
| 2005 | 167 | 60 | 56 | 2273 (263) | 2948 (205) | 6566 (247) | 8111 (422) |
| 2006 | 269 | 58 | 60 | 1661 (196) | 2037 (149) | 4550 (377) | 5620 (329) |
| 2007 | 110 | 61 | 65 | 1264 (129) | 2193 (138) | 3482 (403) | 5476 (596) |
| 2008 | 253 | 40 | 55 | 2176 (260) | 2970 (265) | 4860 (736) | 8428 (655) |
| 2009 | 94 | 55 | 57 | 1374 (193) | 2278 (215) | 2782 (378) | 4760 (454) |
| 2010 | 286 | 49 | 54 | 2472 (282) | 2932 (416) | 6346 (780) | 6997 (905) |
| 2011 | 240 | 55 | 57 | 2880 (492) | 2638 (156) | 7478 (1241) | 6387 (405) |
| Mean | 185 | 51 | 49 | 2030 | 2159 | 5397 | 5352 |
Note: Values in parentheses are the standard deviation. ‘-' is missing value.
Model modification of seedling emergence
The timing of seedling emergence greatly affects the growth and yield of wheat. The DSSAT-CSM is used worldwide for many different applications, but its simulation of the timing of seedling emergence of wheat is not satisfactory under certain circumstances21. The cereal crop seedling emergence is simulated by DSSAT-CSM model using thermal time and adjusted by a soil water factor, assuming that the adjusted thermal time is linearly related to the emergence process22. However, Jame and Cutforth (2004)21 showed that the response of emergence to temperature is not linear. In order to improve the prediction of seedling emergence, we incorporated a newly developed non-linear model, the Beta model, into DSSAT-CSM. For a more detailed description, please refer to Wang et al. (2009)23.
Model input
The model requires daily weather data including maximum and minimum temperature and precipitation that were obtained from the Meteorological Service of Canada (MSC). The latter Daily solar radiation was calculated using the Mountain Climate Simulator24. The model also requires input parameters describing crop and soil characteristics. The soil parameters included lower soil water limit (LL, cm3 cm−3), upper drainage limit (DUL, cm3 cm−3), upper soil water limit (SAT, cm3 cm−3), soil organic C content (wt.%), dry bulk density (g cm−3), saturated hydraulic conductivity, soil pH, clay and silt content. The pH, clay and silt data were obtained from Saskatchewan Soil Survey reports. The soil hydraulic parameters (LL, DUL and SAT) were obtained by a soil texture based pedo-transfer function (the SPAW model) developed by Saxton and Rawls (2006)25. The root distribution parameter was estimated by a method provided by Gijsman et al. (2007)26. The data were used to construct the model soil profiles (Table 2).
Table 2. Selected soil physical properties at the slit loam and clay sites.
| Soil Textures | Soil profile depth (cm) | 0–15 | 15–30 | 30–60 | 60–90 | 90–120 |
|---|---|---|---|---|---|---|
| Silt loam | SLLL | 0.12 | 0.11 | 0.10 | 0.09 | 0.09 |
| SDUL | 0.29 | 0.29 | 0.27 | 0.27 | 0.25 | |
| SSAT | 0.47 | 0.47 | 0.47 | 0.47 | 0.47 | |
| Root growth factor | 1.00 | 0.95 | 0.82 | 0.47 | 0.26 | |
| SSKS | 1.42 | 2.76 | 4.32 | 3.04 | 3.04 | |
| Clay content (%) | 18.2 | 24.2 | 25.4 | 33.4 | 31.7 | |
| Silt content (%) | 50.4 | 49.4 | 33.4 | 25.9 | 27.9 | |
| Clay | SLLL | 0.14 | 0.14 | 0.16 | 0.18 | 0.20 |
| SDUL | 0.47 | 0.47 | 0.47 | 0.47 | 0.47 | |
| SSAT | 0.55 | 0.55 | 0.55 | 0.55 | 0.51 | |
| Root growth factor | 1.00 | 0.95 | 0.82 | 0.47 | 0.26 | |
| SSKS | 0.33 | 0.33 | 0.33 | 0.33 | 0.22 | |
| Clay content (%) | 59 | 59 | 59 | 59 | 69 | |
| Silt content (%) | 36 | 36 | 36 | 36 | 28 |
The soil moisture was simulated by the DSSAT model. Since historic soil water content before experiment initiation was unknown, the model was initialized to start three years prior to the period of analysis. A spin-up period of three years was found to be adequate for the soil water values to stabilize and not be affected by the initial input values16. Once the soil profile initial conditions were established, the simulations were run from 1982 to 2011.
Crop management data needed are seeding date, seeding depth, row spacing, and plant population.
Model calibration
The method for calibrating parameters (soil, ecotype and cultivar) of the crop models is a step-by-step procedure following the approach recommended by Boote27 of calibrating soil moisture first, followed by phenology, and then yield (biomass and grain yield). The initial soil hydraulic parameters were obtained by a soil texture based model (SWAP25). Plant parameters (ecotype and cultivar) from a previous study23 conducted in the same area and using same cultivar as our study were used as initial values for calibration. Model calibration used part (1982–1999) of the long-term data of the two soil textures (sites) and two (2004 and 2005) of the three years of data from a physiological study. A single set of ecotype and cultivar parameters was used since the cultivars grown from 1982 to 2011 have similar phenology and yield performance (Table 3). For the calibration, we fixed the maximum possible seed weight under non-stressed conditions at 33 g, the highest value reported by Wang et al. (2002)28 using the same cultivar in our site. As little information on the other cultivar and ecotype parameters was available in the experiments or literature, they were mostly calibrated through trial and error to match simulations with measurements.
Table 3. Cultivar parameters and part ecotype parameters for wheat developed for simulation using the DSSAT-CERES-Wheat module.
| Parameters | Definitions | Calibrated values |
|---|---|---|
| P1V | Days at optimum vernalizing temperature required to complete vernalization | 30 |
| P1D | Percentage reduction in development rate in a photoperiod 10 hour shorter than the threshold relative to that at the threshold | 55 |
| P5 | Grain filling (excluding lag) phase duration (°C.d) | 490 |
| G1 | Kernel number per unit canopy weight at anthesis (#/g) | 15 |
| G2 | Standard kernel size under optimum conditions (mg) | 33 |
| G3 | Standard, non-stressed dry weight (total, including grain) of a single tiller at maturity (g) | 0.8 |
| PHINT | Interval between successive leaf tip appearances (°C.d) | 75 |
| HSTD | Standard canopy height (cm) | 95 |
| LAWR2 | Lamina area to weight ratio, phase 2 (cm2/g) | 140 |
| LAWRS | Lamina area to weight ratio of standard first leaf (cm2/g) | 200 |
| P1 | Duration of phase end juvenile to double ridges (PVTU) | 240 |
| P1DPE | Day length factor, pre emergence (#,0–1) | 0.0 |
| P2 | Duration of phase double ridges to end leaf growth (TU) | 180 |
| P3 | Duration of phase end leaf growth to end spike growth (TU) | 160 |
| P4 | Duration of phase end spike growth to end grain fill lag (TU) | 400 |
| P4SGE | Stem growth end stage (Growth Stage) | 4.45 |
| TBGF | Temperature base, grain filling (°C) | 0.0 |
| PARUR | PAR conversion to dry material ratio, after last leaf stage (g/MJ) | 2.5 |
| PARUV | PAR conversion to dry material ratio, before last leaf stage (g/MJ) | 2.2 |
| WFGU | Water stress factor, growth, upper (fr) | 1.0 |
| WFPGU | Water factor, genotype sensitivity to stress when grain filling (0–1) | 0.8 |
| WFPU | Water stress factor, photosynthesis, upper (fr) | 1.0 |
Statistics for model calibration and validation
The inaccuracies in each simulation step will affect the accuracy of simulated results for the subsequent simulation step. These inaccuracies will add together across all simulation steps and affect final estimated results. Also, the inaccuracies of simulated soil moisture will affect the accuracy of the phenology simulation. Finally, inaccuracies in soil moisture and phenology will affect accuracy of simulated final yield. These accumulated effects on final results of phenological development, WU, and crop yield are complex so it is infeasible to determine how the inaccuracies at each step accumulate to affect these final results. Instead, we determined the overall errors based on difference of each pairing of observed and simulated values. We evaluated the simulation results using: 1) RMSE (Eq.1); and 2) the index of agreement (d), which varies between 0 (poor model) and 1 (perfect model)29 (Eq.2).
 |
 |
Where Pi is the ith simulated value, Pavg is the average of the simulated values, Oi is the ith measured value, Oavg is the average of the measured values, and n is the number of data pairs.
Results
Model calibration
From 1982 to 1999, wheat was grown in two soil textures. The grain yield and biomass collected in years 1983, 1986 and 1988 were missing, and thus excluded from the analysis. The two soil texture sites were simulated sequentially, with the simulation starting on 1 Jan. 1979 and ending on 31 Dec. 1999. Grain yield and biomass (at harvest) and soil moisture measurement (after harvest) were available for model calibration.
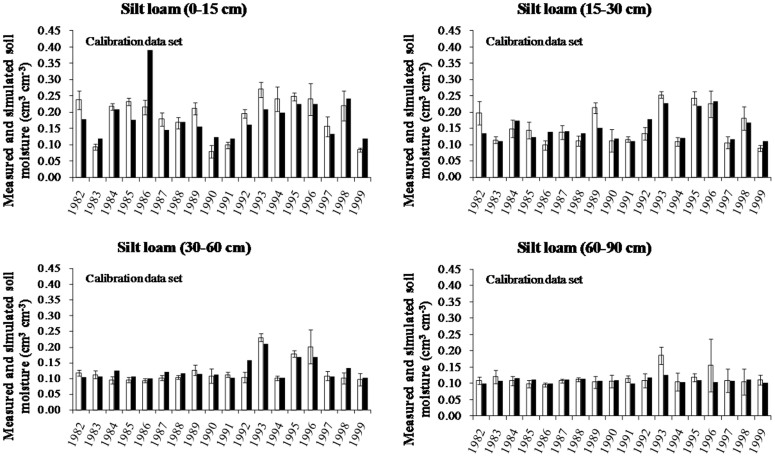
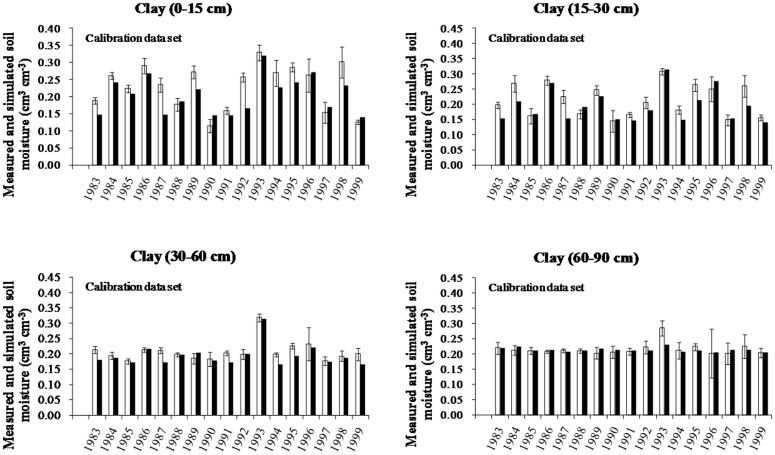
As shown in Table 4, soil moisture simulations in individual soil layers (0–60 cm) had RMSEs ranging from 0.020 to 0.055 (cm3 cm−3) and from 0.015 to 0.043 (cm3 cm−3) for the silt loam and clay sites, respectively. This indicates the soil moisture above 60 cm was well simulated. However, the soil moisture was not well simulated on both the silt loam and clay sites below 60 cm (d < 0.593). The variation in simulated soil moisture below 60 cm was smaller than those measured for both soil texture sites (Fig. 1 and 2). A plausible cause of the poor model performance is that the model assumed that half of the surplus water was held over to the next time step (i.e., the next month). This simple method of handling storage is not physically realistic and lowers the accuracy of the model simulations28. Thus, there is a need to improve model simulation of soil water in deeper soil layers. DSSAT simulates soil moisture more accurately during the growing season than before seeding or after harvest. This is not unexpected because DSSAT was primarily designed for simulating soil moisture-crop interactions30. The accuracy of soil moisture simulation is acceptable for estimating growing season WU.
Table 4. Mean measured values (calibration data set) and mean square error (RMSE), and d values in simulations of soil moisture in different depth of silt loam and clay soil.
| Soil profile depth | Silt loam (cm3 cm−3) | Clay (cm3 cm−3) | ||||||
|---|---|---|---|---|---|---|---|---|
| (cm) | Mean | RMSE | d | Samples | Mean | RMSE | d | Samples |
| 0–15 | 0.185 | 0.055 | 0.764 | 18 | 0.205 | 0.043 | 0.864 | 18 |
| 15–30 | 0.150 | 0.029 | 0.895 | 18 | 0.194 | 0.035 | 0.881 | 18 |
| 30–60 | 0.125 | 0.021 | 0.904 | 18 | 0.195 | 0.021 | 0.900 | 18 |
| 60–90 | 0.109 | 0.020 | 0.473 | 18 | 0.214 | 0.015 | 0.593 | 18 |
Figure 1. Comparison of measured (open bars with error bars) soil moisture after harvest and corresponding simulated (solid bars without error bars) soil moisture in layers at silt loam soil site.
Figure 2. Comparison of measured (open bars with error bars) soil moisture after harvest and corresponding simulated (solid bars without error bars) soil moisture in layers at clay soil site.
The wheat phenology in the CSM- CERES-Wheat model is controlled by growth stages, which are in turn driven by growing degree-days (GDD)31. The cultivar coefficients defined in DSSAT are specific to both the crop cultivar and the local climate, and must therefore be individually calibrated12. The two years of simulation RMSEs of wheat phenology was less than 3.46 (days) and d values were higher than 0.99 (Table 5 and Fig. 3), indicating that the DSSAT model simulated the wheat growth very well.
Table 5. Calibration and validation of wheat phenology.
| Year | RMSE | d | Samples | |
|---|---|---|---|---|
| Calibration | 2004 | 1.21 | 0.999 | 8 |
| 2005 | 3.46 | 0.996 | 7 | |
| Validation | 2006 | 3.152 | 0.997 | 6 |
Figure 3. Comparison of measured (open bars with error bars) and simulated (solid bars without error bars) wheat phenology.

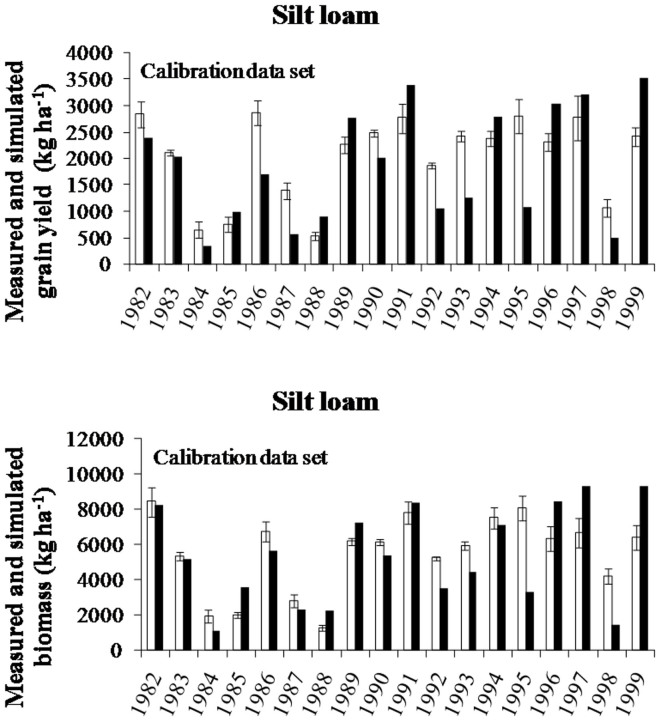
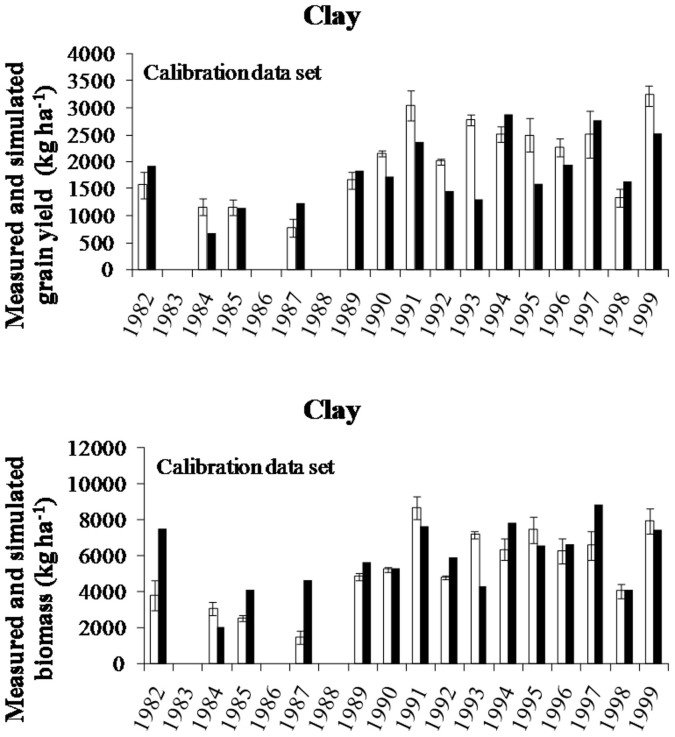
The simulated and measured grain yields for silt loam and clay from 1982 to 1999 are displayed in Fig. 4 and 5. The annual fluctuation of grain yield and biomass were reasonably simulated for both soil texture sites. With the exception of the grain yield and biomass in 1995 in silt loam soil, all of the grain yield and biomass were simulated well with RMSEs of 777 (kg ha−1), and d value of 0.808 for grain yield and an RMSE of 1871 (kg ha−1), and d value of 0.836 for biomass (Table 6). The grain yield and biomass was also well simulated in clay soil with the exception of grain yield in 1993 and biomass in 1982. The deviations between simulated and measured grain yield and biomass in these individual years were not good for either soil texture sites, but the overall accuracy were on the same order as those obtained by others32,33. The large differences between simulated and measured grain yield and biomass may be related to our assumptions regarding soil physical properties and cultivar characteristics. The imprecise simulation of grain yield and biomass in these individual years probably reflects factors and/or events that are not considered in the model, such as heavy rainfalls, high winds, weed competition, crop diseases, hail damage, etc12.
Figure 4. Comparison of measured (open bars with error bars) and simulated (solid bars without error bars) grain yield and biomass (kg ha−1) at silt loam soil site.
Figure 5. Comparison of measured (open bars with error bars) and simulated (solid bars without error bars) grain yield and biomass (kg ha−1) at clay soil site.
Table 6. Mean measured values (calibration data set) and mean square error (RMSE), and d values in simulations of grain yield and biomass of silt loam and clay soil.
| Grain yield (kg ha−1) | Biomass (kg ha−1) | |||||||
|---|---|---|---|---|---|---|---|---|
| Mean | RMSE | d | Samples | Mean | RMSE | d | Samples | |
| Silt loam | 2042 | 777 | 0.808 | 18 | 5512 | 1871 | 0.836 | 18 |
| Clay | 2049 | 599 | 0.791 | 15 | 5353 | 1785 | 0.766 | 15 |
Inspection of the data comparisons presented in Fig. 1 to 5 indicates that the model was adequately calibrated for soil moisture, wheat phenology, grain yield and biomass.
Model validation
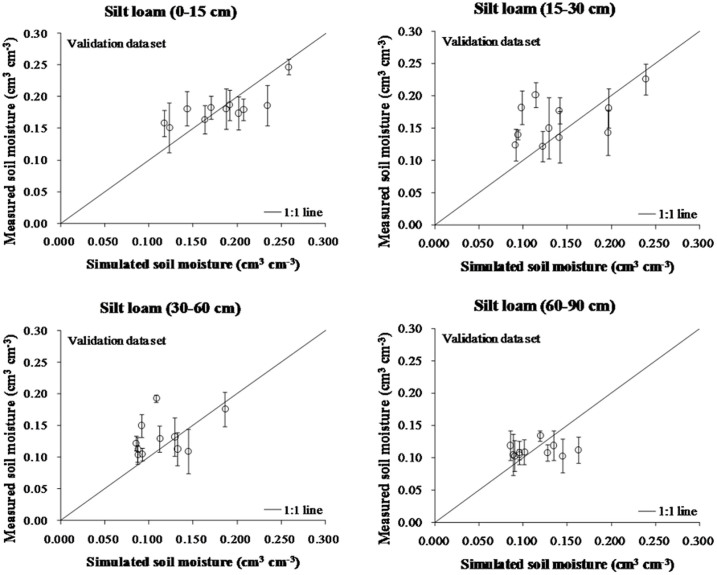
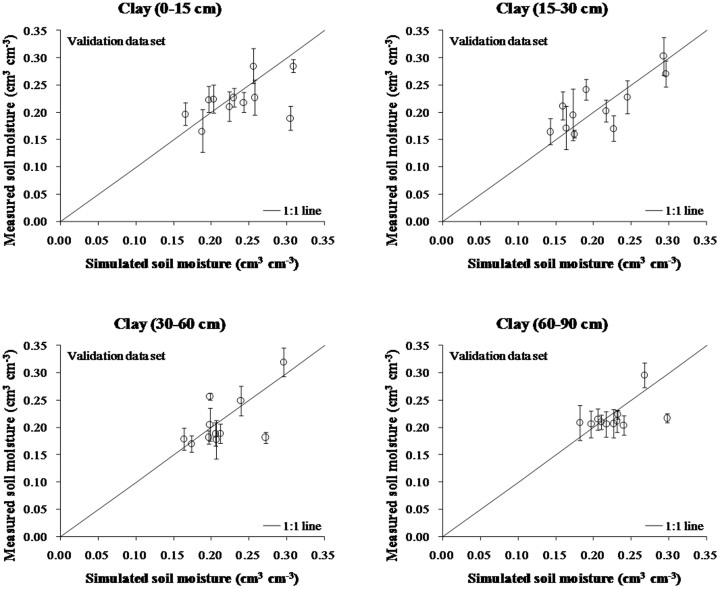
The results from the calibrated model were then compared with the remaining data, which were a continuation of the long-term study and the physiological study. The soil moisture simulations, in terms of RMSE in various soil layers of the silt loam and clay sites, ranged from 0.025 to 0.046 (cm3 cm−3), and from 0.031 to 0.042 (cm3 cm−3), respectively (Table 7). Their corresponding d values were higher than 0.9 in all layers. Figure 6 and 7 shows that the simulated soil moisture in all layers are scattered more or less equally around the 1:1 line for all textures, indicating that there were no systematic deviations in the model simulation, and that the soil moisture was simulated reasonably well for both soil textures.
Table 7. Mean measured values (validation data set) and mean square error (RMSE), and d values in simulations of soil moisture in different depth of silt loam and clay soil.
| Soil profile depth | Silt loam (cm3 cm−3) | Clay (cm3 cm−3) | ||||||
|---|---|---|---|---|---|---|---|---|
| (cm) | Mean | RMSE | d | Samples | Mean | RMSE | d | Samples |
| 0–15 | 0.181 | 0.027 | 0.983 | 12 | 0.223 | 0.042 | 0.996 | 12 |
| 15–30 | 0.162 | 0.046 | 0.965 | 12 | 0.211 | 0.032 | 0.999 | 12 |
| 30–60 | 0.131 | 0.037 | 0.980 | 12 | 0.209 | 0.036 | 0.999 | 12 |
| 60–90 | 0.111 | 0.025 | 0.990 | 12 | 0.219 | 0.031 | 0.995 | 12 |
Figure 6. Comparison of measured (validation data set) vs. simulated soil moisture in layers at silt loam soil site.
Error bars indicate standard deviation of measured means.
Figure 7. Comparison of measured (validation data set) vs. simulated soil moisture in layers at clay soil site.
Error bars indicate standard deviation of measured means.
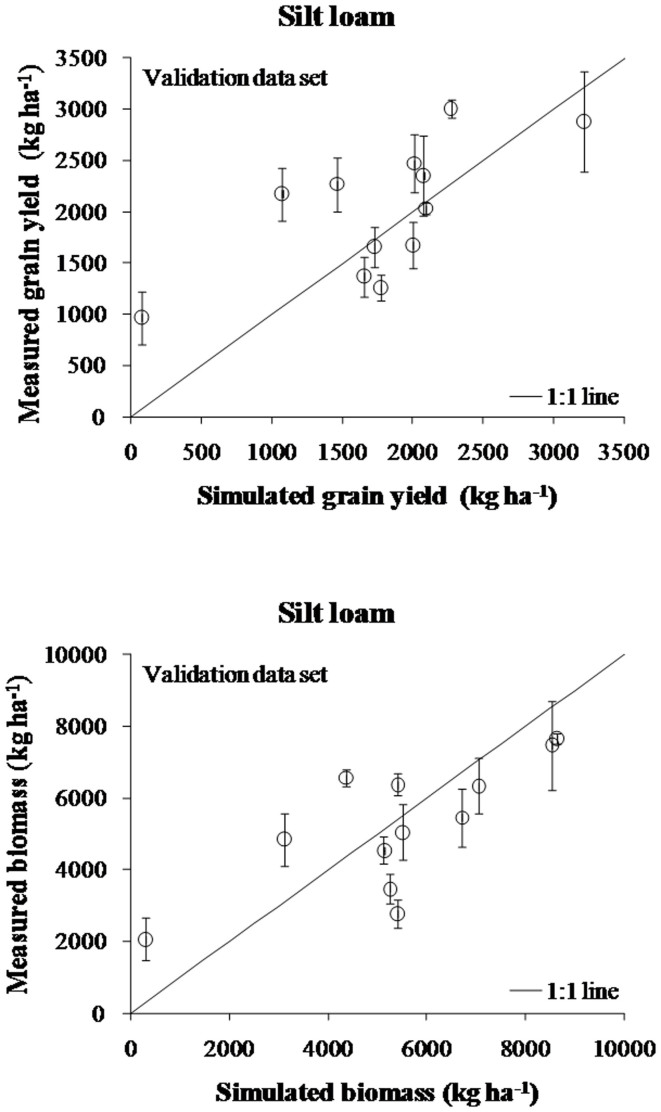
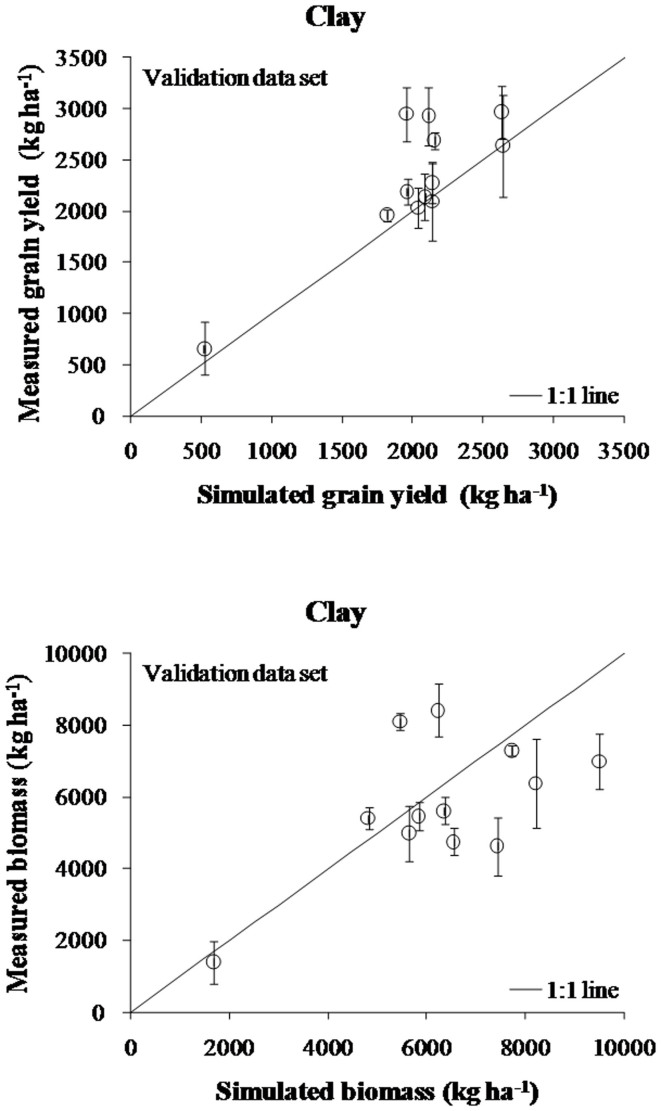
Wheat phenology was fairly well simulated with both a low RMSE (3.15 days) and a high d value (0.997) in year 2006 (Table 5 and Fig. 8). Overall, the simulated mean and ranges of grain yields for the two soil texture sites corresponded closely to observed means and ranges (Fig. 9 and 10). The model also correctly simulated the biomass of the two soil texture sites with a relative low RMSE (<1688 kg ha−1) and a high d value (>0.77) (Table 8), and equally distributed scattering around the 1:1 line for both soil textures (Fig. 9 and 10).
Figure 8. Comparison of measured (validation data set) vs. simulated wheat phenology in year 2006.
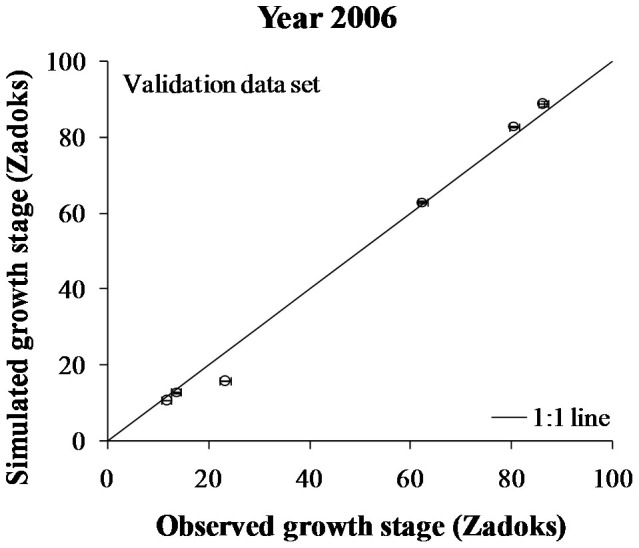
Error bars indicate standard deviation of measured means.
Figure 9. Comparison of measured (validation data set) vs. simulated grain yield and biomass at silt loam soil site.
Error bars indicate standard deviation of measured means.
Figure 10. Comparison of measured (validation data set) vs. simulated grain yield and biomass at clay soil site.
Error bars indicate standard deviation of measured means.
Table 8. Mean measured values (validation data set) and mean square error (RMSE), and d values in simulations of grain yield and biomass of silt loam and clay soil.
| Grain yield (kg ha−1) | Biomass (kg ha−1) | |||||||
|---|---|---|---|---|---|---|---|---|
| Mean | RMSE | d | Samples | Mean | RMSE | d | Samples | |
| Silt loam | 2012 | 581 | 0.792 | 12 | 5225 | 1494 | 0.839 | 12 |
| Clay | 2296 | 426 | 0.868 | 12 | 5795 | 1688 | 0.770 | 12 |
Comparison of water use between silt loam and clay soil
After validation, the model was then used to compare the precipitation use (PU) and water use (WU) between the two soil textures based on the simulation outputs (soil moisture in profile, maturity, grain yield). The PU was defined as total precipitation received between seeding and maturity for each growing season. The WU was calculated as the difference of soil moisture (0 to 1.8 m depth) between seeding and maturity, plus PU34. As shown in Fig. 11, the WU for the two soil textures has a similar trend over the years due to the predominant common effect factor of precipitation amount during the growth period.
Figure 11. Comparison of simulated water use in silt loam and clay soil.
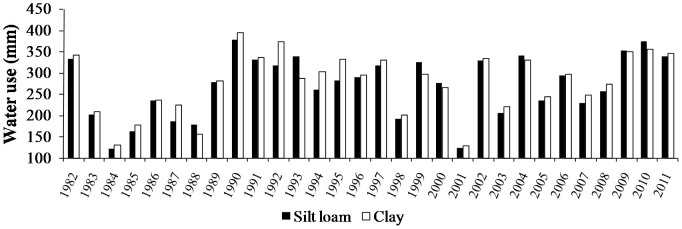
The difference in WU between the two soil textures are mainly affected by soil differences in water holding capacity. These differences ranged from 2 to 57 mm. A minor amount of the differences in WU would be due to the 1 to 7 day differences between the seeding dates at the two sites. A noticeable trend was found that the clay soil has higher WU than silt loam soil in most drought years (defined as those years, 1984, 1985, 1987, 2001, 2007 and 2009, that fell into the lowest quantile of growing season precipitation). This result explains why the clay soil out-yields the silt loam soil in most drought years (Table 1).
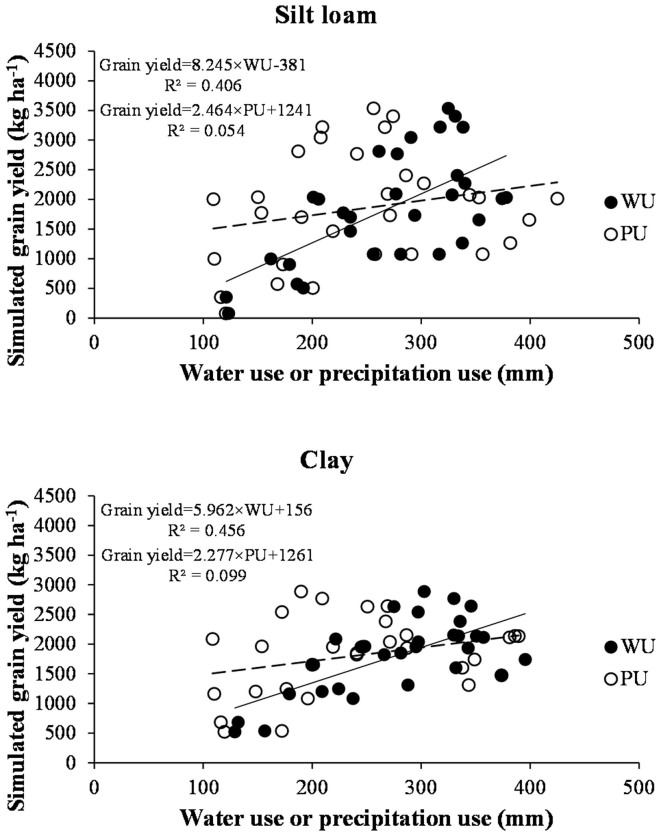
The relationship between grain yield and the WU was linear for both silt loam and clay soils (Fig. 12). The slopes for the two equations are 8.245 and 5.962, respectively, and are assumed to provide some measure of sensitivity of grain yield to WU. The larger slope for wheat grown on a silt loam soil shows it is more sensitive to WU than wheat grown on a clay soil. The R2 of fitted equations of simulated WU and simulated yield of silt loam was higher than that of clay soil, also indicating that silt loam is more sensitive than clay soil, which coincides with our previous statistical analysis15. The R2 of fitted linear relationships between simulated WU and simulated yield were much higher than those between PU and simulated yield for both silt loam and clay soils. This demonstrates that, yield variation is much better be explained by WU than by PU. This result clearly shows that soil texture plays an important role in affecting the soil × crop interaction and thus the yield.
Figure 12. Liner relationships between water use (WU) or precipitation use (PU) and simulated grain yield in silt loam and clay soil over 30 years (1982–2011).
Discussion
The objective of this study is to evaluate the effect of soil texture on wheat productivity in rain-fed condition. However, to understand the variation led by soil texture is challenging due to a lot of confounding factors. To achieve the goal of our objective, we adopted an agricultural system model (CSM-CERES-Wheat model). It is largely recognized that the model need to be well calibrated and validated before applied for account for the impacts35,36. Therefore, a long-term (1982–2011) continuous wheat experiment in southwest Saskatchewan, on both silt loam and clay soils was used to calibrate and validate the model. This data set is ideal for investigation of soil textures' impact, which because other factors such as cultivar characteristics and field management are all same in these two sites every year. The two sites also have very similar weather condition since only 30 km away from each other. Therefore, the main contribution to yield difference should due to soil texture.
The model performance for simulating yields, although not better than for soil moisture and phenology, was comparable to that of other research with simulation models31,32. The large differences between simulated and measured grain yield and biomass for some individual years may be related to inaccuracies in our assumptions regarding soil physical properties and sampling procedures. For example, grain yield simulation in 1993 at clay soil site deviated from the measured by 2819 kg ha−1 (error of −39%). During this crop season, the model was not able to simulate the soil water and nitrite dynamics well, leading to a water stress (0.27) during tillering stage and high nitrite stress (0.64) during the grain filling stage resulting in under prediction of biomass and grain yield (data not shown). Simulated biomass was higher than measurement in 1982 at clay soil site. This is partially due to sampling occurring at full maturity, which was about 10–20 days after physiological maturity when the wheat reached its maximum biomass. Some senescent leaves, ripened spikes and broken tillers fall to the ground during this period, and are difficult to recover. The inaccurate simulation of grain yield (1993) and biomass (1982) may also reflect factors and/or events that are not considered in the model, such as heavy rainfalls, high winds, and hail damage, etc., which need to be improved with further study.
The simulation output of validated model was used to analyze the WU difference caused by soil texture. The simulated result showed that clay soil has higher WU than silt loam soil in most dry years, which agrees with research conducted in the same area as our study, by Lehane and Staple (1953)37. They also found that in a dry year, wheat grown on clay soil had a higher yield than those grown on silt loam soil. They attributed this effect to differences in crop access to the available moisture between soil textures. Wheat grown on coarser soil textures are able to readily extract stored soil water and spring precipitation, leading to lush early growth and heavy tillering. Providing there is sufficient summer rains to replenish soil water, these crops have good growth and high yields. However, if soil water is not well replenished by summer rains, the wheat grown on coarser textured soils is unable to extract sufficient soil water to overcome water stress and so productivity suffers. In contrast, the wheat grown on fine textured soils are less able to extract soil moisture in the spring due to the water holding characteristics of the clay soil. Productivity is thus limited. However, if subsequent summer rains are insufficient to replenish soils water, the crops grown on clay soil are still able to access remaining soil water that they did not use in the spring. The results is that crops grown on clay soils are less sensitive to water use than those grown on coarser textured soils and produce higher yield in drought years38. Our simulation result concurs with these reports.
In conclusion, we found the CSM-CERES-Wheat model can be used as a tool to estimate the soil texture effects on crop productivity and WU. Crops grown on clay soil has better drought tolerance than those grown on silt loam in the climatic conditions of our study. We suggest that this work on estimating soil texture effects on WU and yield with simulation models be validated over a wider range of soil textures. The use of simulation models may lead to a better understanding of the crop–soil texture interactions, enabling crop breeders to analyze the performance of different crop genetics with regard to the broad soil textures that they target. For example, for cultivars targeted for production on clay soils, developing a variety that can extract more water from clay soil may improve both drought tolerance and production.
Author Contributions
Y.H. and H.W. analyzed data; H.W. and B.M. performed research; Y.H., K.H., L.H. and H.W. wrote the paper.
References
- Lobell D. B. & Ortiz-Monasterio J. I. Evaluating strategies for improved water use in spring wheat with CERES. Agr. Water Manage. 84, 249–258 (2006). [Google Scholar]
- McConkey B. G., Campbell C. A., Zentner R. P., Dyck F. B. & lelles F. Long-term tillage effects on spring wheat production on three soil textures in the Brown soil zone. Can. J. Plant Sci. 76, 747–756 (1996). [Google Scholar]
- Zentner R. P. et al. Cropping frequency, wheat classes and flexible rotations: Effects on production, nitrogen economy, and water use in a Brown Chernozem. Can. J. Plant Sci. 83, 667–680 (2003). [Google Scholar]
- Campbell C. A. et al. Long-term effects of cropping system and nitrogen and phosphorus fertilizer on production and nitrogen economy of grain crops in a Brown Chernozem. Can. J. Plant Sci. 85, 81–93 (2005). [Google Scholar]
- Parton W. J., Schimel D., Cole C. V. & Ojima D. S. Analysis of factors controlling soil organic matter levels in Great Plains grasslands. Soil Sci. Soc. Am. J. 51, 1173–1179 (1987). [Google Scholar]
- Carnol M. et al. The effects of ammonium sulphate deposition and root sinks on soil solution chemistry in coniferous forest soils. Biogeochemistry 38, 255–280 (1997). [Google Scholar]
- Chaudhari S., Singh R. & Kundu D. Rapid textural analysis for saline and alkaline Soils with different physical and chemical properties. Soil Sci. Soc. Am. J. 72, 431–441 (2008). [Google Scholar]
- Turner N. C. Agronomic options for improving rainfall-use efficiency of crops in dryland farming systems. J. Exp. Bot. 55, 2413–2425 (2004). [DOI] [PubMed] [Google Scholar]
- Smith W. N. et al. Assessing the effects of climate change on crop production and GHG emissions in Canada. Agric. Ecosyst. Environ. 179, 139–150 (2013). [Google Scholar]
- Lobell D. B., Ortiz-Monasterio J. I., Addams C. L. & Asner G. P. Soil, climate, and management impacts on regional wheat productivity in Mexico from remote sensing. Agr. Forest Meteorol. 114, 31–43 (2002). [Google Scholar]
- Liu H. L. et al. Simulating water content, crop yield and nitrate-N loss under free and controlled tile drainage with subsurface irrigation using the DSSAT model. Agr. Water Manage. 98, 1105–1111 (2011). [Google Scholar]
- Liu H. L. et al. Using the DSSAT-CERES-Maize model to simulate crop yield and nitrogen cycling in fields under long-term continuous maize production. Nutr. Cycl. Agroecos. 89, 313–328 (2011). [Google Scholar]
- Liu S., Yang J. Y., Zhang X. Y., Drury C. F., Reynolds W. D. & Hoogenboomd G. Modelling crop yield, soil water content and soil temperature for a soybean rolled tile drainager conventional and conservation tillage systems in Northeast China. Agr. Water Manage. 123, 32–44 (2013). [Google Scholar]
- Timsina J. & Humphreys E. Performance of CERES-Rice and CERES-Wheat models in rice-wheat systems: a review. Agr. Syst. 90, 5–31 (2006). [Google Scholar]
- He Y. et al. Spring wheat yield in the semiarid Canadian prairies: Effects of precipitation timing and soil texture over recent 30 years. Field Crop. Res. 149, 329–337 (2013). [Google Scholar]
- He Y., Wang H., Qian B., McConkey B. & DePauw R. M. How early can the seeding dates of spring wheat be under current and future climate in Saskatchewan, Canada? PLoS ONE 7, e45153 (2012). [DOI] [PMC free article] [PubMed] [Google Scholar]
- Marchildon G. P., Kulshreshtha S., Wheaton E. & Sauchyn D. Drought and institutional adaptation in the Great Plains of Alberta and Saskatchewan, 1914–1939. Nat. Hazards 45, 391–411 (2007). [Google Scholar]
- Ayres K. W., Acton D. F. & Ellis E. G. The soils of the Swift Current Map Area 72J, Saskatchewan (University of Saskatoon, Saskatoon, Saskatchewan, 1985). [Google Scholar]
- Robertson G. E. O. W. Wheat yields for 50 years at swift current Saskatchewan in relation to weather. Can. J. Plant Sci. 54, 625–650 (1974). [Google Scholar]
- McConkey B. G., Curtin D., Campbell C. A., Brandt S. A. & Selles F. Crop and soil nitrogen status of tilled and no-tillage systems in semi-arid regions of Saskatchewan. Can. J. Plant Sci. 82, 489–498 (2002). [Google Scholar]
- Jame Y. W. & Cutforth H. W. Simulating the effects of temperature and seeding depth on germination and emergence of spring wheat. Agr. Forest Meteorol. 124, 207–218 (2004). [Google Scholar]
- Ritchie J. T. [Wheat phasic development.]. Modeling Plant and Soil Systems, Agronomy Monograph [Hanks, R. J. (ed.), Ritchie, J. T. (ed.)] [31–54] (ASA-CSSA-SSSA, Madison, Wisconsin, 1991). [Google Scholar]
- Wang H. et al. Predicting the time to 50% seedling emergence in wheat using a Beta model. NJAS-Wagen. J. Life. Sc. 57, 65–71 (2009). [Google Scholar]
- Thornton P. E., Hasenauer H. & White M. A. Simultaneous estimation of daily solar radiation and humidity from observed temperature and precipitation: an application over complex terrain in Austria. Agr. Forest Meteorol. 104, 255–271 (2000). [Google Scholar]
- Saxton K. E. & Rawls W. J. Soil water characteristic estimates by texture and organic matter for hydrologic solutions. Soil Sci. Soc. Am. J. 70, 1569–1578 (2006). [Google Scholar]
- Gijsman A. J., Thornton P. K. & Hoogenboom G. Using the WISE database to parameterize soil inputs for crop simulation models. Comput. Electron. Agr. 56, 85–100 (2007). [Google Scholar]
- Boote K. J. [Decision Support System for Agrotechnology Transfer Version 3.0.]. Concepts for calibrating crop growth models [Hoogenboom, G. (ed.), Wilkens, P. W. (ed.), Tsuji, G. Y. (ed.)] [179–200] (University of Hawaii, Honolulu, 1999). [Google Scholar]
- Wang H., McCaig T. N., DePauw R. M., Clarke F. R. & Clarke J. M. Physiological characteristics of recent Canada Western Red Spring wheat cultivars: Yield components and dry matter production. Can. J. Plant Sci. 82, 299–306 (2002). [Google Scholar]
- Willmott C. J. On the validation of models. Phys. Geogr. 2, 184–194 (1981). [Google Scholar]
- Meng L. & Quiring S. M. A comparison of soil moisture models using soil climate analysis network (SCAN) observations. J. Hydrometeorol. 9, 641–659 (2008). [Google Scholar]
- Hoogenboom G. et al. [Decision Support System for Agrotechnology Transfer Version 4.0.]. Overview [Hoogenboom, G. (ed.) et al.] (University of Hawaii, Honolulu, 2003). [Google Scholar]
- Kersebaum K. C. et al. Long-term simulation of soil-crop interactions in semiarid southwestern Saskatchewan, Canada. Eur. J. of Agron. 29, 1–12 (2008). [Google Scholar]
- Saseendran S. A., Nielsen D. C., Ma L. & Ahuja L. R. Adapting CROPGRO for simulating spring canola growth with both RZWQM2 and DSSAT4.0. Agron. J. 102, 1606–1628 (2010). [Google Scholar]
- Kröbel R. et al. Nitrogen and phosphorus effects on water use efficiency of spring wheat grown in a semi-arid region of the Canadian prairies. Can. J. Plant Sci. 92, 573–587 (2012). [Google Scholar]
- Rötter R. P., Carter T. R., Olesen J. E. & Porter J. R. Crop-climate models need an overhaul. Nat. Clim. Change 1, 175–177 (2011). [Google Scholar]
- Webber H., Gaiser T. & Ewert F. What role can crop models play in supporting climate change adaptation decisions to enhance food security in Sub-Saharan Africa? Agr. Syst. 127, 161–177 (2014). [Google Scholar]
- Lehane J. J. & Staple W. J. Water retention and availability in soils related to drought resistance. Can. J. Plant Sci. 33, 265–273 (1953). [Google Scholar]
- Lehane J. J. & Staple W. J. Effects of soil moisture tensions on growth of wheat. Can. J. Plant Sci. 42, 180–188 (1962). [Google Scholar]


