Abstract
Extra forces or torques are defined as forces or torques that are larger than would be expected from the input or stimuli, which can be mediated by properties intrinsic to motoneurons and/or to the muscle. The purpose of this study was to determine whether extra forces/torques evoked during electrical stimulation of the muscle or its nerve with variable frequency stimulation are modulated by muscle length/joint angle. A secondary aim was to determine whether extra forces/torques are generated by an intrinsic neuronal or muscle property. Experiments were conducted in 14 able-bodied human subjects and in eight adult decerebrate cats. Torque and force were measured in human and cat experiments, respectively. Extra forces/torques were evoked by stimulating muscles with surface electrodes (human experiments) or by stimulating the nerve with cuff electrodes (cat experiments). In humans and cats, extra forces/torques were larger at short muscle lengths, indicating that a similar regulatory mechanism is involved. In decerebrate cats, extra forces and length-dependent modulation were unaffected by intrathecal methoxamine injections, despite evidence of increased spinal excitability, and by transecting the sciatic nerve proximal to the nerve stimulations. Anesthetic nerve block experiments in two human subjects also failed to abolish extra torques and the length-dependent modulation. Therefore, these data indicate that extra forces/torques evoked during electrical stimulation of the muscle or nerve are muscle length-dependent and primarily mediated by an intrinsic muscle property.
Introduction
Extra forces or torques are defined as forces or torques that are larger than what would be expected from the input or stimuli. Extra forces/torques can be generated by nonlinear input/output properties intrinsic to spinal neurons or to the muscle itself. Spinal motoneurons have voltage-dependent persistent inward currents (PICs) that, when activated, amplify synaptic inputs and produce sustained depolarizations, or plateau potentials (Kiehn, 1991; Heckman et al., 2003, 2005; Hultborn et al., 2004; Brownstone, 2006). Changing limb position modulates PIC amplitude recorded intracellularly from ankle plantarflexor motoneurons in paralyzed decerebrate cats (Hyngstrom et al., 2007). Increased PIC amplitudes were attributed to muscle length-dependent changes in reciprocal inhibition from antagonist muscles.
Nonlinear input/output properties intrinsic to the muscle can also produce extra forces (Binder-Macleod and Kesar, 2005). For example, greater force is produced at the same stimulation frequency on the descending slope of triangular frequency ramps (Binder-Macleod and Clamann, 1989); twitch tension increases following high-frequency stimulation, termed post-tetanic potentiation (PTP) (Close and Hoh, 1968; Balnave and Allen, 1996); maintained low-frequency stimulation progressively increases force production, referred to as staircase (Rack and Westbury, 1969; Rassier and MacIntosh, 2002; Zhi et al., 2005); and more force is generated when pulse intervals are shortened, called doublet potentiation (Burke et al., 1970; Binder-Macleod and Clamann, 1989; Binder-Macleod and Barrish, 1992; Sandercock and Heckman, 1997). The PTP (Roszek et al., 1994; Rassier and MacIntosh, 2002), staircase (Stephenson and Williams, 1982; ter Keurs et al., 1984; Rassier and MacIntosh, 2002), and doublet potentiation (Sandercock and Heckman, 1997; Mela et al., 2002) all increase at short muscle lengths and occur in preparations with muscle nerves or ventral roots sectioned, and/or in deeply anesthetized preparations (Binder-Macleod and Kesar, 2005).
In humans, the extra forces/torques generated during electrical stimulation at variable frequencies were proposed to evaluate the plateau-like behavior of motoneurons (Collins et al., 2001, 2002; Nickolls et al., 2004; Blouin et al., 2009). The method consists of electrically stimulating muscles or their nerves using surface electrodes at high frequency (>80 Hz). Extra forces/torques are thought to be mediated by a reflex mechanism, because peripheral nerve block abolished the response (Collins et al., 2001, 2002; Blouin et al., 2009; Lagerquist et al., 2009). However, because the method relies on measuring force or torque produced by the muscle, part or all of the extra forces/torques could be mediated by an intrinsic muscle property.
In the present study, ankle muscles or their nerves were electrically stimulated in humans and decerebrate cats to determine whether extra forces/torques are modulated by joint angle/muscle length and whether extra forces/torques are mediated by plateau-like behavior of spinal motoneurons and/or by an intrinsic muscle property. We hypothesized that electrically evoked extra forces/torques would increase at long muscle lengths in humans and cats, consistent with intracellular recordings in decerebrate cats (Hyngstrom et al., 2007). However, in human and cat experiments, extra forces/torques increased progressively at shorter muscle lengths. Additional findings indicate that extra forces/torques are generated primarily, if not exclusively, by an intrinsic muscle property.
Materials and Methods
Ethical information: human experiments.
Fourteen able-bodied human subjects (five females, nine males) participated in the study. All procedures were approved by the Institutional Review Board of Northwestern University/Rehabilitation Institute of Chicago, which conformed to the Declaration of Helsinki, and all subjects provided written informed consent. Subjects were free to withdraw from the experiment at any time and were recruited from Northwestern University's (Chicago, Illinois) population.
Ethical information: cat experiments.
All procedures were approved by the Institutional Animal Care and Use Committee of Northwestern University. All animals were obtained from a designated breeding establishment for scientific research. Before the experiments, animals were housed and fed within designated areas, which were monitored daily by veterinarians and trained personnel. Data were compiled from eight adult cats weighing between 3.0 and 4.0 kg.
Cats were first placed in a clear plastic cylinder and anesthetized with 1.5–3% isoflurane in a 1:3 mixture of O2 and NO2. After ∼15 min, anesthesia was continued with a mask. Once the animal was deeply anesthetized, a tracheotomy was performed and cats were intubated to provide the anesthesia. The right common carotid artery was cannulated to monitor blood pressure and the right jugular vein was cannulated for fluid administration. The level of anesthesia was confirmed and adjusted by monitoring blood pressure, applying pressure to the paw to detect limb withdrawal, and by verifying the size and reactivity of the pupils. The animal was then transferred to a stereotaxic frame for further surgery. Following a craniotomy, the cortex was removed and all tissue rostral to the colliculi was removed (i.e., a precollicular decerebration). At this point, animals are considered to have complete lack of sentience and anesthesia was discontinued. A lethal injection of potassium chloride (2 mm/kg) was administered at the end of the experiment through the right jugular vein.
Experimental design: human experiments.
Experiments lasted ∼2 h. Subjects were seated in an adjustable padded chair with their tested foot attached to a footplate of an isokinetic dynamometer (System 3; Biodex Medical Systems). The right leg was tested in all subjects, with the hip at 90° and the knee at 170–180° and held constant throughout the testing protocol. With the knee at close to full extension, the triceps surae muscles participate fully in producing the plantarflexor torque (Cresswell et al., 1995). The foot was firmly secured with Velcro straps to the dynamometer arm, which was coupled to a six degree of freedom load cell (ATI) to measure torque. Torque signals were low-pass filtered at 200 Hz and sampled at 1000 Hz.
Surface electrodes were also placed over the proximal and distal tibialis anterior (TA; 5 cm diameter, round electrodes; Dermatrode; American Imex), and over the proximal and distal gastrocnemii (7 × 13 cm electrodes; Durastick II; Chattanooga Group) for electrical stimulation of ankle dorsiflexors and plantarflexors, respectively. Muscle stimulation was evoked with a Model DS7A constant-current stimulator (Digitimer) controlled by a custom-made computer program (LabVIEW; National Instruments).
Experimental protocol: human experiments.
At the beginning of the experiment, the torque was measured during two maximal voluntary efforts (MVEs) at an ankle joint of 90° for plantarflexors, and at an ankle joint of 120° for dorsiflexors. Attempted MVEs lasted ∼5 s with >1 min rest between trials. The maximal evoked twitch (MET) torque was then determined using 50–100% maximal stimulator output (100 mA) with an electrical train (five pulses of 1 ms duration at 100 Hz). The MET torque was determined at an ankle joint of 90° for plantarflexors, and at an ankle joint of 120° for dorsiflexors. The stimulation intensity required to evoke a twitch torque of 10–15% MET torque was then determined. This stimulation intensity was used to evoke extra torque at different joint angles throughout the experiment.
To evaluate extra torque, the ankle plantarflexors or dorsiflexors were electrically stimulated for 2 s at 25 Hz, followed by 2 s at 100 Hz, then 2 s at 25 Hz, for a total of 6 s. We refer to this as top hat stimulation because of the shape of the change in stimulation frequency. Pulse duration was 1 ms at the different frequencies. This protocol was used previously to evaluate extra force/torque (Collins et al., 2001, 2002; Collins, 2007). The top hat stimulation was given two to three times at five different ankle joint angles (90°, 100°, 110°, 120°, and 130° for ankle plantarflexors and dorsiflexors). The testing order of joint angles was randomized across subjects. Top hat stimulations were separated by ≥1 min to avoid frequency-dependent facilitation of the motor units (Gorassini et al., 2002a,b) and the subject's leg was periodically removed from the foot strap to prevent numbness. Before stimulation, the subjects were instructed to relax completely.
In two subjects, an anesthetic block of the common peroneal (CP) and/or tibial nerve was made by an experienced physician. The CP nerve was blocked in one subject and both nerves in the second subject. The nerves were located visually with an ultrasound unit (Siemens Acuson Antares) and probe (VF13–5 transducer, frequency range of 13–5 MHz). Once the nerves were located, 15–30 ml of lidocaine (2%) were injected at the sites with a sterile needle. The block was confirmed visually using the ultrasound and by the subject's inability to voluntarily contract the dorsiflexors and/or plantarflexors.
Experimental design: cat experiments.
Experiments lasted from 9 to 15 h. The left hindlimb was tested in all cats. In six cats, to record force from the triceps surae muscles, the Achilles tendon was freed from surrounding tissue, leaving only a small piece of the calcaneus bone attached. The tendon was connected through an in-series force transducer to a linear motor (Copley Controls), which was controlled by custom-made software to alter muscle length. To evoke a tendon vibration reflex (TVR), the linear motor was programmed to stretch and shorten the muscle (80 μm at 180 Hz). In one cat, the patellar tendon was freed from surrounding tissue, leaving the patella attached. A hole was drilled through the patella and the bone tendon was attached to the force transducer with suturing silk. The hip was extended and the knee was flexed to prevent the tendon and force transducer from making contact with anything. Force signals were low-pass filtered at 1000 Hz and sampled at 5000 Hz. The ankle was fixed with orthopedic external fixators attached to the medial and lateral malleoli. The knee joint was also fixed with a custom-made clamp attached to the femoral epicondyles. Hip joint angle was ∼130° and the knee angle was near maximal extension (i.e., 180°).
Bipolar stimulating cuff electrodes were placed around the lateral gastrocnemius-soleus (LGS) and medial gastrocnemius (MG) nerves in six cats and around the quadriceps (Quad) nerve in the inguinal region of one cat. Bipolar wire electrodes were inserted into the lateral gastrocnemius (LG), MG, and/or soleus muscles for electromyography (EMG) or stimulation, as well as in the vastus lateralis (VL) muscle in one cat. EMG signals were amplified (×1000), bandpass filtered (300–3000 Hz), and sampled at 5000 Hz simultaneously with the force data. Stimulation of nerves or muscles was done using a Model DS7A constant-current stimulator (Digitimer) controlled by a custom-made computer program (LabVIEW; National Instruments).
A laminectomy was made from L6–S1 in two cats. A cannula was inserted intrathecally to deliver methoxamine (one or two injections of 280 μl of 100 mm solution) later on in the experiment. Methoxamine is an alpha-1 noradrenergic agonist that was shown to considerably amplify motoneuron PICs in decerebrate cats (Lee and Heckman, 1996, 1999).
In addition, in three cats, we cut the femoral nerve in the inguinal region just before it separates into saphenous, Quad, and sartorius nerves. This was done early in the surgery, before any recordings, to minimize movements of the leg during the electrical stimulation protocols. In six cats, late in the experiment, we cut the sciatic nerve approximately mid-thigh, before it provides branches to biceps femoris, semitendinosus, and semimembranous, to abolish all central contributions to contractions of ankle plantarflexors evoked by electrical stimulation. Postmortem analysis confirmed that the sciatic nerve were completely sectioned.
Experimental protocol: cat experiments.
At the beginning and throughout the experiments, the lowest stimulation intensity that evoked a muscle twitch response (i.e., the motor threshold) was determined for the different nerve or muscle stimulations. Stimulation intensity is expressed as multiples of this threshold. To evaluate extra forces of ankle plantarflexors, the LGS and/or MG nerves, as well as individual muscles, were stimulated using a variety of stimulation protocols. In preliminary experiments, we determined the stimulation protocol that evoked the most consistent extra force, similar to what was found in human subjects for extra torque. Stimulating a muscle or its nerve at 100 Hz did not produce extra forces; instead, it produced a rapid decline in muscle force, most likely because of muscle fatigue (Rack and Westbury, 1969). A stimulation protocol of 2 s at 20 Hz, followed by 2 s at 40 Hz, and then 2 s at 20 Hz, for a total of 6 s, produced the most consistent extra force (i.e., force produced during the second 20 Hz stimulation compared with the first 20 Hz stimulation). The top hat stimulation was performed with pulse durations of 0.1, 1, or 2 ms. Top hat stimulations were given two to three times at five or six different muscle lengths. The neutral or 0 muscle length corresponds to an ankle joint angle of 90°. Muscle lengths tested were −2.5, 0, +2.5, +5, +7.5, and +10 mm from neutral. Thus, −2.5 and 0 mm muscle lengths correspond to the shortest muscle lengths tested, whereas +10 mm was the longest. Top hat stimulations were separated by ≥1 min to avoid frequency-dependent facilitation of the motor units (Gorassini et al., 2002a,b). Other electrical stimulation protocols were also used and are described in the Results.
Data analysis: human experiments.
Data were acquired and analyzed using custom-made software (LabVIEW; National Instruments). Torque signals were low-pass filtered at 10 Hz using a Butterworth filter (four pole, zero-phase lag). The torques produced 0.5 s before, during, and 2 s following the top hat stimulation were measured and divided into 0.5 s bins for a total of 17 bins. The torque produced during the last 1.5 s of the first and second 25 Hz stimulations was averaged, thus excluding the torque during the first 0.5 s of the 25 Hz stimulations. The torque value from the second 25 Hz stimulation was divided by the torque value from the first 25 Hz stimulation. This measure will be referred to as the extra torque, and is expressed as a percentage in the figures.
Data analysis: cat experiments.
Data were acquired and analyzed using Signal version 1.906 software (Cambride Electronic Design). The forces produced 0.5 s before, during, and 2 s following the top hat stimulation were measured and divided into 0.5 s bins for a total of 17 bins. The force produced during the last 1.5 s of the first and second 20 Hz stimulations was averaged, thus excluding the force during the first 0.5 s of the 20 Hz stimulations. The force value from the second 20 Hz stimulation was divided by the force value from the first 20 Hz stimulation. This measure will be referred to as the extra force, and is expressed as a percentage in the figures.
Statistical analysis: human and cat experiments.
All statistical tests were done with SPSS 17.0. For group data, a one-factor (i.e., joint angle) repeated-measures ANOVA, with five levels (i.e., five different joint angles/muscle lengths), was performed on the extra forces/torques. If there was a significant difference, pairwise comparisons with a Bonferroni correction was performed. Significance for all tests was determined at p < 0.05.
Results
Modulation of extra torques at different joint angles: human experiments
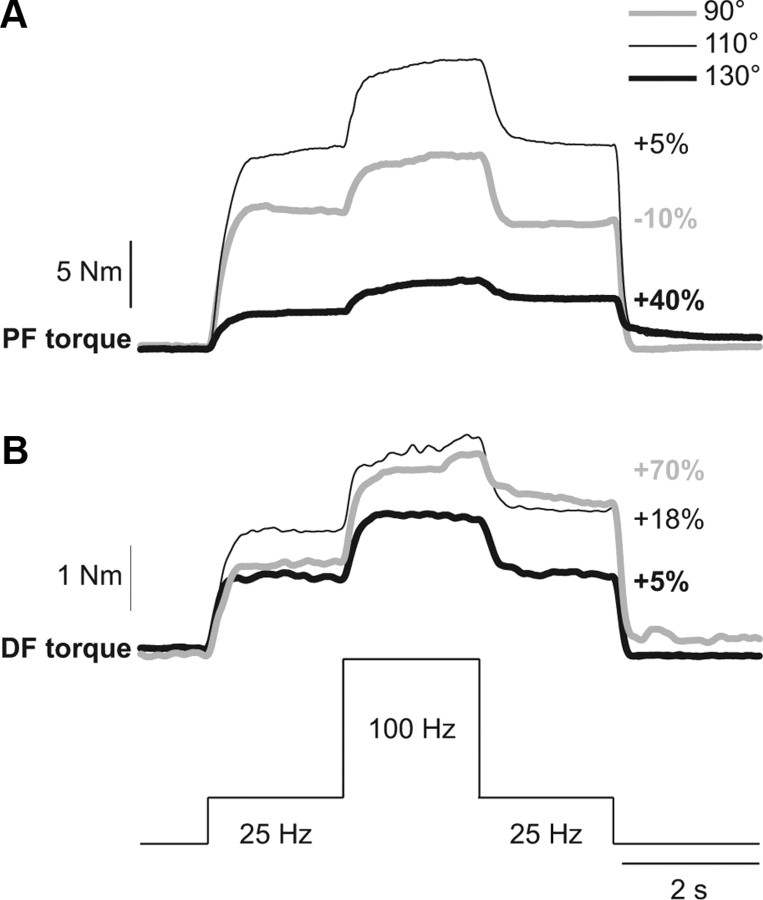
The extra torque evoked with the top hat stimulation was measured at different ankle joint angles for ankle plantarflexors (n = 9 subjects) and dorsiflexors (n = 13 subjects) in human subjects. Figure 1 shows the extra torque evoked with top hat stimulations of ankle plantarflexors (Fig. 1A) and ankle dorsiflexors (Fig. 1B) for a single subject, where torques produced at the different positions differed. In general, absolute torque values produced at longer muscle lengths are larger than at short muscle lengths because of biomechanical factors, such as the length-tension property of muscle (Rassier et al., 1999). In the present study, the focus was on the relative change in the extra torque (i.e., torque evoked during the second 25 Hz stimulation relative to the torque evoked during the first 25 Hz stimulation) at different joint angles. In some subjects, the second 25 Hz stimulation produced a torque that was smaller than the first 25 Hz stimulation at 90° in plantarflexors (Fig. 1A, negative percentage). Thus, there was no extra torque. There was a trend for the extra torque from plantarflexors to increase progressively from 90° to 130°. Similarly, from 130° to 90°, as the ankle dorsiflexor muscles were shortened, the extra torque evoked by stimulating the TA muscle tended to increase.
Figure 1.
Modulation of extra torques at different joint angles in a human subject. Torques evoked by plantarflexor (PF, A) and dorsiflexor (DF, B) top hat stimulations (25, 100, and 25 Hz) at ankle joint angles of 90°, 110°, and 130°. The extra torque (i.e., the torque produced during the second 25 Hz stimulation expressed as a percentage of the first 25 Hz stimulation) is shown on the right for each joint angle.
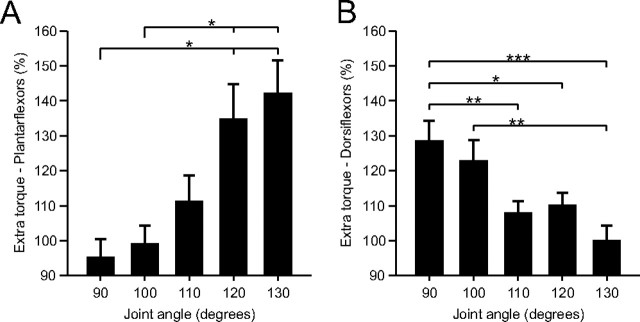
Across the group of able-bodied subjects, the extra torque produced by the top hat stimulation in plantarflexors (n = 9) and dorsiflexors (n = 13) was significantly influenced by joint angle (p < 0.001, repeated-measures ANOVA, sphericity assumed). On average, the extra torque was significantly greater when the muscle was shortened. For instance, at joint angles of 120° and 130° for plantarflexors (Fig. 2A), and at joint angles of 90° and 100° for dorsiflexors (Fig. 2B), the extra torque was significantly greater than at more lengthened positions (pairwise comparisons, p < 0.05). Therefore, extra torques in ankle plantarflexors and dorsiflexors are increased at positions where the stimulated muscles are shortened.
Figure 2.
Modulation of extra torques at different joint angles for the group of human subjects. Magnitude of the extra torque (torque evoked during second 25 Hz stimulation ÷ torque evoked during first 25 Hz stimulation × 100) for the group, evoked by plantarflexor (n = 9, A) and dorsiflexor (n = 13, B) top hat stimulations. Asterisks indicate significant differences between joint angles (pairwise comparisons with Bonferroni correction). Each bar is the mean ± SE. *p < 0.05, **p < 0.01, ***p < 0.001.
Modulation of extra forces at different muscle lengths: cat experiments
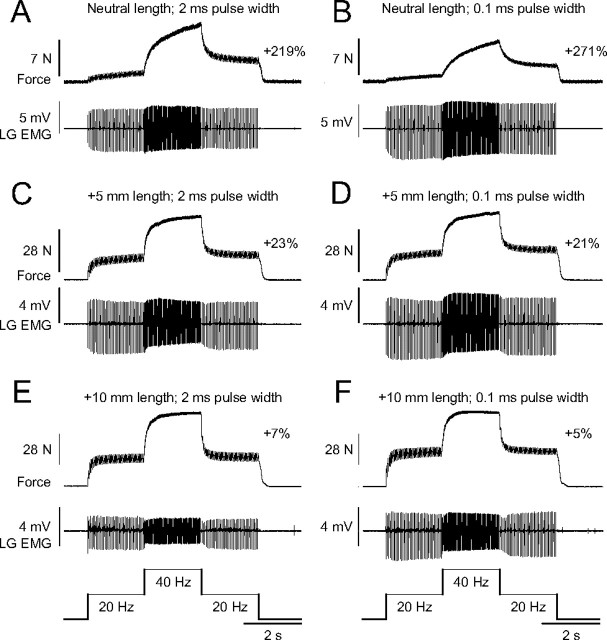
The extra force evoked by the top hat stimulation was measured at different muscle lengths (0, +2.5, +5, +7.5, +10 mm) for ankle plantarflexors (n = 6) and knee extensors (n = 1) in adult decerebrate cats. Figure 3 shows top hat stimulations of the left LGS nerve, which consisted of 2 s at 20 Hz, 2 s at 40 Hz, and 2 s at 20 Hz, at three different muscle lengths, using stimulation pulse widths of 2 ms (Fig. 3A,C,E) or 0.1 ms (Fig. 3B,D,F) in one adult cat. As can be seen, the extra force decreased as muscle length was increased. The largest extra forces were observed at short muscle lengths (Fig. 3A,B), whereas the smallest extra forces were evoked at the longest muscle lengths (Fig. 3E,F). Pulse widths of 2, 0.1, or 1 ms (data not shown) did not produce noticeably different results at any muscle length (compare Fig. 3A,C,E with Fig. 3B,D,F).
Figure 3.
Modulation of extra forces at different joint angles in an adult decerebrate cat. Forces produced by triceps surae muscles evoked by stimulating the LGS nerve during top hat stimulations with pulse widths of 2 ms (A, C, E) or 0.1 ms (B, D, F) at a neutral muscle length (A, B), with the muscle stretched 5 mm (C, D), and 10 mm (E, F). The extra force (i.e., the force produced during the second 20 Hz stimulation expressed as a percentage of the first 20 Hz stimulation) is shown on the right for each muscle length. The EMG of the LG muscle evoked during stimulations is shown below each force trace.
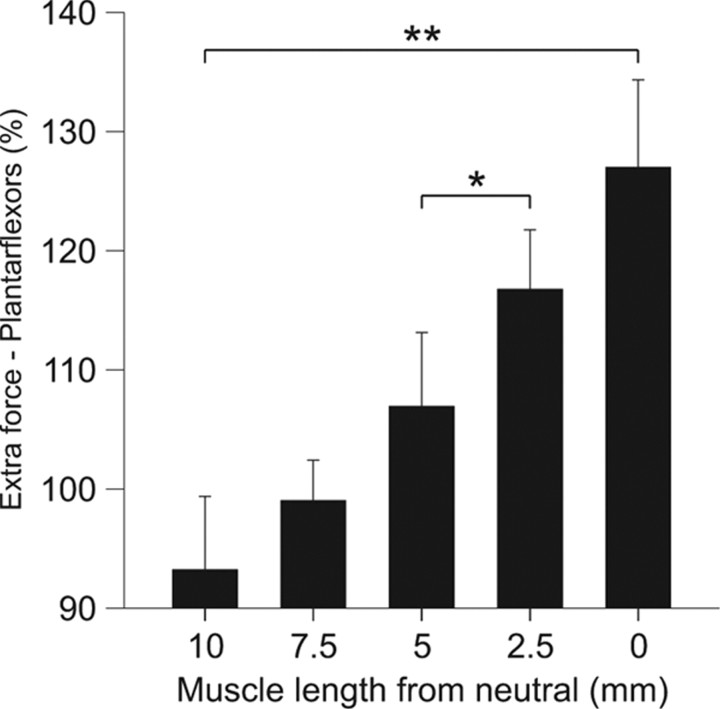
For the group, the extra force produced by the top hat stimulation in plantarflexors (n = 4) was significantly influenced by muscle length (p < 0.001, repeated-measures ANOVA, Huynh–Feldt correction). On average, the extra force was significantly greater when the muscle was short (Fig. 4). Therefore, extra forces in humans and cats evoked by top hat stimulations are greater at short muscle lengths.
Figure 4.
Modulation of extra forces at different muscle lengths for the group of adult decerebrate cats. Magnitude of the triceps surae extra forces (force evoked during the second 20 Hz stimulation ÷ the force evoked during first 20 Hz stimulation × 100) for the group (n = 4), evoked by stimulating the LGS or MG nerves with top hat stimulations (20, 40, and 20 Hz). Asterisks indicate significant differences between joint angles (pairwise comparisons with Bonferroni correction). Each bar is the mean ± SE. *p < 0.05, **p < 0.01.
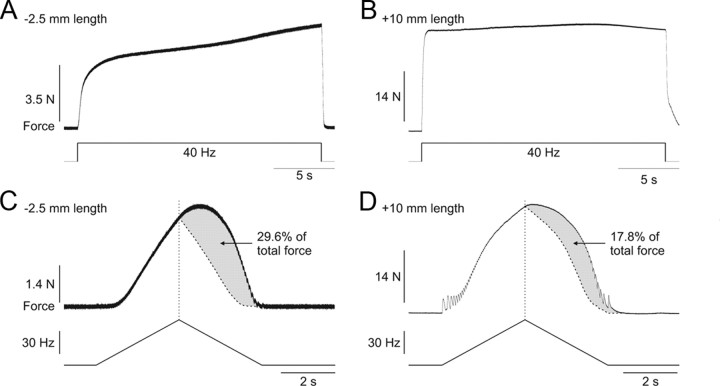
Extra forces in the cat were also assessed using different stimulation protocols. Figure 5 shows two of these stimulation protocols at short (Fig. 5A,C) and long (Fig. 5B,D) muscle lengths. Maintained 40 Hz stimulation of the LGS nerve for 20 s at a muscle length of −2.5 mm from neutral (i.e., a short muscle length) produced a progressive increase in force of the ankle plantarflexors (Fig. 5A). This progressive increase in force is referred to as the staircase phenomenon (Rack and Westbury, 1969; Rassier and MacIntosh, 2002; Zhi et al., 2005). However, at a muscle length of +10 mm from neutral (i.e., a long muscle length), 40 Hz stimulation for 20 s did not produce a progressive increase in force (Fig. 5B). Instead, the force rapidly reached a plateau. A greater staircase at short muscle lengths was previously reported (Stephenson and Williams, 1982; ter Keurs et al., 1984; Rassier and MacIntosh, 2002). Also of note, the compound action potential or M-wave evoked with each stimulation pulse decreased substantially at the long muscle length (Fig. 5B) compared with the short muscle length (Fig. 5A). Thus, despite a decrease of the M-wave, which indicates reduced activation of the muscle by nerve impulses, the force progressively increased or was maintained at the short and long muscle lengths, respectively.
Figure 5.
Extra forces evoked by other methods and their length-dependent modulation in an adult decerebrate cat. Force produced by stimulating the LGS nerve at 40 Hz for 20 s at muscle lengths of −2.5 mm (A) and +10 mm (B) from neutral. Force produced by stimulating the LGS nerve with a triangular frequency ramp from 4 to 60 Hz and back down to 4 Hz in a 6 s period at muscle lengths of −2.5 mm (C) and +10 mm (D) from neutral. The dotted vertical line represent the point of stimulation at 60 Hz and the curved dotted line represents a smoothed hypothetical symmetric force profile on the descending slope of the frequency ramp. The gray area illustrates the extra force, which is expressed as a percentage of the total force.
Figure 5, C and D, shows the force output of the triceps surae muscles with a triangular frequency ramp from 4 to 60 Hz and back to 4 Hz during a 6 s period at a muscle length of −2.5 and +10 mm, respectively. At both muscle lengths, the force that was generated on the descending slope of the ramp exceeded the force at the same stimulation frequency on the ascending slope of the triangular ramp. This phenomenon has been shown in anesthetized cats with sectioned ventral roots (Binder-Macleod and Clamann, 1989). Here, we show that this phenomenon is also muscle length-dependent because much more force, in relative terms, was produced at the short muscle length compared with the long muscle length (compare the gray areas in Fig. 5C and Fig. 5D, which illustrate the extra force on the down slope of the triangular ramp).
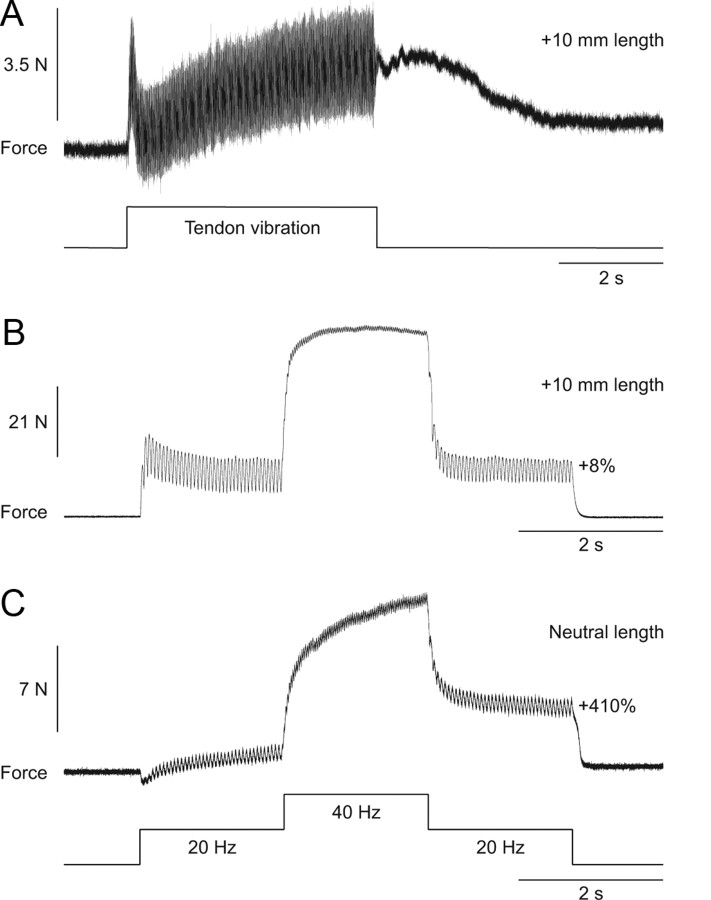
Another method that was used to evoke extra forces/torques was vibration of the tendon to evoke a TVR (Matthews, 1966a,b; Stuart et al., 1986). Tendon vibration at high frequency preferentially activates primary muscle spindles and Ia synaptic inputs were shown to modulate PICs in spinal motoneurons (Hyngstrom et al., 2007). The TVR was also proposed to be caused in part by the activation of plateau potentials in motoneurons (Stuart et al., 1986; Crone et al., 1988). The TVR is characterized by extra force following the termination of tendon vibration (Fig. 6A). In the present set of experiments, a clear and consistent TVR could only be induced at long muscle lengths. At the same muscle length as in Figure 6A, the top hat stimulation failed to evoke extra force (Fig. 6B). If, however, the muscle was shortened, a prominent extra force was generated by the top hat stimulation (Fig. 6C). The three trials shown in Figure 6 were performed in that order within a 5 min period, with at least 1 min rest in between stimulations.
Figure 6.
Extra forces evoked by Achilles tendon vibration and top hat stimulations at two different muscle lengths in an adult decerebrate cat. A, Force output generated by ankle plantarflexors during and following vibration of the Achilles tendon at a muscle length of +10 mm from neutral. B, C, Forces produced during 20, 40, and 20 Hz top hat stimulations at muscle lengths of +10 mm (B) and 0 mm (C) from neutral. The extra force (i.e., the force produced during the second 20 Hz stimulation expressed as a percentage of the first 20 Hz stimulation) during top hat stimulations is shown on the right for each muscle length.
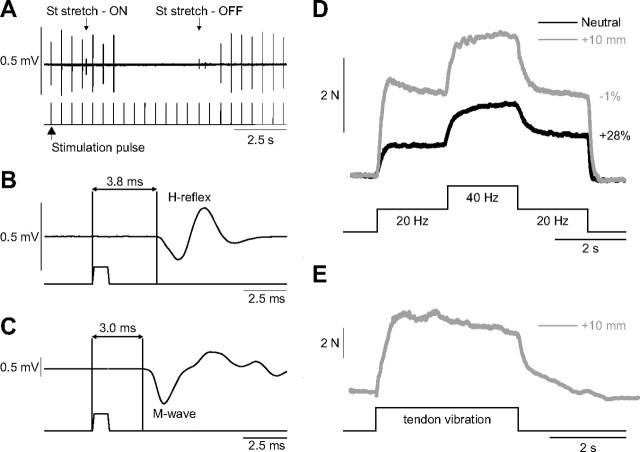
One of the drawbacks of electrically stimulating the LGS or MG nerves in the cat is that a pure sensory stimulation cannot be performed because Ia afferent fibers are approximately the same diameter as the motor axons (Cullheim and Kellerth, 1978; Banks et al., 1982). Thus, no clear dissociation of the H-reflex and M-wave is observed in triceps surae muscles. However, it was possible to evoke a clear H-reflex before motor axon activation (i.e., M-wave) by stimulating the Quad nerve and recording the response in the VL muscle (Fig. 7), indicating that some Ia afferents in the Quad nerve have a larger diameter than the largest alpha-motor axons. As shown in Figure 7A, at low stimulation intensities (<1.5T), the response to Quad nerve stimulation was completely abolished by stretching the antagonist muscle, the semitendinosus), confirming that this response is an H-reflex because the M-wave would not be affected by stretching the antagonist muscle. The latency of the H-reflex was also longer at 3.8 ms (Fig. 7B) compared with the M-wave at 3.0 ms (Fig. 7C). A stimulation intensity of 1.1T (i.e., a pure sensory stimulation) was then used for the top hat stimulation (Fig. 7D). Similar to stimulating the triceps surae nerves, extra forces were greater at short muscle lengths and abolished at long muscle lengths. In addition, a TVR was evoked at the long muscle length (Fig. 7E), but not at the short muscle length (data not shown).
Figure 7.
Determination of the H-reflex in the VL and extra forces of the quadriceps muscles. A, Stimulation of the Quad nerve in the inguinal region at low stimulation intensities (<1.5 T) evoked compound action potentials in the VL muscle that were abolished by stretching the semitendinosus (St) muscle, thus confirming that the response was an H-reflex. B, Latency of the H-reflex measured from stimulation onset to the first deflection of the EMG trace at a stimulation intensity of 1.1 T. C, Latency of the M-wave, measured from stimulation onset to the first deflection of the EMG trace, at a stimulation intensity of 3.0 T. D, Forces produced with top hat stimulations of the Quad nerve at 1.1 T at muscle lengths +10 and 0 mm from neutral. E, Force output generated by the Quad muscle group during and following vibration of the Quad tendon at a muscle length of +10 mm from neutral.
Methoxamine to increase motoneuron excitability
In adult cats decerebrate at precollicular or intercollicular level, motoneuron excitability is high due to tonic serotoninergic drive from the raphe nuclei (Crone et al., 1988). To further amplify motoneuron excitability, methoxamine was injected intrathecally at spinal segments L6–L7 in three cats, where ankle plantarflexor motoneuron pools are located (Vanderhorst and Holstege, 1997). Methoxamine is an alpha-1 noradrenergic agonist that was shown to potently amplify motoneuron PICs in adult decerebrate cats (Lee and Heckman, 1996, 1999). After methoxamine injection, blood pressure increased almost immediately (>40 mmHg increase). Methoxamine had no effect on the magnitude or length-dependent modulation of extra forces evoked by top hat stimulation of the left LGS nerve (Fig. 8A). However, methoxamine clearly influenced spinal excitability. For example, before methoxamine, and at a long muscle length (+5 mm from neutral), stimulation of the right tibial nerve at 40 Hz for 2.5 s (0.2 ms pulse width) generated a sustained contraction of the left triceps surae muscles that outlasted the stimulation and triggered sustained activity in the left soleus muscle (i.e., a crossed extensor reflex) (Fig. 8B), indicating that spinal excitability was already high. The crossed extensor reflex (XER) was greatly potentiated by methoxamine at the same muscle length (i.e., +5 mm from neutral). After methoxamine, soleus activity was tonic, which increased the baseline force, and right tibial nerve stimulation evoked a XER that had a much larger peak force, which did not return to baseline values 20 s following the stimulation (up to 8 s poststimulation is shown). Activity in the soleus muscle remained high following the stimulation. Ramp-and-hold stretches of the triceps surae muscles also triggered increased sustained activity in soleus following methoxamine injection, although the force generated was similar (Fig. 8C). Thus, despite clear signs of enhanced spinal neuronal excitability, methoxamine had no effect on extra forces evoked by top hat stimulations.
Figure 8.
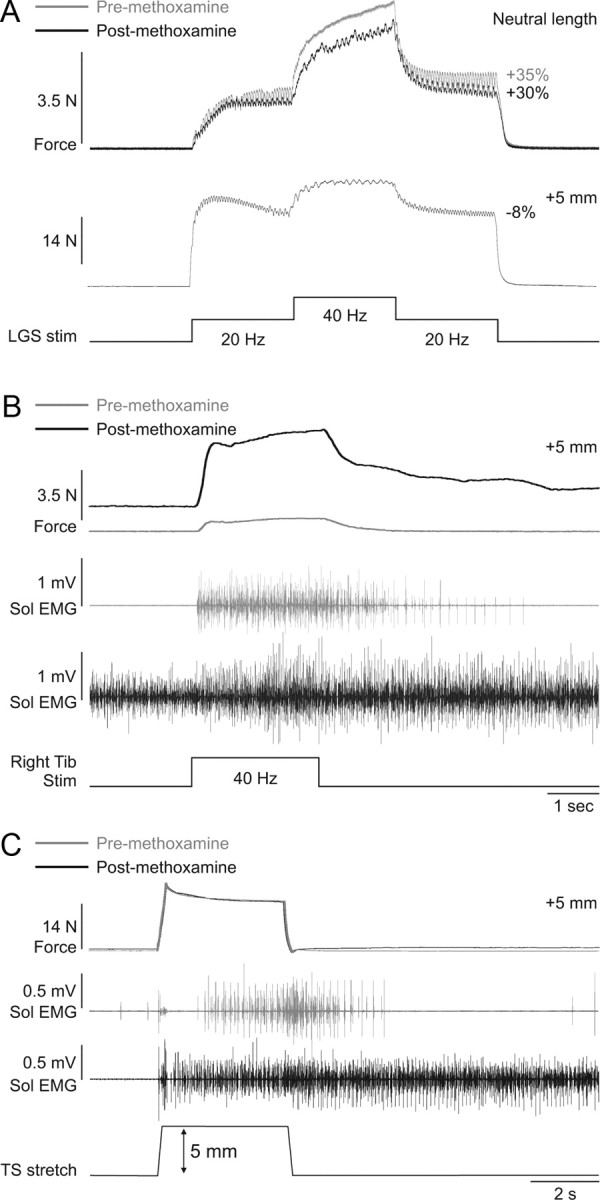
Methoxamine injection increases spinal excitability but has no effect on extra forces in an adult decerebrate cat. A, Forces produced by left triceps surae muscles evoked by stimulating the left LGS nerve during top hat stimulations (Stim, 1 ms pulse widths) before and after injecting methoxamine at neutral and long muscle lengths. B, Force generated by the left triceps surae muscles with stimulation of the right tibial (Tib) nerve (40 Hz for 2 s, 0.2 ms pulse width) before and after injecting methoxamine. C, Ramp-and-hold stretch of the left triceps surae (TS) muscles (ramp: 5 mm in 0.25 s) before and after injecting methoxamine. The EMG of the soleus (Sol) muscle with stimulation of the right tibial nerve (B) and with stretch of triceps surae muscles (C) is shown below the force traces for trials before and after methoxamine injection.
Sciatic nerve transection
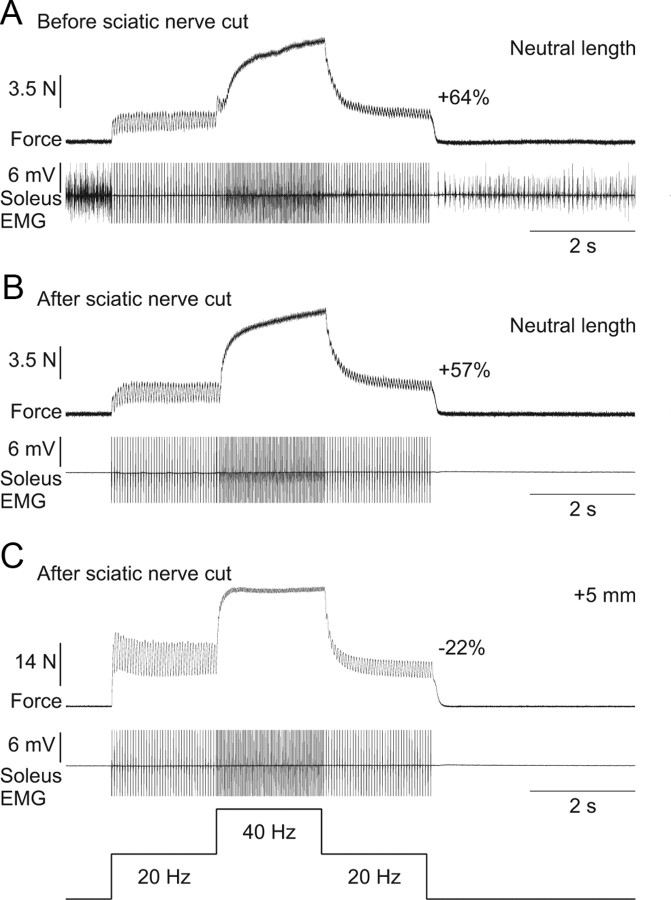
The sciatic nerve was transected approximately mid-thigh to completely abolish all central contributions to electrically evoked extra forces. Surprisingly, transecting the sciatic nerve had no effect on the extra force evoked by top hat stimulations (compare Fig. 9A with Fig. 9B) or on the length-dependent modulation of the extra forces (compare Fig. 9B with Fig. 9C).
Figure 9.
Extra forces at short muscle lengths are unchanged following transection of the sciatic nerve in an adult decerebrate cat. A, Force produced by triceps surae muscles evoked by top hat stimulation of the LGS nerve (2 ms pulse widths) before transecting the sciatic nerve with concurrent EMG of the soleus muscle at the neutral muscle length. Note that the soleus is tonically active before and after the top hat stimulation, whereas it is primarily inactive during the stimulation. B, Force produced during top hat stimulation after transecting the sciatic nerve with the same stimulation parameters as in A at the neutral muscle length. C, Force produced during top hat stimulation after transecting the sciatic nerve with the same stimulation parameters as in A at a muscle length of + 5 mm from neutral. Note that soleus EMG is absent in B and C. The extra force (i.e., the force produced during the second 20 Hz stimulation expressed as a percentage of the first 20 Hz stimulation) is shown on the right for each force trace.
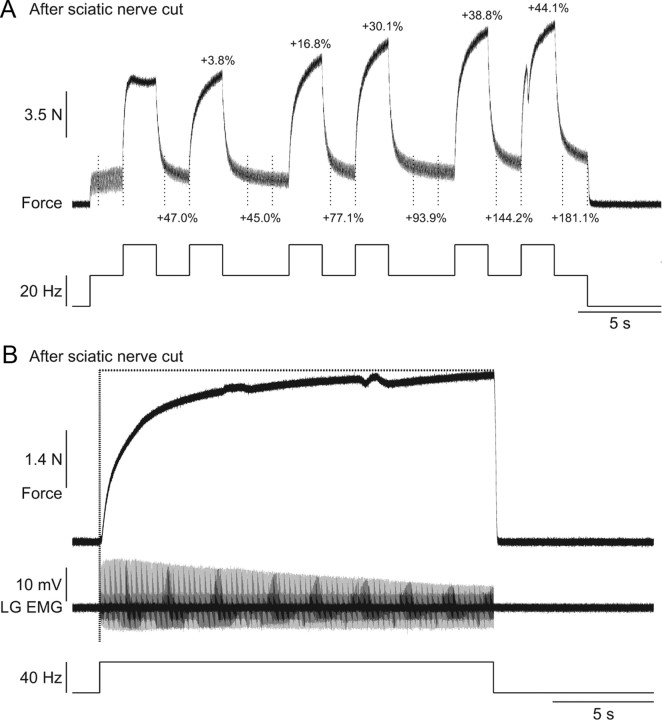
Other types of extra forces were also unaffected by sciatic nerve transection. For instance, repeated top hat stimulations produced a progressive increase in the extra force and the peak force (Fig. 10A) following sciatic nerve transection. Additionally, the staircase phenomenon, which results from prolonged stimulation, was present after sciatic nerve transection (Fig. 10B). This progressive increase in force was observed despite a progressive decrease in the LG M-wave. Therefore, these data clearly show that extra forces evoked by top hat or prolonged stimulations are generated by an intrinsic muscle property that is regulated by a peripheral mechanism related to muscle length.
Figure 10.
Progressive increase in extra and peak forces with repeated top hat stimulations and staircase phenomenon after transecting the sciatic nerve in two adult decerebrate cats. A, The LGS nerve was stimulated (2 ms pulse widths) at variable frequencies during a 30 s period after transecting the sciatic nerve. The extra forces (i.e., the forces produced during the last 1.5 s of the 20 Hz stimulations; the period is indicated by vertical dotted lines) and the peak forces produced with each 2 s 40 Hz stimulation expressed as a percentage of first 20 Hz stimulation (i.e., for extra forces) and the first 40 Hz stimulation (i.e., for peak forces) are shown above the trace. B, The LGS nerve was stimulated at 40 Hz for 20 s after transecting the nerve. The EMG of the LG muscle evoked by stimulation is shown below the force trace.
Nerve block in human subjects
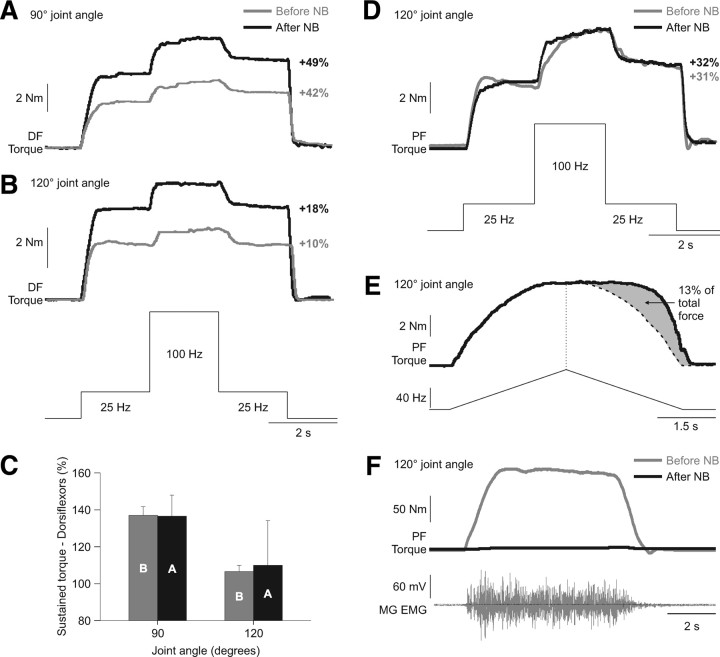
In light of the cat data that showed no effect of sciatic nerve transection on extra forces evoked by top hat stimulations, we sought to reevaluate the effect of anesthetic nerve block in human subjects. Previous studies have shown that nerve block abolishes extra forces/torques evoked by electrically stimulating the muscle (Collins et al., 2001, 2002; Blouin et al., 2009; Lagerquist et al., 2009). In subject 1, the CP nerve was blocked, and in subject 2 both the CP and tibial nerves in the popliteal fossa were blocked. Figure 11 shows some data for subjects 1 (Fig. 11A,B,C) and 2 (Fig. 11D,E,F). In subject 1, volitional dorsiflexor torque was completely abolished (data not shown). However, there was no change in the extra forces evoked by electrically stimulating the TA muscle at short muscle lengths (Fig. 11A). The reduction in extra forces at long muscle lengths was also unaffected by nerve block (Fig. 11B). Figure 11C shows an average of three trials before and after nerve block at ankle joint angles of 90° and 120° for the same subject. In subject 2, nerve block had no effect on the plantarflexor extra forces evoked by electrically stimulating the triceps surae muscles (Fig. 11D), or on the dorsiflexor extra forces evoked by electrically stimulating the TA muscle (data not shown). The torque output of the triceps surae muscles was also assessed during a triangular frequency ramp from 4 to 80 Hz and back to 4 Hz during a 6 s period at a joint angle of 120° following the nerve block (Fig. 11E). The torque generated on the descending slope of the ramp exceeded the torque at the same stimulation frequency on the ascending slope of the triangular ramp (Fig. 11E, gray area). Figure 11E shows the plantarflexor MVE and MG EMG of subject 2 before and after tibial nerve block, demonstrating that little to no activity was present following the block. Therefore, our data of nerve block in humans are consistent with the cat data of nerve transection but inconsistent with previous results in humans.
Figure 11.
Extra torques before and after nerve block in two human subjects. A, B, Torques evoked by dorsiflexor (DF) top hat stimulations (25, 100, and 25 Hz) at ankle joint angles of 90° and 120°, before and after a lidocaine nerve block (NB) of the common peroneal nerve in subject 1. C, Average ± SD of three trials before (B) and after (A) nerve block at ankle joint angles of 90° and 120° for subject 1. D, Torques evoked by plantarflexor (PF) top hat stimulations (25, 100, and 25 Hz) at an ankle joint angle of 120°, before and after a lidocaine nerve block of the tibial nerve in subject 2. E, Torque produced by stimulating the plantarflexor muscles with a triangular frequency ramp from 4 to 80 Hz and back down to 4 Hz in a 6 s period at a joint angle of 120° for subject 2 after nerve block. The dotted vertical line represent the point of stimulation at 80 Hz and the curved dotted line represents a smoothed hypothetical symmetric torque profile on the descending slope of the frequency ramp. The gray area illustrates the extra torque, which is expressed as a percentage of the total torque. F, The torque and EMG of the MG produced during a maximal voluntary effort of the plantarflexors before and after nerve block in subject 2. The percentage increase in the extra torque (i.e., the torque produced during second the 25 Hz stimulation expressed as a percentage of the first 25 Hz stimulation) is shown on the right for each joint angle in A, B, and D.
Discussion
Extra forces/torques in ankle plantarflexors or dorsiflexors evoked by electrically stimulating the muscle or its nerve were modulated by varying joint angle/muscle length in humans and decerebrate cats. Specifically, extra forces/torques were larger at short muscle lengths, which is not consistent with our stated hypothesis of larger extra forces/torques at longer muscle lengths. Extra forces/torques and their length-dependent modulation were unaffected by sciatic nerve transection or methoxamine injections in cats, or by nerve block in humans. Therefore, the electrical stimulation protocol used in the present study does not provide an accurate measure of plateau-like behavior of motoneurons in humans or decerebrate cats because it is confounded by a strong regulatory mechanism that is intrinsic to the muscle.
Technical considerations: central versus peripheral mechanisms
The primary objective of performing concurrent human and cat experiments was to assess whether the method used in humans to estimate plateau-like behavior of motoneurons is mediated by an intrinsic neuronal mechanism, as suggested (Collins et al., 2001, 2002). More stringent controls were performed in cats and data could be compared with previously obtained intracellular and extracellular recordings in decerebrate cats that investigated PICs and/or sustained EMG activity (Conway et al., 1988; Crone et al., 1988; Hounsgaard et al., 1988; Hyngstrom et al., 2007).
Intracellular recordings in adult decerebrate cats showed that PIC amplitudes in triceps surae motoneurons were larger at longer muscle lengths (Hyngstrom et al., 2007). In contrast, the present study showed that extra forces/torques evoked by electrical stimulation of the muscle or its nerve were larger at short muscle lengths in humans and cats. The simplest and most probable explanation for this discrepancy is that electrically stimulating the muscle or its nerve and recording force or torque output does not provide an estimate of PIC activation in spinal neurons. Indeed, several lines of evidence indicate that an intrinsic muscle property is strongly involved.
First and most conclusively, extra forces/torques and length-dependent modulation persisted following complete section of the sciatic nerve in decerebrate cats (Figs. 9, 10) and after anesthetic nerve block in human subjects (Fig. 11). Sectioning the sciatic nerve obviously abolishes all central and reflex contributions to muscle contractions. Second, extra forces in decerebrate cats were unaffected by intrathecal injection of methoxamine, despite clear evidence of enhanced spinal excitability (Fig. 9). Methoxamine, an alpha-1 noradrenergic agonist, potently amplifies motoneuron PICs in decerebrate cats (Lee and Heckman, 1996, 1999).
Third, prominent and reproducible TVRs could be induced by vibrating the Achilles or patellar tendon in decerebrate cats at long but not short muscle lengths (Figs. 6, 7). Synaptic inputs from Ia afferents evoked by muscle stretch or vibration activate a plateau-like behavior in the discharge rate of motoneurons in decerebrate cats (Crone et al., 1988; Hounsgaard et al., 1988; Bennett et al., 1998a,b) and of motor units in humans (Gorassini et al., 1998). Muscle stretch lowers the activation threshold of PICs (Bennett et al., 1998a,b), and facilitation of the TVR at long muscle lengths could be due to a reduction in the PIC threshold of spinal motoneurons due to tonic stretch-related feedback.
The fact that high-frequency electrical stimulation of muscle nerves can activate sustained activity or a PIC at the motoneuronal level is not disputed. Indeed, brief (100–300 ms) high-frequency (300 Hz) electrical stimulation (0.1 ms pulse width at 1.2–1.5T) of the MG or LGS nerve can evoke sustained triceps surae EMG activity in adult decerebrate cats (Crone et al., 1988) by activating an intrinsic motoneuron property (Hounsgaard et al., 1988) similar to tendon vibrations. However, the key question is whether measuring force or torque during electrically evoked contractions reflects what is occurring at the motoneuron. Collins and colleagues (2001, 2002) suggested that their electrical stimulation protocol produced a plateau-like behavior in human motoneurons via a reflex mechanism because the response was abolished following peripheral nerve block. Indeed, 100 Hz stimulation generated a build-up in force/torque, which was abolished following nerve block (Collins et al., 2001, their Fig. 1). However, this kind of build-up in force/torque is observed in isolated muscle–nerve preparations where ventral roots are sectioned from the spinal cord (Rassier and MacIntosh, 2002; Zhi et al., 2005). Additionally, we were unable to replicate their findings that nerve block abolishes extra torques (Fig. 11). The reasons for this are unclear. It could be that joint angle was not carefully controlled in previous studies, which, as shown here, can strongly influence extra forces/torques. The large extra forces/torques observed previously in human plantarflexors, which were abolished with anesthetic nerve block, could be due to an involuntary descending drive, such as a tensing-up phenomenon that results from the uncomfortable stimulation protocol. Extra forces were abolished with instructions to relax completely and not by inhibitory synaptic inputs, such as stimulation of the superficial peroneal nerve (Collins et al., 2002). In adult decerebrate cats, sustained EMG activity or PICs are easily terminated by inhibitory synaptic inputs (Crone et al., 1988; Hounsgaard et al., 1988; Hyngstrom et al., 2007).
Finally, it is possible that results obtained in cats do not translate to those obtained in humans. However, the striking similarity in the modulation of extra forces/torques by muscle length/joint angle indicates that the same phenomenon is present in humans and cats. In fact, human muscles have longer twitch contractions times than the cat (Sandercock and Heckman, 2001). As such, results in the decerebrate cat might underestimate the contribution of an intrinsic muscle property in producing extra forces/torques in humans.
Intrinsic plateau-like behaviors of skeletal muscle and length-dependent regulatory mechanisms
As stated in the Introduction, skeletal muscle displays several phenomena that closely resemble the extra forces/torques observed in the present study, namely PTP, staircase, and doublet potentiation. PTP (Roszek et al., 1994; Rassier and MacIntosh, 2002), staircase (Stephenson and Williams, 1982; ter Keurs et al., 1984; Rassier and MacIntosh, 2002), and doublet potentiation (Sandercock and Heckman, 1997; Mela et al., 2002) are all enhanced at short muscle lengths, similar to extra forces/torques evoked in the present study. It is likely that extra forces/torques evoked by top hat stimulations are mediated by similar intrinsic muscle mechanisms as PTP, staircase, and doublet potentiation.
Several muscle mechanisms could be involved in extra forces/torques. For instance, PTP is dependent on intracellular calcium levels of muscle fibers, but also on other mechanisms, such as phosphorylation of the regulatory myosin light chains and mechanical properties of the series elastic components of muscle (Binder-Macleod and Kesar, 2005; Zhi et al., 2005). Ca2+ release from the sarcoplasmic reticulum is enhanced with increasing stimulation frequency and is reduced at longer muscle lengths in frog skeletal muscle fibers (Blinks et al., 1978) but not in mouse skeletal muscle fibers (Balnave and Allen, 1996). There could be an interspecies difference in length-dependent Ca2+ release, but a reduction at longer muscle lengths would tend to generate less extra force/torque, consistent with results of the present study. Moreover, Ca2+ sensitivity was highest at short muscle lengths and around the optimal force-generating muscle length, but decreased at longer muscle lengths in mouse skeletal fibers (Roszek et al., 1994; Balnave and Allen, 1996). Phosphorylation of the regulatory myosin light chains does not appear to be length-dependent (Rassier and MacIntosh, 2002), but because it is dependent on Ca2+ sensitivity (Zhi et al., 2005), which changes with length, it cannot be excluded as a potential mechanism. Thus, length-dependent changes in Ca2+ release, sensitivity, and phosphorylation of the myosin light chain could explain the decrease in extra forces/torques at longer muscle lengths.
Functional considerations and concluding remarks
The neuromuscular system's goal during movement or posture is to produce appropriate forces/torques at multiple joints. The CNS can accomplish this goal by recruiting or derecruiting motor units or by changing the discharge rate of active units. However, the CNS must account for biomechanical factors and intrinsic muscle properties that influence force/torque generation when modulating discharge rate and/or recruitment of motor units. It appears that force/torque is facilitated by intrinsic neuronal properties that are enhanced at long muscle lengths and by intrinsic muscle properties that are enhanced at short muscle lengths.
Footnotes
This work was supported by a postdoctoral fellowship from the Canadian Institutes of Health Research (to A.F.), a doctoral scholarship from the American Physical Therapy Association (to C.K.T.), the Craig H. Neilsen Foundation (to T.G.H.), and National Institutes of Health/National Institute of Neurological Disorders and Stroke Grant NS034382 (to C.J.H).
References
- Balnave CD, Allen DG. The effect of muscle length on intracellular calcium and force in single fibres from mouse skeletal muscle. J Physiol. 1996;492:705–713. doi: 10.1113/jphysiol.1996.sp021339. [DOI] [PMC free article] [PubMed] [Google Scholar]
- Banks RW, Barker D, Stacey MJ. Form and distribution of sensory terminals in cat hindlimb muscle spindles. Philos Trans R Soc Lond B Biol Sci. 1982;299:329–364. doi: 10.1098/rstb.1982.0136. [DOI] [PubMed] [Google Scholar]
- Bennett DJ, Hultborn H, Fedirchuk B, Gorassini M. Synaptic activation of plateaus in hindlimb motoneurons of decerebrate cats. J Neurophysiol. 1998a;80:2023–2037. doi: 10.1152/jn.1998.80.4.2023. [DOI] [PubMed] [Google Scholar]
- Bennett DJ, Hultborn H, Fedirchuk B, Gorassini M. Short-term plasticity in hindlimb motoneurons of decerebrate cats. J Neurophysiol. 1998b;80:2038–2045. doi: 10.1152/jn.1998.80.4.2038. [DOI] [PubMed] [Google Scholar]
- Binder-Macleod SA, Barrish WJ. Force response of rat soleus muscle to variable-frequency train stimulation. J Neurophysiol. 1992;68:1068–1078. doi: 10.1152/jn.1992.68.4.1068. [DOI] [PubMed] [Google Scholar]
- Binder-Macleod SA, Clamann HP. Force output of cat motor units stimulated with trains of linearly varying frequency. J Neurophysiol. 1989;61:208–217. doi: 10.1152/jn.1989.61.1.208. [DOI] [PubMed] [Google Scholar]
- Binder-Macleod S, Kesar T. Catchlike property of skeletal muscle: recent findings and clinical implications. Muscle Nerve. 2005;31:681–693. doi: 10.1002/mus.20290. [DOI] [PubMed] [Google Scholar]
- Blinks JR, Rüdel R, Taylor SR. Calcium transients in isolated amphibian skeletal muscle fibres: detection with aequorin. J Physiol. 1978;277:291–323. doi: 10.1113/jphysiol.1978.sp012273. [DOI] [PMC free article] [PubMed] [Google Scholar]
- Blouin JS, Walsh LD, Nickolls P, Gandevia SC. High-frequency submaximal stimulation over muscle evokes centrally generated forces in human upper limb skeletal muscles. J Appl Physiol. 2009;106:370–377. doi: 10.1152/japplphysiol.90939.2008. [DOI] [PubMed] [Google Scholar]
- Brownstone RM. Beginning at the end: repetitive firing properties in the final common pathway. Prog Neurobiol. 2006;78:156–172. doi: 10.1016/j.pneurobio.2006.04.002. [DOI] [PMC free article] [PubMed] [Google Scholar]
- Burke RE, Rudomin P, Zajac FE., 3rd Catch property in single mammalian motor units. Science. 1970;168:122–124. doi: 10.1126/science.168.3927.122. [DOI] [PubMed] [Google Scholar]
- Close R, Hoh JF. The after-effects of repetitive stimulation on the isometric twitch contraction of rat fast skeletal muscle. J Physiol. 1968;197:461–477. doi: 10.1113/jphysiol.1968.sp008570. [DOI] [PMC free article] [PubMed] [Google Scholar]
- Collins DF. Central contributions to contractions evoked by tetanic neuromuscular electrical stimulation. Exerc Sport Sci Rev. 2007;35:102–109. doi: 10.1097/jes.0b013e3180a0321b. [DOI] [PubMed] [Google Scholar]
- Collins DF, Burke D, Gandevia SC. Large involuntary forces consistent with plateau-like behavior of human motoneurons. J Neurosci. 2001;21:4059–4065. doi: 10.1523/JNEUROSCI.21-11-04059.2001. [DOI] [PMC free article] [PubMed] [Google Scholar]
- Collins DF, Burke D, Gandevia SC. Sustained contractions produced by plateau-like behaviour in human motoneurones. J Physiol. 2002;538:289–301. doi: 10.1113/jphysiol.2001.012825. [DOI] [PMC free article] [PubMed] [Google Scholar]
- Conway BA, Hultborn H, Kiehn O, Mintz I. Plateau potentials in alpha-motoneurones induced by intravenous injection of l-Dopa and clonidine in the spinal cat. J Physiol. 1988;405:369–384. doi: 10.1113/jphysiol.1988.sp017337. [DOI] [PMC free article] [PubMed] [Google Scholar]
- Cresswell AG, Löscher WN, Thorstensson A. Influence of gastrocnemius muscle length on triceps surae torque development and electromyographic activity in man. Exp Brain Res. 1995;105:283–290. doi: 10.1007/BF00240964. [DOI] [PubMed] [Google Scholar]
- Crone C, Hultborn H, Kiehn O, Mazieres L, Wigström H. Maintained changes in motoneuronal excitability by short-lasting synaptic inputs in the decerebrate cat. J Physiol. 1988;405:321–343. doi: 10.1113/jphysiol.1988.sp017335. [DOI] [PMC free article] [PubMed] [Google Scholar]
- Cullheim S, Kellerth JO. A morphological study of the axons and recurrent axon collaterals of cat alpha-motoneurones supplying different hind-limb muscles. J Physiol. 1978;281:285–299. doi: 10.1113/jphysiol.1978.sp012422. [DOI] [PMC free article] [PubMed] [Google Scholar]
- Gorassini MA, Bennett DJ, Yang JF. Self-sustained firing of human motor units. Neurosci Lett. 1998;247:13–16. doi: 10.1016/s0304-3940(98)00277-8. [DOI] [PubMed] [Google Scholar]
- Gorassini M, Yang JF, Siu M, Bennett DJ. Intrinsic activation of human motoneurons: possible contribution to motor unit excitation. J Neurophysiol. 2002a;87:1850–1858. doi: 10.1152/jn.00024.2001. [DOI] [PubMed] [Google Scholar]
- Gorassini M, Yang JF, Siu M, Bennett DJ. Intrinsic activation of human motoneurons: reduction of motor unit recruitment thresholds by repeated contractions. J Neurophysiol. 2002b;87:1859–1866. doi: 10.1152/jn.00025.2001. [DOI] [PubMed] [Google Scholar]
- Heckman CJ, Lee RH, Brownstone RM. Hyperexcitable dendrites in motoneurons and their neuromodulatory control during motor behavior. Trends Neurosci. 2003;26:688–695. doi: 10.1016/j.tins.2003.10.002. [DOI] [PubMed] [Google Scholar]
- Heckmann CJ, Gorassini MA, Bennett DJ. Persistent inward currents in motoneuron dendrites: implications for motor output. Muscle Nerve. 2005;31:135–156. doi: 10.1002/mus.20261. [DOI] [PubMed] [Google Scholar]
- Hounsgaard J, Hultborn H, Jespersen B, Kiehn O. Bistability of alpha-motoneurones in the decerebrate cat and in the acute spinal cat after intravenous 5-hydroxytryptophan. J Physiol. 1988;405:345–367. doi: 10.1113/jphysiol.1988.sp017336. [DOI] [PMC free article] [PubMed] [Google Scholar]
- Hultborn H, Brownstone RB, Toth TI, Gossard JP. Key mechanisms for setting the input-output gain across the motoneuron pool. Prog Brain Res. 2004;143:77–95. doi: 10.1016/s0079-6123(03)43008-2. [DOI] [PubMed] [Google Scholar]
- Hyngstrom AS, Johnson MD, Miller JF, Heckman CJ. Intrinsic electrical properties of spinal motoneurons vary with joint angle. Nat Neurosci. 2007;10:363–369. doi: 10.1038/nn1852. [DOI] [PubMed] [Google Scholar]
- Kiehn O. Plateau potentials and active integration in the ‘final common pathway’ for motor behaviour. Trends Neurosci. 1991;14:68–73. doi: 10.1016/0166-2236(91)90023-n. [DOI] [PubMed] [Google Scholar]
- Lagerquist O, Walsh LD, Blouin JS, Collins DF, Gandevia SC. Effect of a peripheral nerve block on torque produced by repetitive electrical stimulation. J Appl Physiol. 2009;107:161–167. doi: 10.1152/japplphysiol.91635.2008. [DOI] [PubMed] [Google Scholar]
- Lee RH, Heckman CJ. Influence of voltage-sensitive dendritic conductances on bistable firing and effective synaptic current in cat spinal motoneurons in vivo. J Neurophysiol. 1996;76:2107–2110. doi: 10.1152/jn.1996.76.3.2107. [DOI] [PubMed] [Google Scholar]
- Lee RH, Heckman CJ. Enhancement of bistability in spinal motoneurons in vivo by the noradrenergic alpha1 agonist methoxamine. J Neurophysiol. 1999;81:2164–2174. doi: 10.1152/jn.1999.81.5.2164. [DOI] [PubMed] [Google Scholar]
- Matthews PB. Reflex activation of the soleus muscle of the decerebrate cat by vibration. Nature. 1966a;209:204–205. doi: 10.1038/209204b0. [DOI] [PubMed] [Google Scholar]
- Matthews PB. The reflex excitation of the soleus muscle of the decerebrate cat caused by vibration applied to its tendon. J Physiol. 1966b;184:450–472. doi: 10.1113/jphysiol.1966.sp007926. [DOI] [PMC free article] [PubMed] [Google Scholar]
- Mela P, Veltink PH, Huijing PA, Salmons S, Jarvis JC. The optimal stimulation pattern for skeletal muscle is dependent on muscle length. IEEE Trans Neural Syst Rehabil Eng. 2002;10:85–93. doi: 10.1109/TNSRE.2002.1031976. [DOI] [PubMed] [Google Scholar]
- Nickolls P, Collins DF, Gorman RB, Burke D, Gandevia SC. Forces consistent with plateau-like behaviour of spinal neurons evoked in patients with spinal cord injuries. Brain. 2004;127:660–670. doi: 10.1093/brain/awh073. [DOI] [PubMed] [Google Scholar]
- Rack PM, Westbury DR. The effects of length and stimulus rate on tension in the isometric cat soleus muscle. J Physiol. 1969;204:443–460. doi: 10.1113/jphysiol.1969.sp008923. [DOI] [PMC free article] [PubMed] [Google Scholar]
- Rassier DE, MacIntosh BR. Sarcomere length-dependence of activity-dependent twitch potentiation in mouse skeletal muscle. BMC Physiol. 2002;2:19. doi: 10.1186/1472-6793-2-19. [DOI] [PMC free article] [PubMed] [Google Scholar]
- Rassier DE, MacIntosh BR, Herzog W. Length dependence of active force production in skeletal muscle. J Appl Physiol. 1999;86:1445–1457. doi: 10.1152/jappl.1999.86.5.1445. [DOI] [PubMed] [Google Scholar]
- Roszek B, Baan GC, Huijing PA. Decreasing stimulation frequency-dependent length-force characteristics of rat muscle. J Appl Physiol. 1994;77:2115–2124. doi: 10.1152/jappl.1994.77.5.2115. [DOI] [PubMed] [Google Scholar]
- Sandercock TG, Heckman CJ. Doublet potentiation during eccentric and concentric contractions of cat soleus muscle. J Appl Physiol. 1997;82:1219–1228. doi: 10.1152/jappl.1997.82.4.1219. [DOI] [PubMed] [Google Scholar]
- Sandercock TG, Heckman CJ. Whole muscle length-tension properties vary with recruitment and rate modulation in areflexive cat soleus. J Neurophysiol. 2001;85:1033–1038. doi: 10.1152/jn.2001.85.3.1033. [DOI] [PubMed] [Google Scholar]
- Stephenson DG, Williams DA. Effects of sarcomere length on the force-pCa relation in fast- and slow-twitch skinned muscle fibres from the rat. J Physiol. 1982;333:637–653. doi: 10.1113/jphysiol.1982.sp014473. [DOI] [PMC free article] [PubMed] [Google Scholar]
- Stuart GJ, Rymer WZ, Schotland JL. Characteristics of reflex excitation in close synergist muscles evoked by muscle vibration. Exp Brain Res. 1986;65:127–134. doi: 10.1007/BF00243835. [DOI] [PubMed] [Google Scholar]
- ter Keurs HE, Luff AR, Luff SE. Force: sarcomere-length relation and filament length in rat extensor digitorum muscle. Adv Exp Med Biol. 1984;170:511–525. doi: 10.1007/978-1-4684-4703-3_44. [DOI] [PubMed] [Google Scholar]
- Vanderhorst VG, Holstege G. Organization of lumbosacral motoneuronal cell groups innervating hindlimb, pelvic floor, and axial muscles in the cat. J Comp Neurol. 1997;382:46–76. [PubMed] [Google Scholar]
- Zhi G, Ryder JW, Huang J, Ding P, Chen Y, Zhao Y, Kamm KE, Stull JT. Myosin light chain kinase and myosin phosphorylation effect frequency-dependent potentiation of skeletal muscle contraction. Proc Natl Acad Sci U S A. 2005;102:17519–17524. doi: 10.1073/pnas.0506846102. [DOI] [PMC free article] [PubMed] [Google Scholar]


