

Abstract
Previously, we reported hyperpolarized 129Xe chemical exchange saturation transfer (Hyper-CEST) NMR techniques for the ultrasensitive (i.e., 1 picomolar) detection of xenon host molecules known as cryptophane. Here, we demonstrate a more general role for Hyper-CEST NMR as a spectroscopic method for probing nanoporous structures, without the requirement for cryptophane or engineered xenon-binding sites. Hyper-CEST 129Xe NMR spectroscopy was employed to detect Bacillus anthracis and Bacillus subtilis spores in solution, and interrogate the layers that comprise their structures. 129Xe-spore samples were selectively irradiated with radiofrequency pulses; the depolarized 129Xe returned to aqueous solution and depleted the 129Xe-water signal, providing measurable contrast. Removal of the outermost spore layers in B. anthracis and B. subtilis (the exosporium and coat, respectively) enhanced 129Xe exchange with the spore interior. Notably, the spores were invisible to hyperpolarized 129Xe NMR direct detection methods, highlighting the lack of high-affinity xenon-binding sites, and the potential for extending Hyper-CEST NMR structural analysis to other biological and synthetic nanoporous structures.
Introduction
Here, we demonstrate a 129Xe nuclear magnetic resonance (NMR) spectroscopic method that allows both sensitive analysis and detection of intact bacterial spores in aqueous solution, without further sample preparation. NMR spectroscopy has been used previously to analyze spore contents1–3 but typically offers limited detection sensitivity, due to small polarization of the nuclear spin reservoir, where the difference in spin populations aligned parallel or anti-parallel to an external magnetic field at thermal equilibrium is typically just ~10 in a million nuclei. Thus, significantly enhanced NMR signals can be obtained with hyperpolarized (HP) samples. Our laboratory4–8 and others9–18 have explored biosensing and bioimaging applications with the noble gas nucleus 129Xe, which has one-half nuclear spin number (I = ½), and can be hyperpolarized to near unity by spin-exchange optical pumping.19 To make the technique more sensitive for demanding applications, chemical exchange provides another source of NMR signal amplification.
When exchanging magnetic species are present, chemical exchange saturation transfer (CEST) can achieve signal amplification based on cumulative magnetization transfer through selective saturation.20 This gives the possibility of designing extremely sensitive contrast agents that respond to various exchange events, for example, with techniques known as PARACEST21 and LIPOCEST.22 For exchange experiments involving HP 129Xe, it was originally demonstrated that the strong gas-phase HP 129Xe signal can serve to amplify the weaker dissolved-phase signal, with xenon polarization transfer contrast (XTC) providing useful information on lung-tissue density.23 More recently, the analogous technique, Hyper-CEST, involving HP 129Xe host-guest chemistry in solution was developed.9 This technique has been applied to 129Xe exchange between bulk aqueous solution and high-Xe-affinity, water-soluble organic host molecules (i.e., cryptophanes9, 24–26), organic solvents,27 and gas-filled protein structures known as gas vesicles.28 Here, we further generalize this approach, by performing Hyper-CEST NMR analysis of spore samples in the absence of cryptophane or other high-affinity xenon-binding sites.
A subset of bacteria produce a highly resistant, dormant cell type, called the spore, which is produced in response to specific stresses, most notably starvation.29 Although essentially metabolically dormant30 the spore can break dormancy (a process called germination) very soon after the spore detects signals that indicate conditions for resuming growth are present. A small fraction of spore-forming species are pathogenic, including Clostridium difficile, one of the most important healthcare-associated infectious agents31 as well as Bacillus anthracis, a major biothreat agent.32 The threat posed by these and other pathogenic species has intensified efforts to better understand the roles of spore structures in resistance, as well as to improve methods of spore detection. The spore’s unusual—and incompletely understood—structural integrity in the face of extreme temperatures, mechanical stress, chemical denaturation and other stresses is essential to maintaining viability as well as resisting host defense and decontamination.33 A molecular understanding of the protective structures encasing the spore has been a goal of basic research for many decades.34
Spores have a distinctive architecture, composed of a series of concentric layers, each of which contributes to resistance and other spore properties (Figures 1a, 1b).33, 34 In some species, including B. anthracis, the outermost spore layer is the exosporium, a pleomorphic shell composed of proteins and glycoproteins (Figure 1a). The exosporium is present in pathogenic and nonpathogenic species (for example, see Traag et al.35). Beneath the exosporium, and separated by a gap, is the coat, which is present in all bacterial spores (Figure 1b).34 Although these two layers play key roles in spore resistance, their chemical properties and molecular organization remain incompletely understood. This lack of information hinders efforts to improve anti-spore therapeutics, decontamination and spore detection. In particular, sensitive methods for spore detection that do not require major sample preparation and discriminate between pathogenic and nonpathogenic spore-forming species are needed. No existing method achieves all these goals, and distinguishing among even highly divergent species without DNA sequencing has been especially challenging. For example, fluorescence-based assays have been developed that readily detect bacterial spores,36–40 but cannot discriminate between species, because the target analyte, dipicolinic acid (DPA), is present in bacterial spores of all species. Raman spectroscopy similarly identifies spores from dominant calcium DPA signals.41 Methods that identify subcellular structures in spores that vary among species (and, in particular, between certain pathogenic and non-pathogenic species) could be very helpful for improving pathogen detection.
Figure 1.

129Xe Hyper-CEST experiment with spores. (A) B. anthracis strains: A, Sterne 34F2 (wild type), B, Sterne-JAB-13 (bclA), C, RG56 (cotE). (B) B. subtilis strains: D, PY79 (wild type), E, AD28 (cotE), F, AD142 (cotE gerE). While some coat likely remains in AD142 spores,43 we have not indicated this in the figure, for simplicity. (C) Scheme showing Hyper-CEST NMR experiment with spores.
Recently, Liu et al. showed the ability to monitor the germination and proliferation of bacteria using 1H-CEST MRI, where labile protons inside the cytoplasm or on the cell surface served as endogenous contrast agent; however, bacterial spores were invisible by this technique, due to limited water accessibility within spores.42
Here, we present Hyper-CEST 129Xe NMR analysis of wild-type and mutant B. anthracis and B. subtilis spores, where detection limits of 105–109 spores per milliliter were achieved in aqueous solution. 129Xe gas irradiated by radiofrequency pulses in the spore interior efficiently transfers loss of magnetization to the bulk solution, which provides contrast between different spore structural components. We analyzed strains of B. anthracis that vary in exosporium, or exosporium and coat structure and strains of B. subtilis that vary in coat structure. These strains show readily distinguishable Hyper-CEST behaviors, in a manner consistent with the hypothesis that spore layers cause variations in the rate of xenon diffusion between aqueous solution and the spore interior. By determining the Xe accessibility of the spore interior to the outer environment, Hyper-CEST NMR provides a rapid, nondestructive measure of molecular porosity. Importantly, this methodology distinguishes between spores with and without exosporia. As a result, in combination with other technologies, it provides a novel method for distinguishing between different bacterial spores, and assigning structural-functional significance to different spore components.
Experimental section
Bacterial strains
All strains are in either the attenuated Sterne strain 34F2 (for B. anthracis) or PY7944 (for B. subtilis) backgrounds. The B. anthracis strain RG56 lacks the exosporium and has a minor defect in the coat (due to a mutation in cotE) and strain Sterne-JAB-13 possesses the innermost layer of the exosporium (the basal layer) but lacks the hair-like projections (or nap) that project from the basal layer-outer surface.45, 46 The B. subtilis strains AD28 and AD142 lack the outer layers of the coat, or almost the entire coat, due to mutations in cotE, or cotE and gerE, respectively.47, 48 We note that while the genes named cotE in B. anthracis and B. subtilis are indeed orthologous, their mutant phenotypes have important differences between these two species, as described.
Hyper-CEST experiment with spores
Before starting the Hyper-CEST experiment, fresh HP 129Xe was delivered via bubbling through a 3-mL liquid sample contained in a 10-mm diameter NMR tube. Immediately before the pulse sequence (Figure S1) started, HP Xe bubbling was stopped by solenoid valves to stabilize the liquid sample for NMR acquisition. The NMR tube was airtight during the Hyper-CEST experiment, which was achieved with a homebuilt continuous-flow HP Xe delivery setup.8
Figure 1c illustrates the Hyper-CEST experiment involving spores. As a starting point for all sets of Hyper-CEST experiments, a consistent amount of fresh HP Xe resided in the sample suspension. As the first step of the Hyper-CEST pulse sequence, DSnob-shaped 180-degree selective pulses were looped numerous times continuously, at frequencies of interest. Pulse power was calibrated to give maximum saturation performance. Xenon resonances within the RF pulse’s selected frequency range (corresponding to the Xe-spore interaction) were depolarized. The ensuing chemical exchange accelerated depolarization of xenon in the whole sample, as measured by loss of Xe(aq) signal. After the overall polarization was reduced by saturation pulses and chemical exchange, the sample was irradiated with a 90-degree hard pulse to observe the final magnetization state of 129Xe in solution.
Results and Discussion
Hyper-CEST profile for spores
Multiple (100–600) selective 180-degree radio-frequency (RF) pulses were delivered to spore samples at the various resonance frequencies, of duration between 1.0 s and 9.5 s. By scanning the saturation frequencies, different Xe(aq) signal intensities were acquired and plotted as the exchange profile. At frequencies of observable Xe depolarization, HP Xe and depolarized Xe were dynamically exchanging among distinguishable chemical environments related to spores.
Figure 2 shows the profile of wild-type B. anthracis at 1.2×10⁹ cfu/mL, in the 188–203 ppm frequency range and at 0.5 ppm resolution. A Xe(spore) signal was observed to be actively exchanging with the Xe(aq) signal. After the profile was fit by Voigt line shape, two signals were identified (Figure 2a). The secondary peak at 196.3 ppm (7.6 ppm wide) was assigned to Xe(spore); while the main peak at 193.4 ppm (4.5 ppm wide) was assigned to Xe(aq). Similar profiles were also observed for all spore samples listed above (Figures S2–S6), at much lower spore density of 1.2×10⁷ cfu/mL. The linewidth of the Xe(spore) peak appeared quite broad for all strains. We hypothesize that due to lack of high-affinity binding sites, the exchange rates between xenon and multiple exchange sites that reside at or near the dehydrated spore interior are fairly rapid, leading to the merged broad peak. The Xe(spore) peak chemical shifts are summarized in Table 1, which identify a similar Xe-spore interaction (196–199 ppm) across the different spore samples.
Figure 2.

Hyper-CEST NMR profile and depolarization curve of wild-type B. anthracis spores at 1.2 × 10⁹ cfu/mL. (A) NMR profile acquired at 0.5 ppm resolution, at 278 K, with 600 pulse cycles for saturation exchange (11.6 s saturation time). Two peaks (196.2 ppm and 193.4 ppm) are shown for the spores and water, respectively. (B) Saturation frequencies for depolarization curve were 197.5 = (193.2 + 4.5) ppm and 188.9 = (193.2 - 4.5) ppm, for ‘on’ and ‘off’ resonance, respectively.
Table 1.
Saturation transfer (ST) efficiency and exchange signal NMR chemical shift for six spore strains.
| Spore | Strain | ST Efficiency | 129Xe(spore) NMR chemical shift (ppm) |
|---|---|---|---|
| B. anthracis | Sterne 34F2 | 0.01 ± 0.01 | 196 ± 8 |
| Sterne JAB-13 | 0.12 ± 0.01 | 199 ± 2 | |
| RG56 | 0.14 ± 0.01 | 198 ± 1 | |
| B. subtilis | PY79 | 0.11 ± 0.01 | 198 ± 1 |
| AD28 | 0.21 ± 0.03 | 199 ± 2 | |
| AD142 | 0.42 ± 0.06 | 197 ± 1 |
Depolarization rate measurement for spores
To compare the Hyper-CEST performances across spore strains, and to make the CEST effect more observable, the HP Xe depolarization background needed to be removed. Two frequencies, 197.5 ppm and 188.9 ppm, were selected for Hyper-CEST ‘on’ and ‘off’ resonance, and kept the same in the two series of data points. The number of saturation pulses in the sequence was increased from 0 to 2000 in steps of 200 (Figure 2b), corresponding to saturation times between 0 s and 38 s. Meanwhile, the Xe(aq) signal decreased exponentially as more pulse power was applied to the sample. The exponential decay time (T1) of HP Xe, for the two selected frequencies, was extracted by fitting the decay curves. In Figure 2b, the decay time constants (T1) were fitted to be 16.5 s (on) and 29.6 s (off). The existence of chemical exchange with the ‘on resonance’ group greatly accelerated the decay rate.
Saturation transfer efficiency (Hyper-CEST contrast)
We quantified the contrast generated by the Hyper-CEST experiment by computing the saturation transfer efficiency (ST), which is directly proportional to the MR image contrast:
| (1) |
In equation 1, I represents the integral of Xe(aq) signal acquired in a Hyper-CEST experiment with set saturation frequency, duration, and power. L represents the duration of Hyper-CEST pulse sequences, which is the sum of time spent in shaped saturation pulses and delays. The summing index k indicates the experiment number in Figure 2b, and k′ is the total number of experiments. Thus, ST is normalized to give values less than 1, and to give greater weight to the signals (indicating loss of polarization) obtained in the later experiments. This weighted sum, corresponding to ST, provides the proportion of saturation-transferred magnetization, over the initial value. Therefore, ST quantifies the efficiency of the Hyper-CEST experiment for each sample.
Enhanced Hyper-CEST due to altered exosporium
We analyzed one B. anthracis strain (RG56) lacking the exosporium due to inactivation of cotE and one missing the major exosporium protein BclA (Sterne-JAB-13). B. subtilis spores lack an exosporium. In Table 1, ST is listed for all strains at 1.2×10⁷ cfu/mL. Both B. anthracis spore variants gave dramatically enhanced Hyper-CEST contrast compared to wild-type 34F2. Strain Sterne-JAB-13 had strongly increased sensitivity to Hyper-CEST, with complete removal of the exosporium (in RG56) showing only a small additional enhancement. This is consistent with the interpretation that the hair-like projections on the exosporium surface create a significant barrier to xenon exchange. Significantly, wild-type B. anthracis (Sterne 34F2) was almost undetectable by Hyper-CEST at concentration of 107 cfu/mL (Figure S7), which gave rise to a ST value of nearly zero. In fact, 100-fold higher concentration (109 cfu/mL) was required for this strain to be readily detected (Figure 2).
Enhanced Hyper-CEST from B. subtilis spores with coat defects
To determine whether Hyper-CEST can be used also to monitor the molecular features of the spore coat, we analyzedwild-type B. subtilis, and strains lacking the outer layers or almost the entire coat (strains PY79, AD28, and AD142, respectively). We found that in the absence of the outer layers of the coat, the Hyper-CEST contrast was enhanced by more than 2-fold (comparing PY79 and AD28, Figure 3). Strain AD142 (lacking almost the entire coat) gave an additional 2-fold increase in Hyper-CEST contrast. We conclude that spores lacking coat layers are more sensitively detected by Hyper-CEST. We infer that this increase is due to the spore interior being more accessible to xenon in solution. To measure the limit of detection of the most Xe-accessible strain, we performed Hyper-CEST on strain AD142 at concentrations from 104 to 106 cfu/mL. Clear Hyper-CEST contrast was observable at 105 cfu/mL (Figure S8).
Figure 3.
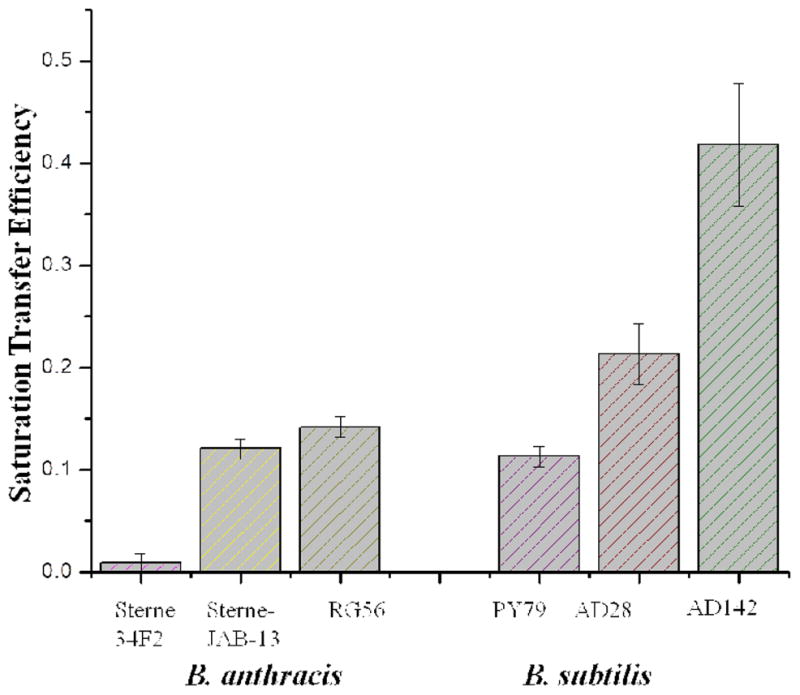
Comparison of saturation transfer (ST) efficiencies across six spore strains measured at 1.2×10⁷ cfu/mL.
Possible origin of xenon exchange in spores
With a ~4.3-angstrom diameter, and very polarizable electron cloud, Xe is known to exhibit affinity for sub-nanometer-sized void spaces in materials, proteins, and organic cages.49–51 Xe is also very sensitive to its environment, as reflected by the ~4 ppm chemical shift difference between the Xe(aq) and Xe(spore) NMR peaks. Our data are consistent with xenon occupying hydrophobic sites in the largely dehydrated spore interior,3 where the chemical shift will differ from xenon in bulk water and result in a reservoir for exchange behavior. As highlighted above, spores with fewer outer layers presented stronger Hyper-CEST contrast. The best contrast was observed with strain AD142, which largely lacks the coat.43 This argues that the cortex, inner membrane and core are sites of Xe exchange.
New approach for xenon biosensing
Besides finding naturally existing xenon binding sites (i.e, hemoglobin52), many efforts in xenon biosensing have focused on developing small molecules18 or proteins53–55 with singular high-affinity xenon binding sites, but this remains a formidable challenge. Noteworthy are water-soluble cryptophanes, which bind a single xenon atom with modest affinity (KD = 25–200 μM at rt); however, challenges in cryptophane synthesis and functionalization limit broad use for HP 129Xe NMR. The spore experiments suggest an alternate approach, to exploit xenon interactions with nanoporous structures in solution. As demonstrated here, Hyper-CEST NMR can reveal xenon interactions that are otherwise invisible using direct detection HP 129Xe NMR methods. No “bound” 129Xe NMR signal was directly observed for any of the spore samples at concentrations of 1.2×10⁷ cfu/mL, which is consistent with the lack of high-affinity xenon-binding sites in the spore samples. By producing a Xe-bound resonance frequency that is detectable by Hyper-CEST NMR (via accumulated cycles of magnetization transfer in solution), the spores most likely possess a significant number of low-affinity Xe binding sites, with KA ≈ 10–100 M-1; single Xe binding sites have been seen for many proteins.56, 57 Additionally, the exchange rates must be fast compared to the timescale of the HP 129Xe longitudinal relaxation time (T1 ≈ 75 s) in order to produce the observed enhancement in sensitivity relative to direct detection schemes. Many biological and synthetic structures should have the necessary size and porosity to achieve useful chemical exchange.
Importantly, the variation in ST efficiency observed for the three B. anthracis strains and the three B. subtilis strains cannot easily be attributed to differences in gross morphology. None of the mutant strains differs sufficiently from wild type in their dimensions to account for the effects we detect.43, 46 Hyper-CEST NMR provides a noninvasive method for probing interior spore structures that are otherwise difficult to assess at the molecular level. The current findings argue that the bacterial spore interior is accessible to small hydrophobic molecules of the size of Xe. Small molecules, such as methane, which differ somewhat from Xe in size, hydrophobicity, and diffusion rate, may also be able to penetrate through the spore protection layers, giving further opportunity to analyze the spore structure.
Conclusion
We have successfully analyzed various bacterial spores using a sensitive Hyper-CEST NMR technique. The ability of Xe to diffuse readily within the spore layers and interact with the interior to give rise to Hyper-CEST signal–without cryptophane or other engineered binding sites–suggests many new applications for Hyper-CEST NMR in studying nanoporous structures commonly found in biological systems and materials science. In this example, the most Xe-accessible spore sample (strain AD142) was detected at a concentration of just 105 cfu/mL, which is ~7 orders of magnitude more sensitive than previous efforts at spore detection using NMR spectroscopy.1, 2 Moreover, this result did not require specialized sample preparation and was achieved without spore destruction, thereby allowing downstream analysis of the sample.
The finding that Hyper-CEST contrast increased in spores where outer structures were absent strongly suggests that Xe in aqueous solution gains ready access to the spore interior, where the rate of the exchange process depends on the thickness and/or composition of the outer layers present. The finding that the exosporium effectively limits Xe entry into the spore is notable and is consistent with the view that the exosporium acts as a molecular sieve. Specifically, the hairy nap on the exosporium outer surface provided a remarkably effective barrier to xenon entry. Taken as a whole, our results show that Hyper-CEST NMR provides a novel method for noninvasive spore detection and a powerful tool for probing the physical and chemical properties of the spore interior. Hyper-CEST is an especially powerful method to distinguish between spores that are morphologically similar but differ in characteristics that mediate Xe exchange. We conclude that, in combination with genetic manipulation of spore ultrastructure, Hyper-CEST NMR can generate new insights into spore composition and function that have previously been difficult or impossible to analyze.
Methods
NMR sample preparation
Spores were prepared as previously described.46 Spore number was measured by counting colony-forming units. Before each NMR experiment, the spores were suspended in MilliQ water to desired number densities (1.2×10⁹ cfu/mL for strain 34F2, 1.2×10⁷ cfu/mL for all samples, and 1.2×10⁴–1.2×10⁷ cfu/mL for strain AD142). To prevent germination, all spores were stored at 278 K prior to experiments, and kept at 278 K during experiments.
Hyperpolarized 129Xe NMR setup
All NMR spectra were acquired with a Bruker BioDRX 500 MHz NMR spectrometer. RF pulse frequency for 129Xe was 138.12 MHz. Spore suspension samples were observed using a 10-mm PABBO NMR probe. HP 129Xe was generated using a home-built 129Xe hyperpolarizer, based on the commercial model IGI.Xe.2000 by GE. A gas mixture of 10% nitrogen, 89% helium, and 1% natural abundance xenon (Linde Group, NJ) was used as the hyperpolarizer input. 129Xe was hyperpolarized to 10–15% after optical pumping of Rb vapor with 795 nm circularly polarized laser.
Sample temperature was controlled by VT unit on the NMR spectrometer to 278 ± 1 K, to ensure spore stability. All acquired NMR spectra using the Hyper-CEST pulse sequence were processed with 10 Hz Lorentz line broadening. Xe(aq) signal intensities under different saturation frequencies and/or times were integrated and relative values were used for further derivations.
Supplementary Material
Acknowledgments
The authors thank George Furst and Jun Gu for helping with NMR instrument setup, Joel Bozue for the kind gift of strain Sterne-JAB-13, and Daniel Coerper for expert technical assistance. This work was supported by NIH R01 GM097478 to IJD.
Footnotes
Electronic Supplementary Information (ESI) available: Hyper-CEST NMR pulse sequence, xenon exchange profiles for all spore strains, and depolarization rate measurements are included as supplementary figures S1–S7. See DOI: 10.1039/b000000x/
References
- 1.Kaieda S, Setlow B, Setlow P, Halle B. Biophys J. 2013;105:2016–2023. doi: 10.1016/j.bpj.2013.09.022. [DOI] [PMC free article] [PubMed] [Google Scholar]
- 2.Leuschner RGK, Lillford PJ. Int J Food Microbiol. 2001;63:35–50. doi: 10.1016/s0168-1605(00)00396-2. [DOI] [PubMed] [Google Scholar]
- 3.Sunde EP, Setlow P, Hederstedt L, Halle B. Proc Natl Acad Sci U S A. 2009;106:19334–19339. doi: 10.1073/pnas.0908712106. [DOI] [PMC free article] [PubMed] [Google Scholar]
- 4.Wei Q, Seward GK, Hill PA, Patton B, Dimitrov IE, Kuzma NN, Dmochowski IJ. J Am Chem Soc. 2006;128:13274–13283. doi: 10.1021/ja0640501. [DOI] [PubMed] [Google Scholar]
- 5.Hill PA, Wei Q, Troxler T, Dmochowski IJ. J Am Chem Soc. 2009;131:3069–3077. doi: 10.1021/ja8100566. [DOI] [PMC free article] [PubMed] [Google Scholar]
- 6.Hill PA, Wei Q, Eckenhoff RG, Dmochowski IJ. J Am Chem Soc. 2007;129:9262–9263. doi: 10.1021/ja072965p. [DOI] [PubMed] [Google Scholar]
- 7.Jacobson DR, Khan NS, Collé R, Fitzgerald R, Laureano-Pérez L, Bai Y, Dmochowski IJ. Proc Natl Acad Sci U S A. 2011;108:10969–10973. doi: 10.1073/pnas.1105227108. [DOI] [PMC free article] [PubMed] [Google Scholar]
- 8.Bai Y, Hill PA, Dmochowski IJ. Anal Chem. 2012;84:9935–9941. doi: 10.1021/ac302347y. [DOI] [PMC free article] [PubMed] [Google Scholar]
- 9.Schröder L, Lowery TJ, Hilty C, Wemmer DE, Pines A. Science. 2006;314:446–449. doi: 10.1126/science.1131847. [DOI] [PubMed] [Google Scholar]
- 10.Baumer D, Brunner E, Blümler P, Zänker PP, Spiess HW. Angew Chem Int Edit. 2006;45:7282–7284. doi: 10.1002/anie.200601008. [DOI] [PubMed] [Google Scholar]
- 11.Brotin T, Dutasta JP. Chem Rev. 2009;109:88–130. doi: 10.1021/cr0680437. [DOI] [PubMed] [Google Scholar]
- 12.Driehuys B, Moller HE, Cleveland ZI, Pollaro J, Hedlund LW. Radiology. 2009;252:386–393. doi: 10.1148/radiol.2522081550. [DOI] [PMC free article] [PubMed] [Google Scholar]
- 13.Boutin C, Desvaux H, Carrière M, Leteurtre F, Jamin N, Boulard Y, Berthault P. NMR Biomed. 2011;24:1264–1269. doi: 10.1002/nbm.1686. [DOI] [PubMed] [Google Scholar]
- 14.Boutin C, Stopin A, Lenda F, Brotin T, Dutasta JP, Jamin N, Sanson A, Boulard Y, Leteurtre F, Huber G, Bogaert-Buchmann A, Tassali N, Desvaux H, Carrière M, Berthault P. Bioorg Med Chem. 2011;19:4135–4143. doi: 10.1016/j.bmc.2011.05.002. [DOI] [PubMed] [Google Scholar]
- 15.Zhou X, Graziani D, Pines A. Proc Natl Acad Sci U S A. 2009;106:16903–16906. doi: 10.1073/pnas.0909147106. [DOI] [PMC free article] [PubMed] [Google Scholar]
- 16.Meldrum T, Seim KL, Bajaj VS, Palaniappan KK, Wu W, Francis MB, Wemmer DE, Pines A. J Am Chem Soc. 2010;132:5936–5937. doi: 10.1021/ja100319f. [DOI] [PubMed] [Google Scholar]
- 17.Mugler JP, Altes TA, Ruset IC, Dregely IM, Mata JF, Miller GW, Ketel S, Ketel J, Hersman FW, Ruppert K. Proc Natl Acad Sci U S A. 2010;107:21707–21712. doi: 10.1073/pnas.1011912107. [DOI] [PMC free article] [PubMed] [Google Scholar]
- 18.Schröder L. Phys Medica. 2013;29:3–16. doi: 10.1016/j.ejmp.2011.11.001. [DOI] [PubMed] [Google Scholar]
- 19.Nikolaou P, Coffey AM, Walkup LL, Gust BM, Whiting N, Newton H, Barcus S, Muradyan I, Dabaghyan M, Moroz GD, Rosen MS, Patz S, Barlow MJ, Chekmenev EY, Goodson BM. Proc Natl Acad Sci U S A. 2013;110:14150–14155. doi: 10.1073/pnas.1306586110. [DOI] [PMC free article] [PubMed] [Google Scholar]
- 20.Ward KM, Aletras AH, Balaban RS. J Magn Reson. 2000;143:79–87. doi: 10.1006/jmre.1999.1956. [DOI] [PubMed] [Google Scholar]
- 21.Woods M, Woessner DE, Sherry AD. Chem Soc Rev. 2006;35:500–511. doi: 10.1039/b509907m. [DOI] [PMC free article] [PubMed] [Google Scholar]
- 22.Aime S, Castelli DD, Terreno E. Angew Chem Int Edit. 2005;44:5513–5515. doi: 10.1002/anie.200501473. [DOI] [PubMed] [Google Scholar]
- 23.Ruppert K, Brookeman JR, Hagspiel KD, Mugler JP. Magn Reson Med. 2000;44:349–357. doi: 10.1002/1522-2594(200009)44:3<349::aid-mrm2>3.0.co;2-j. [DOI] [PubMed] [Google Scholar]
- 24.Sloniec J, Schnurr M, Witte C, Resch-Genger U, Schröder L, Hennig A. Chem Eur J. 2013;19:3110–3118. doi: 10.1002/chem.201203773. [DOI] [PubMed] [Google Scholar]
- 25.Stevens TK, Palaniappan KK, Ramirez RM, Francis MB, Wemmer DE, Pines A. Magn Reson Med. 2013;69:1245–1252. doi: 10.1002/mrm.24371. [DOI] [PubMed] [Google Scholar]
- 26.Klippel S, Döpfert J, Jayapaul J, Kunth M, Rossella F, Schnurr M, Witte C, Freund C, Schröder L. Angew Chem Int Edit. 2014;53:493–496. doi: 10.1002/anie.201307290. [DOI] [PubMed] [Google Scholar]
- 27.Stevens TK, Ramirez RM, Pines A. J Am Chem Soc. 2013;135:9576–9579. doi: 10.1021/ja402885q. [DOI] [PubMed] [Google Scholar]
- 28.Shapiro MG, Ramirez RM, Sperling LJ, Sun G, Sun J, Pines A, Schaffer DV, Bajaj VS. Nat Chem. 2014 doi: 10.1038/nchem.1934. advance online publication. [DOI] [PubMed] [Google Scholar]
- 29.Piggot PJ, Hilbert DW. Curr Opin Microbiol. 2004;7:579–586. doi: 10.1016/j.mib.2004.10.001. [DOI] [PubMed] [Google Scholar]
- 30.Setlow P. J Appl Microbiol. 2006;101:514–525. doi: 10.1111/j.1365-2672.2005.02736.x. [DOI] [PubMed] [Google Scholar]
- 31.Rupnik M, Wilcox MH, Gerding DN. Nat Rev Micro. 2009;7:526–536. doi: 10.1038/nrmicro2164. [DOI] [PubMed] [Google Scholar]
- 32.Mock M, Fouet A. Annu Rev Microbiol. 2001;55:647–671. doi: 10.1146/annurev.micro.55.1.647. [DOI] [PubMed] [Google Scholar]
- 33.Driks A. Mol Aspects Med. 2009;30:368–373. doi: 10.1016/j.mam.2009.08.001. [DOI] [PubMed] [Google Scholar]
- 34.McKenney PT, Driks A, Eichenberger P. Nat Rev Micro. 2013;11:33–44. doi: 10.1038/nrmicro2921. [DOI] [PMC free article] [PubMed] [Google Scholar]
- 35.Traag BA, Driks A, Stragier P, Bitter W, Broussard G, Hatfull G, Chu F, Adams KN, Ramakrishnan L, Losick R. Proc Natl Acad Sci U S A. 2010;107:878–881. doi: 10.1073/pnas.0911299107. [DOI] [PMC free article] [PubMed] [Google Scholar]
- 36.Taylor KML, Lin W. J Mater Chem. 2009;19:6418–6422. [Google Scholar]
- 37.Xu H, Rao X, Gao J, Yu J, Wang Z, Dou Z, Cui Y, Yang Y, Chen B, Qian G. Chem Comm. 2012;48:7377–7379. doi: 10.1039/c2cc32346j. [DOI] [PubMed] [Google Scholar]
- 38.Cable ML, Kirby JP, Levine DJ, Manary MJ, Gray HB, Ponce A. J Am Chem Soc. 2009;131:9562–9570. doi: 10.1021/ja902291v. [DOI] [PMC free article] [PubMed] [Google Scholar]
- 39.Lee I, Oh WK, Jang J. J Hazard Mater. 2013;252–253:186–191. doi: 10.1016/j.jhazmat.2013.03.003. [DOI] [PubMed] [Google Scholar]
- 40.Oh WK, Jeong YS, Song J, Jang J. Biosens Bioelectron. 2011;29:172–177. doi: 10.1016/j.bios.2011.08.013. [DOI] [PubMed] [Google Scholar]
- 41.Stöckel S, Meisel S, Elschner M, Rösch P, Popp J. Anal Chem. 2012;84:9873–9880. doi: 10.1021/ac302250t. [DOI] [PubMed] [Google Scholar]
- 42.Liu G, Bettegowda C, Qiao Y, Staedtke V, Chan KWY, Bai R, Li Y, Riggins GJ, Kinzler KW, Bulte JWM, McMahon MT, Gilad AA, Vogelstein B, Zhou S, van Zijl PCM. Magn Reson Med. 2013;70:1690–1698. doi: 10.1002/mrm.24955. [DOI] [PMC free article] [PubMed] [Google Scholar]
- 43.Ghosh S, Setlow B, Wahome PG, Cowan AE, Plomp M, Malkin AJ, Setlow P. J Bacteriol. 2008;190:6741–6748. doi: 10.1128/JB.00896-08. [DOI] [PMC free article] [PubMed] [Google Scholar]
- 44.Youngman PJ, Perkins JB, Losick R. Proc Natl Acad Sci U S A. 1983;80:2305–2309. doi: 10.1073/pnas.80.8.2305. [DOI] [PMC free article] [PubMed] [Google Scholar]
- 45.Bozue J, Moody KL, Cote CK, Stiles BG, Friedlander AM, Welkos SL, Hale ML. Infect Immun. 2007;75:4498–4505. doi: 10.1128/IAI.00434-07. [DOI] [PMC free article] [PubMed] [Google Scholar]
- 46.Giorno R, Bozue J, Cote C, Wenzel T, Moody KS, Mallozzi M, Ryan M, Wang R, Zielke R, Maddock JR, Friedlander A, Welkos S, Driks A. J Bacteriol. 2007;189:691–705. doi: 10.1128/JB.00921-06. [DOI] [PMC free article] [PubMed] [Google Scholar]
- 47.Driks A, Roels S, Beall B, Moran CP, Losick R. Gene Dev. 1994;8:234–244. doi: 10.1101/gad.8.2.234. [DOI] [PubMed] [Google Scholar]
- 48.Zheng LB, Donovan WP, Fitz-James PC, Losick R. Gene Dev. 1988;2:1047–1054. doi: 10.1101/gad.2.8.1047. [DOI] [PubMed] [Google Scholar]
- 49.Berthault P, Huber G, Desvaux H. Prog Nucl Mag Res Sp. 2009;55:35–60. [Google Scholar]
- 50.Raftery D. Annu Rep NMR Spectrosc. Vol. 57. Elsevier Academic Press Inc; San Diego: 2006. pp. 205–270. [Google Scholar]
- 51.Ratcliffe CI. Annu Rep NMR Spectrosc. Vol. 36. Elsevier Academic Press Inc; 1998. pp. 123–221. [Google Scholar]
- 52.Bifone A, Song YQ, Seydoux R, Taylor RE, Goodson BM, Pietrass T, Budinger TF, Navon G, Pines A. Proc Natl Acad Sci USA. 1996;93:12932–12936. doi: 10.1073/pnas.93.23.12932. [DOI] [PMC free article] [PubMed] [Google Scholar]
- 53.Bowers CR, Storhaug V, Webster CE, Bharatam J, Cottone A, Gianna R, Betsey K, Gaffney BJ. J Am Chem Soc. 1999;121:9370–9377. doi: 10.1021/ja991443+. [DOI] [PMC free article] [PubMed] [Google Scholar]
- 54.Desvaux H, Dubois L, Huber G, Quillin ML, Berthault P, Matthews BW. J Am Chem Soc. 2005;127:11676–11683. doi: 10.1021/ja053074p. [DOI] [PubMed] [Google Scholar]
- 55.Rubin SM, Lee SY, Ruiz EJ, Pines A, Wemmer DE. J Mol Biol. 2002;322:425–440. doi: 10.1016/s0022-2836(02)00739-8. [DOI] [PubMed] [Google Scholar]
- 56.Tilton RF, Kuntz ID. Biochemistry. 1982;21:6850–6857. doi: 10.1021/bi00269a035. [DOI] [PubMed] [Google Scholar]
- 57.Rubin SM, Spence MM, Dimitrov IE, Ruiz EJ, Pines A, Wemmer DE. J Am Chem Soc. 2001;123:8616–8617. doi: 10.1021/ja0110325. [DOI] [PubMed] [Google Scholar]
Associated Data
This section collects any data citations, data availability statements, or supplementary materials included in this article.