Abstract
Intervertebral disc mechanics are affected by both disc shape and disc degeneration, which in turn each affect the other; disc mechanics additionally have a role in the etiology of disc degeneration. Finite element analysis (FEA) is a favored tool to investigate these relationships, but limited data for intervertebral disc 3D shape has forced the use of simplified or single-subject geometries, with the effect of inter-individual shape variation investigated only in specialized studies. Similarly, most data on disc shape variation with degeneration is based on 2D mid-sagittal images, which incompletely define 3D shape changes. Therefore, the objective of this study was to quantify inter-individual disc shape variation in 3D, classify this variation into independently-occurring modes using a statistical shape model, and identify correlations between disc shape and degeneration. Three-dimensional disc shapes were obtained from MRI of 13 human male cadaver L3L4 discs. An average disc shape and four major modes of shape variation (representing 90% of the variance) were identified. The first mode represented disc axial area and was significantly correlated to degeneration (R2 = 0.44), indicating larger axial area in degenerate discs. Disc height variation occurred in three distinct modes, each also involving non-height variation. The statistical shape model provides an average L3L4 disc shape for FEA that is fully defined in 3D, and makes it convenient to generate a set of shapes with which to represent aggregate inter-individual variation. Degeneration grade-specific shapes can also be generated. To facilitate application, the model is included in this paper’s supplemental content.
Keywords: Intervertebral disc, degeneration, statistical shape model, morphometry, magnetic resonance imaging
Introduction
Intervertebral disc shape influences both nutrient transport and spine mechanics (Fujiwara et al., 2000; Magnier et al., 2009; Meijer et al., 2011; Niemeyer et al., 2012; Niosi and Oxland, 2004), and shape changes are involved in disc degeneration (Berlemann et al., 1998; Pappou et al., 2007; Pfirrmann et al., 2006; Videman et al., 2008; Videman et al., 2007). The mechanical consequences of disc degeneration and the treatments meant to address it are often investigated with finite element analysis (FEA). However, due to lack of multi-subject 3D shape information in the literature, investigators typically use a 3D geometry from on a single subject (El-Rich et al., 2008; Rundell et al., 2009) or a simplified geometry extrapolated from vertebral bone morphometry (point-to-point distances) (Kim et al., 2001; Kim, 2000; Meijer et al., 2011; Meijer et al., 2010; Niemeyer et al., 2012; Panjabi et al., 1992; Rohlmann et al., 2006; Rundell et al., 2009; Smit, 1996; Yan et al., 2011). Morphometry of the disc itself is also available, based on 2D mid-sagittal MRI (Boos et al., 1996; Fujiwara et al., 2000; Kwok et al., 2012) or dissected discs (Beckstein et al., 2008; Brinckmann and Grootenboer, 1991; Keller et al., 1987; Nachemson et al., 1979; O’Connell et al., 2007; Porter et al., 1989). These lists are representative, not exhaustive. The common factor is that all these studies use morphometry, which only defines distances between specific points. If morphometry is used to construct a 3D shape for FEA, the resulting shape is underdetermined, and the gaps must be filled in by guesswork. A 3D single-subject image produces a fully determined shape, but may not be representative. A solution to this dilemma would be greatly beneficial.
Since variation in intervertebral disc shape causes corresponding variation in spine mechanics (Campana et al., 2007; Farfan et al., 1972; Galbusera et al., 2011; Keller et al., 2005; Meijer et al., 2011; Meijer et al., 2010; Niemeyer et al., 2012; Schmidt et al., 2013), it is important to include inter-individual shape variation in FEA studies of the intervertebral disc. However, the effort involved in doing so for a morphometry-based geometry relegates such a task to specialized studies (Meijer et al., 2011; Niemeyer et al., 2012). There is a need for a parameterization of 3D intervertebral disc shape variation that can be conveniently incorporated into FEA models.
Relations between degeneration and 3D disc shape are also incompletely examined, as prior studies of degeneration and disc shape used morphometry, usually with 2D sagittal images (Battié et al., 2008; Benneker et al., 2005; Berlemann et al., 1998; Luoma et al., 2001; Pfirrmann et al., 2006; Pfirrmann et al., 2001; Videman et al., 2008; Videman et al., 2006; Videman et al., 1995). As above, this poses difficulty for FEA of degenerate discs. Additionally, 2D or morphometric analysis may overlook degeneration-related shape variation outside the imaging plane or away from the morphometric markers.
This study was designed to improve upon these three issues by (1) quantifying inter-individual 3D shape variation of the L3L4 disc, (2) parameterizing this variation with a minimum number of parameters, and (3) identifying relationships between 3D shape and degeneration. The L3L4 disc was chosen because FEA studies often target it specifically (Bono et al., 2007; Dahl et al., 2010; Kim and Choi, 2009; Kim, 2000; Lee et al., 2000; Meijer et al., 2011; Niemeyer et al., 2012; Rohlmann et al., 2006; Rundell et al., 2009). 3D disc shapes were measured from MRI, the mean shape was computed, and the shape variation was decomposed and parameterized as independent principal components. Importantly, this decomposition is made without any a priori assumptions about the kinds of shape variation in the data. The resulting shape model facilitates examination of relationships between disc shape and degeneration and provides convenient means to incorporate inter-individual shape variation in disc FEA studies.
Materials and Methods
Samples
Thirteen fresh-frozen spines were obtained from donor human cadavers via National Disease Research Interchange. After thawing, the spines were imaged intact by T2-weighted MRI in order to assign degenerative grades (Pfirrmann scale) (Pfirrmann et al., 2001), which has been validated as having good inter-rater reliability (Kettler and Wilke, 2006). The grades were averaged between three graders. Following T2 imaging, L3L4 discs were dissected (with the surrounding bone attached), vacuum-sealed in plastic, and stored frozen. The samples remained sealed in plastic throughout the study to avoid swelling or shrinking due to exposure to water or air. Donors ranged from 50–93 years of age (average 67.5 years) and were all male. Degenerative grade was 2.3–5.0 (mean 3.3).
Image Segmentation
High-resolution MRI was acquired for shape analysis. In preparation for imaging, the samples were thawed and surrounded (outside their encasing plastic) with 2% agarose, which has similar magnetic susceptibility to tissue. Images were acquired using a 7T Siemens whole-body MRI scanner and a custom transmit/receive RF coil programmed with a 3D FLASH sequence (TE = 3.7 ms; TR = 9 ms) (Moon et al., 2013). Voxel size was 200 μm isotropic.
Discs were segmented from the high-resolution images using Convert3D and ITK-SNAP (Yushkevich et al., 2006). Each MR image was preprocessed with N3 intensity inhomogeneity correction, 2:1 resampling, and Gaussian smoothing (Figure 1). ITK-SNAP’S active contour tool was used to create an initial automatic segmentation. Segmentation was completed manually. The segmentations were aligned to a common anatomical coordinate system using Matlab. Translational alignment was accomplished by moving the centroid to the origin. For rotational alignment, the major axes were used to define the aligned coordinate system (algorithm in Supplemental Information) (Gonzalez and Woods, 2002; Petrou and Petrou, 2010).
Figure 1.
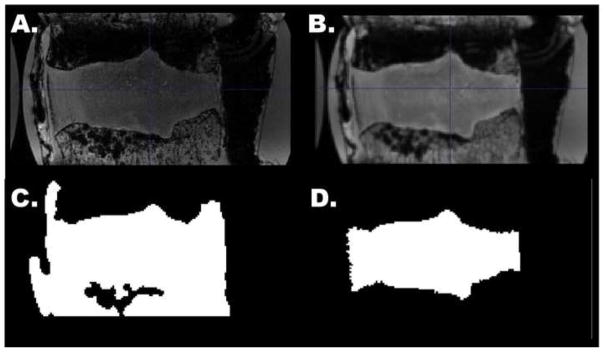
Mid-sagittal slice of a 3D disc MRI, illustrating image processing steps. The initial image (a) was bias corrected and smoothed (b). An automatic segmentation was generated in ITK-SNAP (c), then manually corrected (d).
Shape Analysis
A shape model was created from the disc segmentations using principal components analysis (PCA) according to established methods (Tsai et al., 2003). First, each segmentation was converted to a signed distance function, which encodes a shape as an image of distance from the shape boundary. The mean shape Φ0 was obtained by calculating the mean of the signed distance functions. Subtracting the mean disc shape from each original shape forms a set of residuals, from which were calculated the principal components (PCs) of variation Φi. The PCs were ordered by the amount of variance they represent (PC 1 representing the most variance) and normalized by their standard deviations. Each PC represents an independent mode of disc shape variation. Since the dataset contained 13 discs, the shape model defines 12 PCs and one mean shape. Each PC is orthogonal to all the others; together they form a basis which spans the same 3D shape space as the original dataset. Any shape in the original dataset, or any shape in-between, can be represented as the sum of the mean shape and a weighted linear combination of the PCs: . The scalar weighting factors wi compactly and completely define the shape. To give the weights physical meaning, we expressed wi as fractions of the standard deviation σi for each Φi.
To aid in comparison to prior work, morphometric measurements of disc axial area, width, depth (anterior-posterior distance), and height were made directly from the 3D disc segmentation. Axial area was measured from the disc’s projection into the anterior-posterior/left-right plane. Width was measured as the distance between the most extreme points on the left-right axis. Depth was measured as the anterior-posterior distance at the mid-sagittal plane. Height was defined as the volume divided by the axial area.
Leave-One-Out Analysis
In order to determine if the shape model was stable (not unduly influenced by outlier discs), a leave-one-out analysis (a type of cross-validation) was performed (Morra et al., 2008; Xie et al., 2005; Yang, 2004). The PCA procedure was repeated excluding each disc in turn, creating 13 reduced models. The PCs in each reduced model were compared with the full model using vector dot products. A dot product of zero indicates maximum change; a dot product of one indicates no change. If the model is stable, the inclusion or exclusion of any single disc will have little effect.
Statistics
Relationships between degenerative grade and disc shape, represented by both the shape model (weights wi) and morphometry (axial area, depth, width, and height), were tested by Pearson correlation. The significance level (α) was set to 0.05, and the power (β) was 0.8 to detect Pearson R2 = 0.5, as we did not expect degeneration-related shape changes to be subtle. Summary statistics are reported as mean ± standard deviation (s.d.).
Results
Physical Meaning of the Shape Model
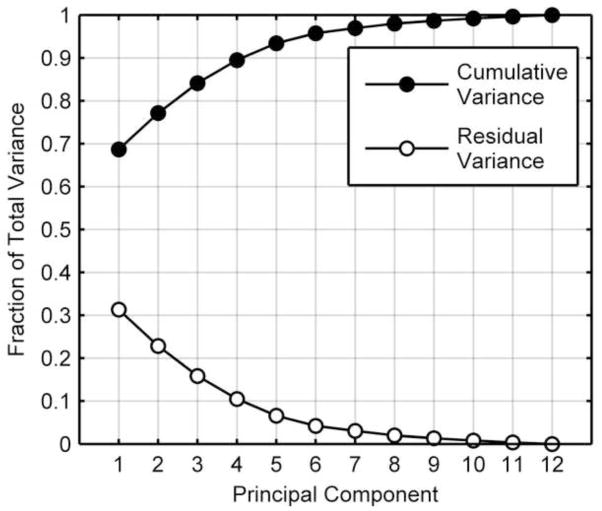
The shape model includes a mean shape and encodes shape variability using a set of principal components (PCs). The observed mean shape was overall qualitatively normal, but did have a slight asymmetry between the posterolateral margins (Figure 2). Each PC represents a distinct kind of shape variation. The majority (70%) of shape variation in the dataset was represented by PC 1 (Figure 3). PCs 1–4 together are sufficient to represent 90% of the variability in disc shape, and so were selected for analysis.
Figure 2.
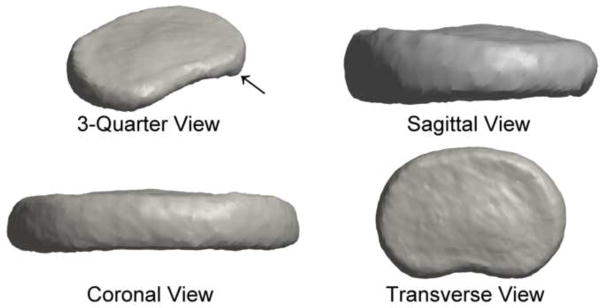
The mean disc shape displayed the expected kidney-bean shape of an intervertebral disc. The shape was nearly symmetric, with a slight protrusion at the inferior posterolateral margin (arrow).
Figure 3.
Cumulative shape variance represented by the principal components. The first four principal components represented ~90% of the total variance of intervertebral disc shape. PC 1 alone accounted for ~70% of the variance.
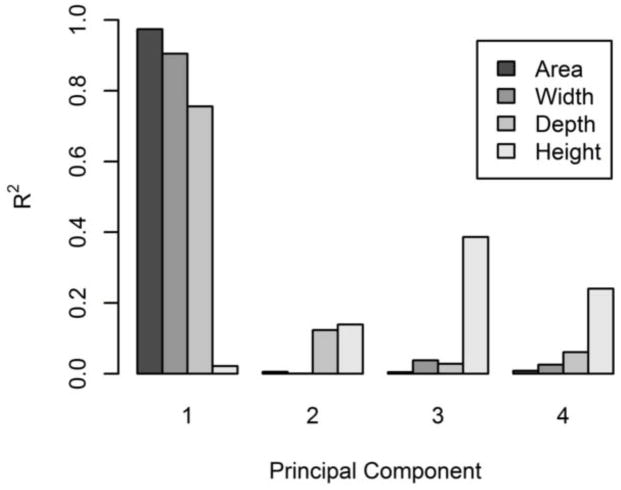
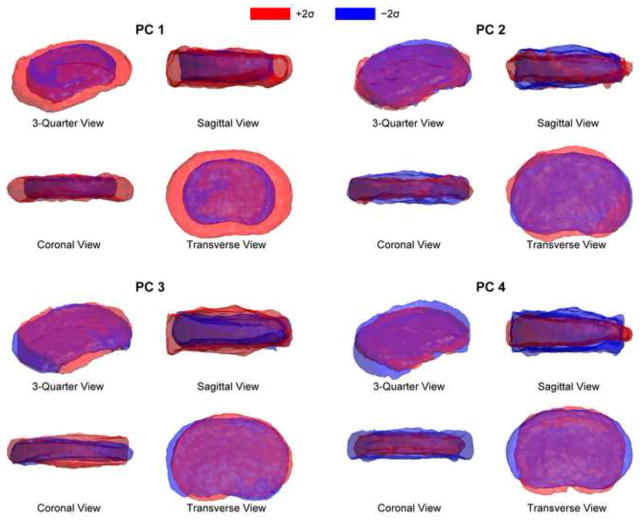
In terms of geometry, PC 1 represents variability in axial area (R2 = 0.97), but is unrelated to disc height (R2 = 0.02) (Figure 4). Increased PC 1 indicates increased axial area, a shallower or nonexistent posterior notch, and rounded sides (Figure 5). PCs 2–4 are all somewhat related to disc height, as well as more complicated shape variations. Increased PC 2 indicates protrusion of the anterior, left, and posterolateral margins and increased height (Figures 4 and 5). Increased PC 3 indicates uniform bulging of the left margin and increased disc height. PC 3 has the strongest relationship to disc height, representing ~40% of the height variation (Figure 4). Increased PC 4 indicates increased depth, decreased width, and decreased disc height (Figure 5). The kind of height variability encoded by PC 3 includes left-right asymmetry, whereas PCs 2 and 4 represent uniform height variation.
Figure 4.
Correlation between shape model PCs and disc morphometry. PC 1 was strongly related to axial area, width, and anterior-posterior depth. PC 3 had the strongest relationship to disc height, with PCs 2 and 4 somewhat related to disc height.
Figure 5.
Each principal component encodes a different kind of shape variation, illustrated here by adding ± 2 s.d. of PCs 1–4 to the mean shape. PC 1 encodes variation in axial area. PCs 2–4 each encode a different form of disc height variation, mixed with other kinds of variation.
Morphometry
Morphometric measurements of each disc were made for comparison with prior work and to aid in explicating the shape model. Height, depth, width, and axial area are given in Table 1.
Table 1.
L3L4 disc morphometry. Statistics for Brinckmann and Grootenboer (1991) and Keller et al. (1987) were calculated by pooling reported measurements of individual discs. Where possible, measurements were selected that match the demographics of the current data set. For Nachemson et al. (1979) the reported standard deviations include non-L3L4 levels & Marfan syndrome discs, as only means were reported by subset. The entries for Panjabi et al. (1992) are the average of the reported superior and inferior vertebral endplate dimensions. n.d. = no data.
| Reference | Sex | Age (years) | Height (mm) | Width (mm) | Depth (mm) | Area (cm2) |
|---|---|---|---|---|---|---|
| This study | Male | 50–93 | 10.2 ± 1.9 | 63.3 ± 6.8 | 42.2 ± 5.2 | 23.3 ± 4.5 |
| Nachemson et al. (1979) | Mixed | 21–60 | 16.0 ± 0.3 | 54 ± 8 | 40 ± 6 | 15.9 ± 3.1 |
| Showalter et al. (2012) | Male | 22–42 | 10.9 ± 0.8 | 55 ± 2 | 38 ± 2 | 19.2 ± 1.8 |
| Brinckmann and Grootenboer (1991) and Keller et al. (1987) | 4 M, 1 F | 37–82 | 10.6 ± 1.0 | n.d. | n.d. | 22.2 ± 5.6 |
| Amonoo-Kuofi et al. (1991) | Male | 50–64 | 7.5 ± 0.6 | n.d. | 42.7 ± 1.9 | n.d. |
| Panjabi et al. (1992) | 8 M, 4 F | 19–59 | n.d. | 47.3 ± 1.2 | 35.1 ± 1.2 | 12.6 ± 0.6 |
Effect of Degeneration
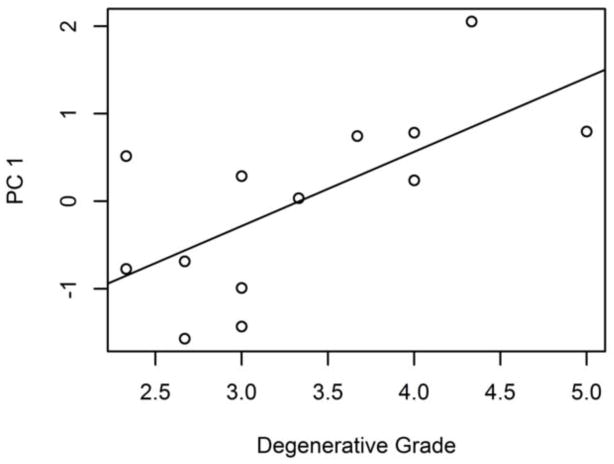
The effect of degeneration on disc shape was identified by correlating the modes of shape variation with degenerative grade. Of all the modes of shape variation identified by the shape model, only PC 1 was significantly correlated to degeneration (r = 0.66 (95% CI 0.18, 0.89); intercept = −2.8 ± 1.0, slope = 0.85 ± 0.29) (Figure 6), indicating that degenerate discs tend to have larger axial area. This result is corroborated by the morphometric measures (Figure 7)—degenerative grade was correlated with axial area (r = 0.74 (95% CI 0.32, 0.92); intercept = 9.7 ± 3.8 cm2, slope = 4.1 ± 1.1 cm2), width (r = 0.60 (95% CI 0.07, 0.86); intercept = 46.8 ± 6.8 mm, slope = 5.0 ± 2.0 mm), and depth (r = 0.85 (95% CI 0.55, 0.95); intercept = 24.2 ± 3.5 mm, slope = 5.4 ± 1.0 mm).
Figure 6.
PC 1 is moderately correlated (R2 = 0.44) with degenerative grade.
Figure 7.
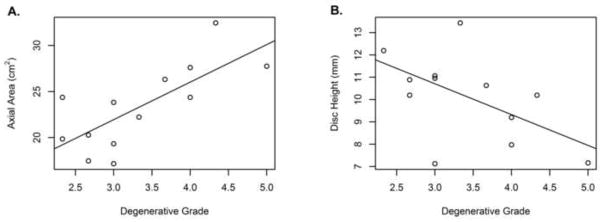
Intervertebral disc morphometry was correlated with degeneration, (a) Axial area increased with degeneration (r = 0.74 (95% CI 0.32, 0.92)). (b) Height decreased with degeneration (r = −0.58 (95% CI −0.86, −0.05)).
Degeneration was also correlated with height (r = −0.58 (95% CI −0.86, −0.05); intercept = 14.8 ± 2.0 mm, slope = −1.4 ± 0.6 mm). Note that the Pfirrmann scale does consider height loss as part of the score, so some correlation with height is expected.
Leave-one-out analysis
A leave-one-out analysis was conducted to check if the shape model was unduly influenced by outlier discs. Reduced models were created by excluding each disc in turn and repeating the shape analysis. The boundary of the mean shape moved an average distance of 0.10 mm (range 0.04–0.12 mm), less than the image resolution. The stability of each mode of shape variation was evaluated by its dot products between the full model and reduced models (Table 2). PC 1 exhibits negligible change with the exclusion of any single disc. The exclusion of disc #5 or #6 produced large apparent changes in PCs 2 and 3, but this is actually caused by the two vectors swapping rank. Reversing the swap, the PC 2 dot products are 0.58 and 0.68 and the PC 3 dot products are 0.90 and 1.00. Still, PC 3 is sensitive to disc #10, which had an unusually short depth relative to its width. Overall, while PCs 2–4 may change meaning slightly between datasets (and PCs > 4 may greatly change meaning) the meaning of the mean shape and PC 1 is consistent.
Table 2.
Dot products between full and reduced model PCs. PC 1 does not change between the full and reduced models, indicating that PC 1’s definition is not distorted by any outlier disc shapes. The remaining PCs are somewhat sensitive to the influence of particular discs.
| Excluded Disc | PC 1 | PC 2 | PC 3 | PC 4 |
|---|---|---|---|---|
| 1 | 1.00 | 1.00 | 0.99 | 0.72 |
| 2 | 1.00 | 0.95 | 0.83 | 0.87 |
| 3 | 1.00 | 1.00 | 1.00 | 0.99 |
| 4 | 1.00 | 1.00 | 1.00 | 0.99 |
| 5 | 0.98 | 0.41 | 0.42 | 0.71 |
| 6 | 1.00 | 0.07 | 0.05 | 0.73 |
| 7 | 1.00 | 0.96 | 0.87 | 0.94 |
| 8 | 1.00 | 0.99 | 0.99 | 0.90 |
| 9 | 1.00 | 1.00 | 1.00 | 1.00 |
| 10 | 1.00 | 0.98 | 0.32 | 0.36 |
| 11 | 1.00 | 1.00 | 0.96 | 0.93 |
| 12 | 1.00 | 1.00 | 0.99 | 0.99 |
| 13 | 1.00 | 0.99 | 0.99 | 0.93 |
| mean | 1.00 | 0.87 | 0.80 | 0.85 |
| s.d. | 0.01 | 0.29 | 0.32 | 0.18 |
Discussion
Shape and degeneration
This study quantified intervertebral disc shape variation from 3D MRI of a set of human L3L4 discs. The most significant finding was that degeneration is associated with greater disc axial area. Variation in axial area (PC 1) accounts for most (70%) of the overall variation in disc shape (Figure 3). The correlation between disc area and degeneration (R2 = 0.44) therefore accounts for a large part (~30%) of disc shape variation. This correlation was confirmed, independent of the shape model, by basic morphometry. The use of 3D images was advantageous in this respect, as in 2D it is ambiguous whether a bulge is local or global (Kalichman, 2010; Milette et al., 1999; Videman et al., 2008). This correlation between degeneration and axial area could be explained as either degeneration causing whole-disc bulging or larger discs being more prone to degeneration (Brinckmann and Grootenboer, 1991; Milette et al., 1999; Videman et al., 2007; Yates et al., 2010).
Although disc height is typically regarded as a single parameter (Berlemann et al., 1998; Pfirrmann et al., 2006), the shape model identified three distinct height-related modes of shape variation. Only PCs 2 (uniform height change) and 4 (altered axial aspect ratio plus uniform height change) had an indication (trend) of being related to degeneration (r ≈ 0.4, p ≈ 0.1 for both). PC 3 (left-right wedging), despite having the strongest relationship to height (Figure 4), had no significant correlation with degenerative grade. Height changes may be more pronounced for the L4L5 disc (Battié et al., 2004). The existence of multiple types of height-related variation should be considered in future investigations of disc biomechanics and classification of degeneration phenotype, as these modes of height loss would affect spine mechanics in dissimilar ways.
Model consistency and limitations
The morphometric measurements from this study are consistent with previous work (Table 1), with differences in reported height attributable to procedure (caliper measurement of whole motion segments in (Nachemson et al., 1979) and lateral radiography in (Amonoo-Kuofi, 1991)). The lesser disc area in (Nachemson et al., 1979) may be due to including female discs in the average. The CT-derived vertebral body measurements from Panjabi et al. (1992) are much smaller than measurements of the disc, which may have implications for spine FEA based on these measurements (Meijer et al., 2011; Meijer et al., 2010; Niemeyer et al., 2012). We recommend using both disc- and vertebral body-specific measurements when possible. The remaining disc-specific studies are consistent with the present study and each other.
As demonstrated by the leave-one-out analysis, the current sample size is sufficient to clearly establish the definition of the mean shape and PC 1 and that multiple modes of height-related variation (PCs 2–4) exist. The statistical power was sufficient to identify a correlation between PC 1 and degeneration.
The primary limitation of this study is the subpopulation used (aged, male, L3L4, and moderately to severely degenerate). However, the use of consistent gender and level eliminated these factors as sources of variation, maximizing statistical power to detect degeneration effects. The use of cadaver discs is also a limitation, as the fluid within the disc redistributes after death (Johnstone et al., 1992). It is possible that this redistribution affects disc shape, though this effect remains unquantified. A further limitation is the use of Pfirrmann grading to quantify disc degeneration. Pfirrmann grading mixes several possibly-independent degenerative changes (reduced nucleus image intensity, loss of contrast between nucleus and annulus, and decreased height). However, it is validated, and there is no better alternative (Kettler and Wilke, 2006). The shape model also does not include the internal structures of the disc, such as the nucleus. The success of the shape model in the present context justifies future studies extending it to a broader population and other anatomical targets.
Application to computer simulations
The 3D statistical shape modeling approach used in this study has three important advantages that make it ideal for use in finite element analysis (FEA), which is an important tool to explore the biomechanical (Fagan et al., 2002; Goto et al., 2002; Natarajan et al., 2006; Schmidt et al., 2013; Schroeder et al., 2010; Schroeder et al., 2007; Schroeder et al., 2006) or biological (Magnier et al., 2009; Malandrino et al., 2011; Soukane et al., 2007; Zhu et al., 2012) aspects of disc degeneration. First, it provides an average L3L4 disc shape, with a complete 3D definition, that represents multiple people (Figure 8a). This is a major advance in improving the representativeness of computer simulations.
Figure 8.
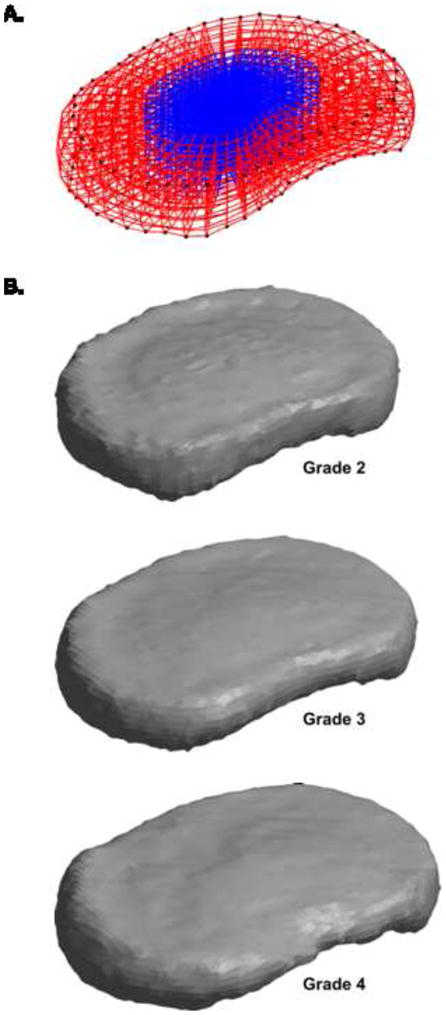
The shape model can be used to generate physiologically representative meshes for finite element analysis. (A) The mean shape, shown here as an example mesh, is the simplest representative shape. The nucleus pulposus, in blue, is defined using data from O’Connell et al. (2007). (B) Since PC 1 is correlated with degeneration, PC 1 can be scaled and summed with the mean shape to create representative shapes for specific degeneration grades. Other linear combinations of principal components can also be used, depending on the application. All shapes in this figure are plotted using the same scale.
Second, the shape model provides a single parameter (PC 1) that can represent 70% of the inter-individual variation from this average shape. An investigator running a simulation of the disc could thus run analysis for the mean shape ± 1 s.d. PC 1 to obtain an estimate of how the result of the simulation would vary between individuals. Other PCs could be also used to obtain a more precise result. Since the PCs are ranked according to their variance (Figure 3) and have clear physical meaning (Figure 5), it is easy to select the appropriate number of PCs for the application. Each PC can be varied independently or together, depending on the desired complexity.
Third, the model can be used to construct shapes representing specific degeneration grades by adding the appropriate weight of PC 1 (Figure 8b); using the correlation in Figure 6, we represented grade 2 discs as Φ0 − 1.13σ1Φ1, grade 3 as Φ0 − 0.28σ1Φ1, and grade 4 as Φ0 + 0.56σ1Φ1.
In conclusion, the shape model offers a convenient and powerful option for incorporating shape variation in future disc FEA studies. Without using the shape model, incorporating inter-individual shape variation in a simulation study requires constructing many subject-specific models, running the simulation on each, and calculating summary statistics on the simulation results. This process is extremely laborious. Consequently, shape variation has only been included in a few studies, and then only in terms of simplified CAD-like geometry with assumed independence between geometric measures (Meijer et al., 2011; Meijer et al., 2010; Niemeyer et al., 2012). The shape model vastly reduces the time required to simulate inter-individual variation; additionally, it represents the 3D disc anatomy without any simplification, and the independence between PCs reflects actual independence in the dataset. The necessary data to use the shape model is provided in the supplemental digital content for this paper.
Supplementary Material
Acknowledgments
Funding was provided by National Institutes of Health grants R01AR050052 and RC1AR058450.
Footnotes
Conflict of Interest Statement
The authors have no conflicts of interest to report.
Publisher's Disclaimer: This is a PDF file of an unedited manuscript that has been accepted for publication. As a service to our customers we are providing this early version of the manuscript. The manuscript will undergo copyediting, typesetting, and review of the resulting proof before it is published in its final citable form. Please note that during the production process errors may be discovered which could affect the content, and all legal disclaimers that apply to the journal pertain.
References
- Amonoo-Kuofi HS. Morphometric changes in the heights and anteroposterior diameters of the lumbar intervertebral discs with age. Journal of Anatomy. 1991;175:159–168. [PMC free article] [PubMed] [Google Scholar]
- Battié MC, Videman T, Parent E. Lumbar disc degeneration: Epidemiology and genetic influences. Spine. 2004;29:2679–2690. doi: 10.1097/01.brs.0000146457.83240.eb. [DOI] [PubMed] [Google Scholar]
- Battié MC, Videman T, Levälahti E, Gill K, Kaprio J. Genetic and environmental effects on disc degeneration by phenotype and spinal level: a multivariate twin study. Spine. 2008;33:2801–2808. doi: 10.1097/BRS.0b013e31818043b7. [DOI] [PubMed] [Google Scholar]
- Beckstein JC, Sen S, Schaer TP, Vresilovic EJ, Elliott DM. Comparison of Animal Discs Used in Disc Research to Human Lumbar Disc. Spine. 2008;33:E166–E173. doi: 10.1097/BRS.0b013e318166e001. [DOI] [PubMed] [Google Scholar]
- Benneker LM, Heini PF, Anderson SE, Alini M, Ito K. Correlation of radiographic and MRI parameters to morphological and biochemical assessment of intervertebral disc degeneration. European Spine Journal. 2005;14:27–35. doi: 10.1007/s00586-004-0759-4. [DOI] [PMC free article] [PubMed] [Google Scholar]
- Berlemann U, Gries NC, Moore RJ. The relationship between height, shape and histological changes in early degeneration of the lower lumbar discs. European Spine Journal. 1998;7:212–217. doi: 10.1007/s005860050058. [DOI] [PMC free article] [PubMed] [Google Scholar]
- Bono CM, Khandha A, Vadapalli S, Holekamp S, Goel VK, Garfin SR. Residual sagittal motion after lumbar fusion: a finite element analysis with implications on radiographic flexion-extension criteria. Spine. 2007;32:417–422. doi: 10.1097/01.brs.0000255201.74795.20. [DOI] [PubMed] [Google Scholar]
- Boos N, Wallin A, Aebi M, Boesch C. A new magnetic resonance imaging analysis method for the measurement of disc height variations. Spine. 1996;21:563–570. doi: 10.1097/00007632-199603010-00006. [DOI] [PubMed] [Google Scholar]
- Brinckmann P, Grootenboer H. Change of disc height, radial disc bulge, and intradiscal pressure from discectomy: An in vitro investigation on human lumbar discs. Spine. 1991;16:641–646. doi: 10.1097/00007632-199106000-00008. [DOI] [PubMed] [Google Scholar]
- Campana S, Guise JA, Rillardon L, Mitton D, Skalli W. Lumbar intervertebral disc mobility: effect of disc degradation and of geometry. European Journal of Orthopaedic Surgery & Traumatology. 2007;17:533–541. [Google Scholar]
- Dahl MC, Ahrens M, Sherman JE, Martz EO. The restoration of lumbar intervertebral disc load distribution: a comparison of three nucleus replacement technologies. Spine. 2010;35:1445–1453. doi: 10.1097/BRS.0b013e3181bef192. [DOI] [PubMed] [Google Scholar]
- El-Rich M, Wagnac E, Arnoux PJ, Aubin CE. Detailed modelling of the lumbar spine for trauma applications: preliminary results. Computer Methods in Biomechanics and Biomedical Engineering. 2008;11:93–94. [Google Scholar]
- Fagan MJ, Julian S, Siddall DJ, Mohsen AM. Patient-specific spine models. Part 1: Finite element analysis of the lumbar intervertebral disc--a material sensitivity study. Journal of Engineering in Medicine. 2002;216:299–314. doi: 10.1243/09544110260216577. [DOI] [PubMed] [Google Scholar]
- Farfan HF, Huberdeau RM, Dubow HI. Lumbar intervertebral disc degeneration: the influence of geometrical features on the pattern of disc degeneration--a post mortem study. The Journal of Bone and Joint Surgery. American Volume. 1972;54:492–510. [PubMed] [Google Scholar]
- Fujiwara A, Lim TH, An HS, Tanaka N, Jeon CH, Andersson GB, Haughton VM. The effect of disc degeneration and facet joint osteoarthritis on the segmental flexibility of the lumbar spine. Spine. 2000;25:3036–3044. doi: 10.1097/00007632-200012010-00011. [DOI] [PubMed] [Google Scholar]
- Galbusera F, Schmidt H, Noailly J, Malandrino A, Lacroix D, Wilke HJ, Shirazi-Adl A. Comparison of four methods to simulate swelling in poroelastic finite element models of intervertebral discs. Journal of the Mechanical Behavior of Biomedical Materials. 2011;4:1234–1241. doi: 10.1016/j.jmbbm.2011.04.008. [DOI] [PubMed] [Google Scholar]
- Gonzalez RC, Woods RE. Digital Image Processing. 2. Prentine Hall; Upper Saddle River: 2002. [Google Scholar]
- Goto K, Tajima N, Chosa E, Totoribe K, Kuroki H, Arizumi Y, Arai T. Mechanical analysis of the lumbar vertebrae in a three-dimensional finite element method model in which intradiscal pressure in the nucleus pulposus was used to establish the model. Journal of Orthopaedic Science. 2002;7:243–246. doi: 10.1007/s007760200040. [DOI] [PubMed] [Google Scholar]
- Johnstone B, Urban JP, Roberts S, Menage J. The fluid content of the human intervertebral disc. Comparison between fluid content and swelling pressure profiles of discs removed at surgery and those taken postmortem. Spine. 1992;17:412–416. doi: 10.1097/00007632-199204000-00006. [DOI] [PubMed] [Google Scholar]
- Kalichman L. The etiology of intervertebral disc degeneration. IBMS BoneKEy. 2010;7:388–405. [Google Scholar]
- Keller TS, Spengler DM, Hansson TH. Mechanical behavior of the human lumbar spine. I. Creep analysis during static compressive loading. Journal of Orthopaedic Research. 1987;5:467–478. doi: 10.1002/jor.1100050402. [DOI] [PubMed] [Google Scholar]
- Keller TS, Colloca CJ, Harrison DE, Harrison DD, Janik TJ. Influence of spine morphology on intervertebral disc loads and stresses in asymptomatic adults: Implications for the ideal spine. The Spine Journal. 2005;5:297–309. doi: 10.1016/j.spinee.2004.10.050. [DOI] [PubMed] [Google Scholar]
- Kettler A, Wilke HJ. Review of existing grading systems for cervical or lumbar disc and facet joint degeneration. European Spine Journal. 2006;15:705–718. doi: 10.1007/s00586-005-0954-y. [DOI] [PMC free article] [PubMed] [Google Scholar]
- Kim Y. Prediction of peripheral tears in the anulus of the intervertebral disc. Spine. 2000;25:1771–1774. doi: 10.1097/00007632-200007150-00006. [DOI] [PubMed] [Google Scholar]
- Kim Y, Choi H. Analysis of the impact responses in a degenerated spinal motion segment FE model. Journal of Mechanical Science and Technology. 2009;23:19–25. [Google Scholar]
- Kim YE, Cho SY, Choi HY. Analysis of dural-sac occlusion in a lumbar spinal motion segment FE model. Journal of Musculoskeletal Research. 2001;5:243–252. [Google Scholar]
- Kwok AWL, Wang YXJ, Griffith JF, Deng M, Leung JCS, Ahuja AT, Leung PC. Morphological changes of lumbar vertebral bodies and intervertebral discs associated with decrease in bone mineral density of the spine. Spine. 2012;37:E1415–E1421. doi: 10.1097/BRS.0b013e31826f561e. [DOI] [PubMed] [Google Scholar]
- Lee CK, Kim YE, Lee CS, Hong YM, Jung JM, Goel VK. Impact response of the intervertebral disc in a finite-element model. Spine. 2000;25:2431–2439. doi: 10.1097/00007632-200010010-00003. [DOI] [PubMed] [Google Scholar]
- Luoma K, Vehmas T, Riihimäki H, Raininko R. Disc height and signal intensity of the nucleus pulposus on magnetic resonance imaging as indicators of lumbar disc degeneration. Spine. 2001;26:680–686. doi: 10.1097/00007632-200103150-00026. [DOI] [PubMed] [Google Scholar]
- Magnier C, Boiron O, Wendling-Mansuy S, Chabrand P, Deplano V. Nutrient distribution and metabolism in the intervertebral disc in the unloaded state: A parametric study. Journal of Biomechanics. 2009;42:100–108. doi: 10.1016/j.jbiomech.2008.10.034. [DOI] [PubMed] [Google Scholar]
- Malandrino A, Noailly J, Lacroix D. The Effect of Sustained Compression on Oxygen Metabolic Transport in the Intervertebral Disc Decreases with Degenerative Changes. PLoS Computational Biology. 2011;7:e1002112. doi: 10.1371/journal.pcbi.1002112. [DOI] [PMC free article] [PubMed] [Google Scholar]
- Meijer GJM, Homminga J, Hekman EEG, Veldhuizen AG, Verkerke GJ. The effect of three-dimensional geometrical changes during adolescent growth on the biomechanics of a spinal motion segment. Journal of Biomechanics. 2010;43:1590–1597. doi: 10.1016/j.jbiomech.2010.01.028. [DOI] [PubMed] [Google Scholar]
- Meijer GJM, Homminga J, Veldhuizen AG, Verkerke GJ. Influence of interpersonal geometrical variation on spinal motion segment stiffness: Implications for patient-specific modeling. Spine. 2011;36:E929–E935. doi: 10.1097/BRS.0b013e3181fd7f7f. [DOI] [PubMed] [Google Scholar]
- Milette PC, Fontaine S, Lepanto L, Cardinal E, Breton G. Differentiating lumbar disc protrusions, disc bulges, and discs with normal contour but abnormal signal intensity: Magnetic resonance imaging with discographic correlations. Spine. 1999;24:44–53. doi: 10.1097/00007632-199901010-00011. [DOI] [PubMed] [Google Scholar]
- Moon SM, Yoder JH, Wright AC, Smith LJ, Vresilovic EJ, Elliott DM. Evaluation of intervertebral disc cartilaginous endplate structure using magnetic resonance imaging. European spine journal: official publication of the European Spine Society, the European Spinal Deformity Society, and the European Section of the Cervical Spine Research Society. 2013;22:1820–1828. doi: 10.1007/s00586-013-2798-1. [DOI] [PMC free article] [PubMed] [Google Scholar]
- Morra JH, Tu Z, Apostolova LG, Green AE, Avedissian C, Madsen SK, Parikshak N, Hua X, Toga AW, Jack CR, Jr, Weiner MW, Thompson PM. Validation of a fully automated 3d hippocampal segmentation method using subjects with Alzheimer’s disease, mild cognitive impairment, and elderly controls. NeuroImage. 2008;43:59–68. doi: 10.1016/j.neuroimage.2008.07.003. [DOI] [PMC free article] [PubMed] [Google Scholar]
- Nachemson AL, Schultz AB, Berkson MH. Mechanical properties of human lumbar spine motion segments: Influence of age, sex, disc level, and degeneration. Spine. 1979;4:1–8. doi: 10.1097/00007632-197901000-00001. [DOI] [PubMed] [Google Scholar]
- Natarajan RN, Williams JR, Andersson GBJ. Modeling changes in intervertebral disc mechanics with degeneration. The Journal of Bone and Joint Surgery. 2006;88(Suppl 2):36–40. doi: 10.2106/JBJS.F.00002. American Volume. [DOI] [PubMed] [Google Scholar]
- Niemeyer F, Wilke HJ, Schmidt H. Geometry strongly influences the response of numerical models of the lumbar spine—A probabilistic finite element analysis. Journal of Biomechanics. 2012;45:1414–1423. doi: 10.1016/j.jbiomech.2012.02.021. [DOI] [PubMed] [Google Scholar]
- Niosi CA, Oxland TR. Degenerative mechanics of the lumbar spine. The Spine Journal. 2004;4:S202–S208. doi: 10.1016/j.spinee.2004.07.013. [DOI] [PubMed] [Google Scholar]
- O’Connell GD, Vresilovic EJ, Elliott DM. Comparison of Animals Used in Disc Research to Human Lumbar Disc Geometry. Spine. 2007;32:328–333. doi: 10.1097/01.brs.0000253961.40910.c1. [DOI] [PubMed] [Google Scholar]
- Panjabi MM, Goel V, Oxland T, Takata K, Duranceau J, Krag M, Price M. Human lumbar vertebrae. Quantitative three-dimensional anatomy. Spine. 1992;17:299–306. doi: 10.1097/00007632-199203000-00010. [DOI] [PubMed] [Google Scholar]
- Pappou IP, Cammisa FP, Jr, Girardi FP. Correlation of end plate shape on MRI and disc degeneration in surgically treated patients with degenerative disc disease and herniated nucleus pulposus. The Spine Journal. 2007;7:32–38. doi: 10.1016/j.spinee.2006.02.029. [DOI] [PubMed] [Google Scholar]
- Petrou M, Petrou C. Image Processing: The Fundamentals. 2. Wiley; New York: 2010. [Google Scholar]
- Pfirrmann CW, Metzdorf A, Zanetti M, Hodler J, Boos N. Magnetic resonance classification of lumbar intervertebral disc degeneration. Spine. 2001;26:1873–1878. doi: 10.1097/00007632-200109010-00011. [DOI] [PubMed] [Google Scholar]
- Pfirrmann CWA, Metzdorf A, Elfering A, Hodler J, Boos N. Effect of aging and degeneration on disc volume and shape: A quantitative study in asymptomatic volunteers. Journal of Orthopaedic Research. 2006;24:1086–1094. doi: 10.1002/jor.20113. [DOI] [PubMed] [Google Scholar]
- Porter RW, Adams MA, Hutton WC. Physical activity and the strength of the lumbar spine. Spine. 1989;14:201–203. doi: 10.1097/00007632-198902000-00009. [DOI] [PubMed] [Google Scholar]
- Rohlmann A, Zander T, Schmidt H, Wilke HJ, Bergmann G. Analysis of the influence of disc degeneration on the mechanical behaviour of a lumbar motion segment using the finite element method. Journal of Biomechanics. 2006;39:2484–2490. doi: 10.1016/j.jbiomech.2005.07.026. [DOI] [PubMed] [Google Scholar]
- Rundell SA, Guerin HL, Auerbach JD, Kurtz SM. Effect of nucleus replacement device properties on lumbar spine mechanics. Spine. 2009;34:2022–2032. doi: 10.1097/BRS.0b013e3181af1d5a. [DOI] [PubMed] [Google Scholar]
- Schmidt H, Galbusera F, Rohlmann A, Shirazi-Adl A. What have we learned from finite element model studies of lumbar intervertebral discs in the past four decades? Journal of Biomechanics. 2013;46:2342–2355. doi: 10.1016/j.jbiomech.2013.07.014. [DOI] [PubMed] [Google Scholar]
- Schroeder Y, Wilson W, Huyghe JM, Baaijens FPT. Osmoviscoelastic finite element model of the intervertebral disc. European Spine Journal. 2006;15:361–371. doi: 10.1007/s00586-006-0110-3. [DOI] [PMC free article] [PubMed] [Google Scholar]
- Schroeder Y, Sivan S, Wilson W, Merkher Y, Huyghe JM, Maroudas A, Baaijens FPT. Are disc pressure, stress, and osmolarity affected by intra- and extrafibrillar fluid exchange? Journal of Orthopaedic Research. 2007;25:1317–1324. doi: 10.1002/jor.20443. [DOI] [PubMed] [Google Scholar]
- Schroeder Y, Huyghe JM, van Donkelaar CC, Ito K. A biochemical/biophysical 3D FE intervertebral disc model. Biomechanics and Modeling in Mechanobiology. 2010;9:641–650. doi: 10.1007/s10237-010-0203-0. [DOI] [PubMed] [Google Scholar]
- Showalter BL, Beckstein JC, Martin JT, Beattie EE, Orías AAE, Schaer TP, Vresilovic EJ, Elliott DM. Comparison of animal discs used in disc research to human lumbar disc: Torsion mechanics and collagen content. Spine. 2012;37:E900–E907. doi: 10.1097/BRS.0b013e31824d911c. [DOI] [PMC free article] [PubMed] [Google Scholar]
- Smit TH. The Mechanical Significance of the Trabecular Bone Architecture in a Human Vertebra. Shaker Verlag; 1996. p. 127. [Google Scholar]
- Soukane DM, Shirazi-Adl A, Urban JPG. Computation of coupled diffusion of oxygen, glucose and lactic acid in an intervertebral disc. Journal of Biomechanics. 2007;40:2645–2654. doi: 10.1016/j.jbiomech.2007.01.003. [DOI] [PubMed] [Google Scholar]
- Tsai A, Yezzi A, Jr, Wells W, Tempany C, Tucker D, Fan A, Grimson WE, Willsky A. A shape-based approach to the segmentation of medical imagery using level sets. IEEE Transactions on Medical Imaging. 2003;22:137–154. doi: 10.1109/TMI.2002.808355. [DOI] [PubMed] [Google Scholar]
- Videman T, Battié MC, Gill K, Manninen H, Gibbons LE, Fisher LD. Magnetic resonance imaging findings and their relationships in the thoracic and lumbar spine. Insights into the etiopathogenesis of spinal degeneration. Spine. 1995;20:928–935. doi: 10.1097/00007632-199504150-00009. [DOI] [PubMed] [Google Scholar]
- Videman T, Battié MC, Ripatti S, Gill K, Manninen H, Kaprio J. Determinants of the progression in lumbar degeneration: a 5-year follow-up study of adult male monozygotic twins. Spine. 2006;31:671–678. doi: 10.1097/01.brs.0000202558.86309.ea. [DOI] [PubMed] [Google Scholar]
- Videman T, Levälahti E, Battié MC. The effects of anthropometrics, lifting strength, and physical activities in disc degeneration. Spine. 2007;32:1406–1413. doi: 10.1097/BRS.0b013e31806011fa. [DOI] [PubMed] [Google Scholar]
- Videman T, Battié MC, Parent E, Gibbons LE, Vainio P, Kaprio J. Progression and Determinants of Quantitative Magnetic Resonance Imaging Measures of Lumbar Disc Degeneration. Spine. 2008;33:1484–1490. doi: 10.1097/BRS.0b013e3181753bb1. [DOI] [PubMed] [Google Scholar]
- Xie J, Jiang Y, Tsui H. Segmentation of kidney from ultrasound images based on texture and shape priors. IEEE Transactions on Medical Imaging. 2005;24:45–57. doi: 10.1109/tmi.2004.837792. [DOI] [PubMed] [Google Scholar]
- Yan JZ, Qiu GX, Wu ZH, Wang XS, Xing ZJ. Finite element analysis in adjacent segment degeneration after lumbar fusion. The International Journal of Medical Robotics and Computer Assisted Surgery. 2011;7:96–100. doi: 10.1002/rcs.374. [DOI] [PubMed] [Google Scholar]
- Yang J. 3D image segmentation of deformable objects with joint shape-intensity prior models using level sets. Medical Image Analysis. 2004;8:285–294. doi: 10.1016/j.media.2004.06.008. [DOI] [PMC free article] [PubMed] [Google Scholar]
- Yates JP, Giangregorio L, McGill SM. The influence of intervertebral disc shape on the pathway of posterior/posterolateral partial herniation. Spine. 2010;35:734–739. doi: 10.1097/BRS.0b013e3181ba3a60. [DOI] [PubMed] [Google Scholar]
- Yushkevich PA, Piven J, Hazlett HC, Smith RG, Ho S, Gee JC, Gerig G. User-guided 3D active contour segmentation of anatomical structures: Significantly improved efficiency and reliability. NeuroImage. 2006;31:1116–1128. doi: 10.1016/j.neuroimage.2006.01.015. [DOI] [PubMed] [Google Scholar]
- Zhu Q, Jackson AR, Gu WY. Cell viability in intervertebral disc under various nutritional and dynamic loading conditions: 3d Finite element analysis. Journal of Biomechanics. 2012;45:2769–2777. doi: 10.1016/j.jbiomech.2012.08.044. [DOI] [PMC free article] [PubMed] [Google Scholar]
Associated Data
This section collects any data citations, data availability statements, or supplementary materials included in this article.


