

Significance
To make sense of protein sequences, they need to be compared with each other. It is common to make a multiple sequence alignment where gaps are inserted to line up homologous residues in columns. Automatic methods such as Clustal, Muscle, or Mafft have been widely used since the 1980s but have difficulty in making alignments of much more than a few thousand sequences. This is mainly due to the time required to calculate what is called the guide tree, a clustering of the sequences that is used to guide the multiple alignment. We have discovered that if you use simple chained guide trees, you can increase the accuracy of alignments and, in principle, make alignments of any size.
Keywords: Clustal, Mafft, Muscle, PFAM
Abstract
Guide trees are used to decide the order of sequence alignment in the progressive multiple sequence alignment heuristic. These guide trees are often the limiting factor in making large alignments, and considerable effort has been expended over the years in making these quickly or accurately. In this article we show that, at least for protein families with large numbers of sequences that can be benchmarked with known structures, simple chained guide trees give the most accurate alignments. These also happen to be the fastest and simplest guide trees to construct, computationally. Such guide trees have a striking effect on the accuracy of alignments produced by some of the most widely used alignment packages. There is a marked increase in accuracy and a marked decrease in computational time, once the number of sequences goes much above a few hundred. This is true, even if the order of sequences in the guide tree is random.
The generation of a multiple sequence alignment (MSA) is standard practice during most comparative analyses of homologous genes or proteins. Since the mid-1980s, most automated MSAs have been made using a heuristic approach that Feng and Doolittle (1) called “progressive alignment.” This involves clustering the sequences into a tree or dendrogram-like structure, called a “guide tree” in Higgins et al. (2). This guide tree is then used to align the sequences into progressively larger and larger alignments, following the branching order in the tree. Variations on the method were described by various groups in the 1980s [e.g., Taylor (3) and Barton and Sternberg (4)], but the earliest clear description of the approach is from Hogeweg and Hesper (5). Progressive alignment is a heuristic approach and is not guaranteed to find the best possible alignment for any given scoring scheme. It does, however, allow alignments of many sequences to be made quickly, even on personal computers (6). The quality of the alignments is good enough for the alignments to be used automatically in many analysis pipelines.
The computational complexity of the alignment process, once a guide tree is created, is approximately for N sequences of the same length. The creation of the guide tree involves comparing all N sequences to each other to generate a distance matrix, which is clearly going to require time and computer memory. Once the distance matrix is made, it will require a further clustering step that is usually but can be more expensive. For large N, the construction of the guide tree becomes limiting and prevents the routine alignment of more than a few thousand sequences. Over the years, various attempts have been made to get around this problem. One solution is to quickly make a crude guide tree initially and to iterate that from an initial MSA. This approach is adopted in the widely used Muscle (7) and Mafft (8) packages. Barton and Sternberg were the first authors to use iteration, but they used a simple “chained” guide tree topology, effectively aligning the sequences one at a time to a growing MSA. Taylor (9) also used chained guide trees to make very large alignments of over 6,000 sequences. PartTree (10) groups the sequences quickly into clusters and then clusters the clusters, allowing very large guide trees to be made but at the expense of some accuracy, compared with the default Mafft program on which it is based. Clustal Omega (11) uses the mBed algorithm (12) to cluster the sequences on the basis of a small number of “seed” sequences. For N sequences, S seeds are used where S is typically proportional to . Clustering then takes steps, which is equivalent to .
Most of these methods rely on the importance of creating a “good” guide tree with a topology that closely resembles a phylogenetic tree of the sequences. Few papers, however, have systematically tested major variations in guide tree topology to measure the effects on MSA quality. Nelesen et al. (13) looked at some variations in the algorithm used to generate the tree and concluded that there was little influence on the final MSA quality. Wheeler and Kececiogolo (14) compared algorithms and found a minimum spanning tree to give good results. In the phylogenetic tree reconstruction literature, there seems to be a consensus that the guide tree topology should resemble the true phylogeny of the sequences as much as possible (15).
In this article, we looked in detail at the effect of guide tree topology on the quality of protein sequence MSAs, where we can measure the quality of the alignments empirically using protein structure-based benchmarks. We attempted to measure the actual decrease in performance when using trees with greatly simplified or even random topologies. What we found was very surprising in that, for large numbers of sequences (e.g., of the order of thousands or more), the guide trees that gave the best alignments had completely chained topologies. These had significantly better alignment scores than “balanced” trees, where the topology was either (i) random, (ii) optimized, or (iii) the default topology produced by the aligners. Examples of completely chained, perfectly balanced, partly chained, and a default guide tree are given in Fig. 1. The accuracy was the same, regardless of whether the chained trees were optimized or had completely random ordering.
Fig. 1.
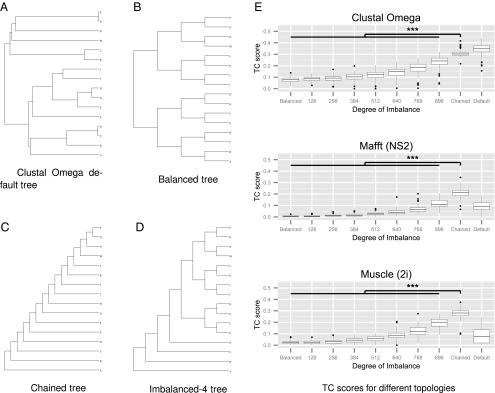
(A) Default guide tree produced by Clustal Omega for a sample of 16 sequences. (B) Balanced and (C) chained guide trees created by a utility program for these same sequences. (D) A guide tree with an intermediate level of chaining created by “chaining” four sequences “to the side” of the balanced guide tree. (E) TC scores for 1,024 Cytochrome P450 sequences with different guide trees, ranging from perfectly balanced to fully chained (all randomly ordered) Clustal Omega, Mafft (FFT-NS-2 algorithm), and Muscle (two iterations). The TC scores obtained with the default guide trees are shown on the right for reference (***P < 0.001, 100 samples).
This is a remarkable result that turns 30 y of research on progressive alignment on its head and that has some very clear and simple implications for the developers of alignment packages or alignment databases, such as Pfam (16). If you wish to make alignments of very large numbers of protein sequences using a progressive alignment method, the ideal algorithm may be to simply add the sequences one at a time, in any order, to a growing alignment. Doing this gives a clear and immediate jump in accuracy with Clustal Omega, Muscle, and Mafft alignments of many sequences. The guide trees are now almost instant to create, and no iterations are needed to refine their topology.
Results
This article examines how different guide tree topologies affect the quality of alignments produced by Clustal Omega, Mafft, and Muscle. These programs were selected based on their widespread use, their ability to process an externally defined guide tree, and their ability to align more than a thousand protein sequences.
Initial Analysis.
In an initial exploratory analysis, we used the Cytochrome P450 protein family as it has a large number of homologous sequences available in Pfam (Pfam accession no. PF00067), and there are 12 sequences with known 3D structures. We used the structure-based alignment of these 12 sequences from HOMSTRAD as a reference and looked at the effect on alignment quality of aligning large numbers of Cytochrome P450 sequences from Pfam, when these 12 were included (17). We measured the proportion of correctly aligned columns out of all aligned columns in the reference sequences [Total Column (TC) score] of the 12 sequences, embedded in the larger datasets. This type of analysis is widely used and is the basis of the HomFam alignment benchmark system (12).
For the first analysis, we selected random sets of 1012 Cytochrome P450 sequences from the 21,001 available in Pfam; added them to the 12 with known structures to make up 1,024 sequences, a power of 2 being necessary to create a perfectly balanced tree; and shuffled the sequence order. The datasets were used to create a series of guide trees ranging from perfectly balanced through increasing levels of chaining to fully chained guide trees. These trees all have random allocation of sequences to the tips. The sequences were aligned using these guide trees, and the quality of the resulting alignments measured using their BAliSCORE TC score (18). These steps were repeated, and the results are shown in Fig. 1. There is a clear and simple trend of increasing accuracy going from the balanced to the completely chained guide trees. In the case of Clustal Omega, the random chained trees produce alignments that are slightly worse than those produced by the default Clustal Omega guide trees. With Mafft and Muscle, the chained trees are considerably better than the default ones, but this effect is test case specific, and these programs normally use iterations to improve the guide tree. It is not so surprising that a balanced guide tree with randomly placed sequences will do badly, but it is surprising that equally random but perfectly chained trees do so well. To test if this effect is specific to this test case, we repeated this experiment across all of the BAliBASE 3 benchmark test set (19).
BAliBASE.
The BAliBASE database consists of a number of reference sets, each containing a number of test alignments. For each alignment, randomly ordered balanced and chained guide trees were created. As most test cases have only a relatively small number of sequences, it was not feasible to create guide trees with intermediate levels of chaining. In addition, the balanced trees were as close to perfectly balanced as possible given the number of sequences available. The guide trees were again used to align the sequences and the quality of the alignments measured using the bali_score program. The mean quality score was calculated for each family from repeated sampling (the trees have random orderings and so need sampling), and the results are shown in Fig. 2. As before, for all reference sets and alignment programs, chained trees gave significantly higher quality alignments than balanced trees. In most scenarios, the default guide trees gave the best quality alignments. However, the BAliBASE families are quite small, with the largest having 142 sequences, and the effects of chaining only become apparent with larger numbers of sequences.
Fig. 2.
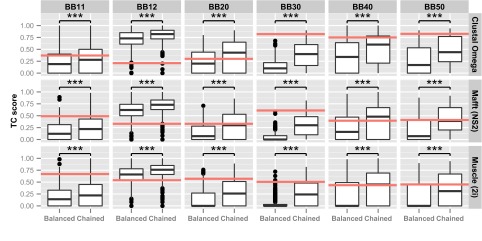
Average TC scores for BAliBASE reference sets. The alignments were created with randomly ordered balanced and chained guide trees. The red line indicated the median TC score for Clustal Omega, Mafft (FFT-NS-2 algorithm), and Muscle (two iterations) using default guide trees (***P < 0.001, 100 samples).
Larger Datasets.
For the next comparisons, we examined the effects of guide tree topology on very large alignments. Here we compared nonrandom (optimized) balanced trees and random chained trees and also compared the default guide trees from each aligner. We did this for different numbers of sequences ranging from 16 up to over 32,000. In a previous paper (20), we had noticed that alignment quality tends to drop off for all progressive alignment methods, once the number of sequences increases much beyond a thousand or so. Given the huge alignments and the need to make replicates, we used the relatively short short-chain dehydrogenases/reductases sequence family, which has 13 cases with known 3D structure and over 50,000 sequences in Pfam (Pfam accession no. PF00106). Datasets of between 16 and 32,768 sequences were created from the 13 reference sequences of known structure and a random selection from the 50,144 other sequences from Pfam. These sequences were aligned using the default guide trees, optimized balanced guide trees, and random chained guide trees. The TC scores for the different topologies are shown in Fig. 3, and additional details are given in Figs. S1–S3 for the short-chain dehydrogenases/reductases, Cytochrome P450, and zinc finger (Pfam accession no. PF00096, HOMSTRAD zf-CCHH) families, respectively. Although the actual TC scores are different in each set of results, the overall pattern is the same for all aligners and for the three protein families.
Fig. 3.

TC scores for increasing numbers of short-chain dehydrogenases/reductases sequences for Clustal Omega, Mafft (FFT-NS-2 algorithm), and Muscle (two iterations) with default, optimal balanced, and random chained guide trees, with fitted Loess curves. The order for the balanced guide trees determined by TSP Minimization, and the chained guide trees were randomly ordered (100 samples per dataset, except 25 samples for the largest Clustal datasets).
In all cases, the quality scores for the default guide trees fall off as the number of sequences increases, as was found in ref. 20. For chained trees, however, the quality scores fall off much more slowly than for either default or balanced trees. Once you go above a few hundred sequences, you get much better alignments, using completely random, simple chained guide trees. These differences are highly significant when tested statistically, and the pattern is the same, almost regardless of the alignment program used. In the Supporting Information figures, we also include results for optimized, as well as random, chained trees. With Clustal Omega, once you go up to 8,000 sequences with the Cytochrome P450 test case, optimized chained trees give better alignments than random ones. However, with other alignment programs, on this test case, and across all test cases, on average, the pattern holds true.
In a further experiment, shown in Fig. S4, 5% of the sequences in the datasets were replaced with sequences from a different family to represent outliers. Although the trends are not as clear as the results shown above, the effects of chaining are still apparent for larger alignments.
Small Models.
At the other end of the scale from the large alignments in the previous section, we tested small alignments of just four sequences. Simple test cases were created with four randomly selected and ordered Cytochrome P450 reference sequences with known structure. Randomly ordered balanced and chained guide trees were created. The sequences were aligned using these guide trees, and the TC scores calculated for the resulting alignments. The TC scores are higher with the small chained trees than with the balanced ones, as shown in Fig. 4. Although the differences in TC scores are quite small, they are nonetheless significant when compared pairwise, even with such small datasets. The only difference between both scenarios is the number of steps where two unaligned sequences are aligned with each other. With balanced trees, this happens twice; with chained ones, only once. These alignments of unaligned sequences are where alignment errors are most likely to happen, and the chained trees have fewer of them.
Fig. 4.

TC scores for four randomly selected and ordered Cytochrome P450 reference sequences for Clustal Omega, Mafft (FFT-NS-2 algorithm), and Muscle (two iterations) with balanced and chained guide trees (***P < 0.001, 100 samples).
HomFam.
Finally, we wished to test whether the effects seen in the large short-chain dehydrogenases/reductases tests of thousands of sequences were seen across all HomFam families. These are the single-domain Pfam families that have at least five members with known structures in a HOMSTRAD structural alignment. Given the numbers and size of the families, only random chained trees were compared with the default guide trees from each aligner. Datasets were limited to 1,024, 2,048, and 4,096 sequences per family, and only families with at least 4,096 sequences were included in the experiment. All reference sequences were included in a family’s dataset, with the remainder of sequences being selected at random to make up the desired numbers. Each aligner was run using both its default guide tree and a random chained tree and the TC scores for the alignments produced compared with α = 0.01. The results are given in Fig. 5.
Fig. 5.

Comparison of TC scores obtained for Clustal Omega, Mafft (FFT-NS-2 algorithm), and Muscle (two iterations) with default and randomly chained guide trees for different dataset sizes across all 41 HomFam families that have at least 4,096 sequences. For each family, the TC scores obtained with default and random chained guide trees were compared (α = 0.01, 50 samples per family).
In general, as the number of sequences increases, there is a corresponding increase in the number of families where the TC score obtained with random chained trees is significantly higher than the default TC scores. Interestingly, even with a relatively low α of 0.01, the results show few families where there is no discernible difference between the default and chained guide trees.
Discussion
There are some immediate and surprising side effects from the discovery that simple guide trees do so well on protein structure-based benchmarks. The most obvious is the enormous simplifying effect that chained trees have on the performance of some of the most widely used packages for making large protein alignments. The effects on Mafft and Muscle are striking. With chained trees, you get a large and immediate increase in accuracy. This is accompanied by a potentially huge reduction in computational complexity, especially for large numbers of sequences (see Fig. S5 for computing times). No iterations are needed, and the initial trees can be constructed in trivial amounts of time and memory. The time to make an MSA, once a guide tree is made, is the same with Muscle, regardless of the tree topology. With Mafft, chained trees are slower to use than balanced ones, so it is more of a tradeoff. With Clustal Omega, there is a clear increase in accuracy but at the cost of a considerable rise in the time to compute the alignments. The initial guide trees in Clustal Omega are usually created using mBed, which is very fast and has complexity, so the saving in time at the guide tree construction phase is modest. Once a guide tree is constructed, the alignment times with chained trees are much longer than with balanced ones. The increase in complexity comes from the way Clustal Omega aligns hidden Markov models (HMMs) during the progressive stage and is something that the developers of that package will attempt to modify as soon as possible, to exploit the other benefits of chained guide trees.
We were unable to test these guide tree topology effects on Kalign (21) due to an inability of Kalign to accept external guide trees. However, we have noticed that Kalign is one of the few packages, like the ones tested in this article, that can align very large numbers of sequences. We also noticed that Kalign does very well on various benchmark studies that we have run, where we explicitly test the quality of MSAs of large numbers of protein sequences. We did a systematic analysis of guide trees used by Kalign to align the sequences in our HomFam test set (Fig. S6). These trees range from being moderately to extremely chained in topology, especially with short sequence lengths. This seems to derive from the use of the Muth–Manber (22) alignment metric for quickly measuring the similarity of unaligned sequences. For short sequences, this gives a score of either 0 or 1 in many cases. A distance matrix that has mainly 0s and 1s will produce highly chained guide trees. According to our results, this may in fact be one of the reasons why the alignments from Kalign appear to be so good.
The Pfam database (16) consists of collections of protein sequence domains, arranged into protein families, with accompanying HMMs and MSAs. It was never a stated aim of the developers of Pfam to produce high-quality alignments. What were assumed to be low-quality MSAs seemed able to produce HMMs for sequence searching that were just as useful as ones from more involved alignments (23). The large alignments in Pfam are therefore produced by a method that is intended to be simple and effective rather than intensive. This includes, effectively, building up the HMMs using chained guide trees. Sequences are added to a growing alignment by aligning them in turn to an HMM derived from a core “seed alignment.” We have tested the large full alignments in some Pfam families using a benchmark based on protein structures and have found the alignments to be remarkably good. It is quite possible that the supposedly simplistic algorithm that is used to create the large Pfam alignments is the optimal way to do this, given the time constraints involved in doing this for all protein domains.
A key question remains as to why chained trees do so well with large numbers of sequences. The simple four-sequence example in Fig. 4 gives a possible clue. Here, there is a tiny but significant improvement in accuracy using chained versus balanced trees. When scaled up to hundreds of sequences, this effect is amplified. Completely chained guide trees mean you only align a pair of unaligned sequences once. These are potentially the least accurate alignments in the entire procedure, especially if the pair of sequences cluster deep in the tree. All of the other alignments involve aligning a sequence against a profile of already aligned sequences. These latter alignments are potentially more accurate.
We have found completely chained guide trees to work very well for making large alignments of single domain proteins, when we can benchmark these using protein structure based alignments. We do realize that this result may not hold up when viewed from a strictly phylogenetic perspective or if the main aim is to infer the precise positions of gaps in the alignment (24). There is a problem in the field when trying to reconcile the apparently conflicting results that you get from benchmarks based on evolutionary models and simulations versus those based on 3D structures of proteins (25). This can only be resolved by further work and by further use of a variety of realistic test systems and benchmarks for sequence alignments.
Materials and Methods
The default versions of all three aligners were used, with runtime parameters limited to those required to specify the input guide trees. For Mafft, the FFT-NS-2 algorithm was used for all datasets. This is the method used by the controlling MAFFT program when the auto flag is not used. The latter is used to choose automatically between a standard progressive or consistency-based aligner based on the number and length of the sequences—the FFT-NS-2 progressive alignment algorithm is the default when no alignment flag is specified. The newick2mafft.rb ruby script, available from the Mafft website, was used to convert all externally generated guide trees into Mafft format. With Muscle, the number of iterations was limited to two rather than the default of 16. This is the number of iterations recommended by the authors, with large datasets. Attempts at running Muscle with the default number of 16 iterations resulted in prohibitive run times and had to be abandoned.
Balanced, chained, and guide trees with intermediate levels of chaining, examples of which are given in Fig. 1, were created using a separate utility program. Branch lengths are ignored in Clustal Omega and Muscle, and the –unweight option is used in Mafft.
The program versions and runtime arguments used are as follows: Clustal Omega (v1.2.0), –guidetree-in=…; Mafft (v7.029b), –anysymbol –treein … –unweight; Muscle (v3.8.31), -usetree_nowarn … -maxiter 2; and Kalign (v2.04): -printtree … -q.
A package of utility programs (including those used to create the guide trees), data files, and scripts is available for download from www.bioinf.ucd.ie/download/PNAS2014ChainedTrees.tar.gz.
The following different sequence orders/optimizations were used.
Random.
Sequences were selected at random from the HomFam family, combined with the reference sequences, and the full set of sequences randomly shuffled.
TSP Minimum.
The standard Traveling Salesman Problem (TSP) algorithm using simulated annealing, excluding the distance from the last point back to the starting position, was used to produce an ordered list of sequences with a global minimum distance between the sequences. The distances are obtained from the full distance matrix produced by Clustal Omega.
Greedy Neighbor Minimum.
An input sequence was selected at random. The sequence closest or most similar to the sequence just picked is selected, using the distances from Clustal Omega’s full distance matrix. The process is repeated until all sequences have been selected, thus producing a local distance minimization ordered list of sequences.
TSP Maximum.
TSP Maximum is similar to the TSP Minimum approach, but this produces an ordered list of sequences that maximizes the global distance between the sequences.
All statistical analyses comparing actual TC scores used the nonparametric one-tailed paired Wilcoxon signed-rank test.
Supplementary Material
Acknowledgments
The authors thank Markus Schröder for technical assistance. This work was funded by Science Foundation Ireland Grant 11/PI/1034.
Footnotes
The authors declare no conflict of interest.
This article is a PNAS Direct Submission.
This article contains supporting information online at www.pnas.org/lookup/suppl/doi:10.1073/pnas.1405628111/-/DCSupplemental.
References
- 1.Feng DF, Doolittle RF. Progressive sequence alignment as a prerequisite to correct phylogenetic trees. J Mol Evol. 1987;25(4):351–360. doi: 10.1007/BF02603120. [DOI] [PubMed] [Google Scholar]
- 2.Higgins DG, Bleasby AJ, Fuchs R. CLUSTAL V: Improved software for multiple sequence alignment. Comput Appl Biosci. 1992;8(2):189–191. doi: 10.1093/bioinformatics/8.2.189. [DOI] [PubMed] [Google Scholar]
- 3.Taylor WR. A flexible method to align large numbers of biological sequences. J Mol Evol. 1988;28(1-2):161–169. doi: 10.1007/BF02143508. [DOI] [PubMed] [Google Scholar]
- 4.Barton GJ, Sternberg MJE. A strategy for the rapid multiple alignment of protein sequences. Confidence levels from tertiary structure comparisons. J Mol Biol. 1987;198(2):327–337. doi: 10.1016/0022-2836(87)90316-0. [DOI] [PubMed] [Google Scholar]
- 5.Hogeweg P, Hesper B. The alignment of sets of sequences and the construction of phyletic trees: An integrated method. J Mol Evol. 1984;20(2):175–186. doi: 10.1007/BF02257378. [DOI] [PubMed] [Google Scholar]
- 6.Higgins DG, Sharp PM. CLUSTAL: A package for performing multiple sequence alignment on a microcomputer. Gene. 1988;73(1):237–244. doi: 10.1016/0378-1119(88)90330-7. [DOI] [PubMed] [Google Scholar]
- 7.Edgar RC. MUSCLE: Multiple sequence alignment with high accuracy and high throughput. Nucleic Acids Res. 2004;32(5):1792–1797. doi: 10.1093/nar/gkh340. [DOI] [PMC free article] [PubMed] [Google Scholar]
- 8.Katoh K, Misawa K, Kuma K, Miyata T. MAFFT: A novel method for rapid multiple sequence alignment based on fast Fourier transform. Nucleic Acids Res. 2002;30(14):3059–3066. doi: 10.1093/nar/gkf436. [DOI] [PMC free article] [PubMed] [Google Scholar]
- 9.Taylor WR. Hierarchical method to align large numbers of biological sequences. Methods Enzymol. 1990;183:456–474. doi: 10.1016/0076-6879(90)83031-4. [DOI] [PubMed] [Google Scholar]
- 10.Katoh K, Toh H. PartTree: An algorithm to build an approximate tree from a large number of unaligned sequences. Bioinformatics. 2007;23(3):372–374. doi: 10.1093/bioinformatics/btl592. [DOI] [PubMed] [Google Scholar]
- 11.Sievers F, et al. Fast, scalable generation of high-quality protein multiple sequence alignments using Clustal Omega. Mol Syst Biol. 2011;7:539. doi: 10.1038/msb.2011.75. [DOI] [PMC free article] [PubMed] [Google Scholar]
- 12.Blackshields G, Sievers F, Shi W, Wilm A, Higgins DG. Sequence embedding for fast construction of guide trees for multiple sequence alignment. Algorithms Mol Biol. 2010;5:21–30. doi: 10.1186/1748-7188-5-21. [DOI] [PMC free article] [PubMed] [Google Scholar]
- 13.Nelesen S, Liu K, Zhao D, Linder CR, Warnow T. The effect of the guide tree on multiple sequence alignments and subsequent phylogenetic analysis. Pacific Symposium on Biocomputing. 2008;13(2008):25–36. doi: 10.1142/9789812776136_0004. [DOI] [PubMed] [Google Scholar]
- 14.Wheeler TJ, Kececioglu JD. Multiple alignment by aligning alignments. Bioinformatics. 2007;23(13):i559–i568. doi: 10.1093/bioinformatics/btm226. [DOI] [PubMed] [Google Scholar]
- 15.Martin W, Roettger M, Lockhart PJ. A reality check for alignments and trees. Trends Genet. 2007;23(10):478–480. doi: 10.1016/j.tig.2007.08.007. [DOI] [PubMed] [Google Scholar]
- 16.Sonnhammer ELL, Eddy SR, Durbin R. Pfam: A comprehensive database of protein domain families based on seed alignments, Proteins. Structure, Function, and Bioinformatics. 1997;28(3):405–420. doi: 10.1002/(sici)1097-0134(199707)28:3<405::aid-prot10>3.0.co;2-l. [DOI] [PubMed] [Google Scholar]
- 17.Mizuguchi K, Deane CM, Blundell TL, Overington JP. HOMSTRAD: A database of protein structure alignments for homologous families. Protein Sci. 1998;7(11):2469–2471. doi: 10.1002/pro.5560071126. [DOI] [PMC free article] [PubMed] [Google Scholar]
- 18.Thompson JD, Plewniak F, Poch O. BAliBASE: A benchmark alignment database for the evaluation of multiple alignment programs. Bioinformatics. 1999;15(1):87–88. doi: 10.1093/bioinformatics/15.1.87. [DOI] [PubMed] [Google Scholar]
- 19.Thompson JD, Koehl P, Ripp R, Poch O. BAliBASE 3.0: Latest developments of the multiple sequence alignment benchmark, Proteins. Structure, Function, and Bioinformatics. 2005;61(1):127–136. doi: 10.1002/prot.20527. [DOI] [PubMed] [Google Scholar]
- 20.Sievers F, Dineen D, Wilm A, Higgins DG. Making automated multiple alignments of very large numbers of protein sequences. Bioinformatics. 2013;29(8):989–995. doi: 10.1093/bioinformatics/btt093. [DOI] [PubMed] [Google Scholar]
- 21.Lassmann T, Frings O, Sonnhammer ELL. Kalign2: High-performance multiple alignment of protein and nucleotide sequences allowing external features. Nucleic Acids Res. 2009;37(3):858–865. doi: 10.1093/nar/gkn1006. [DOI] [PMC free article] [PubMed] [Google Scholar]
- 22.Muth R, Manber U. Approximate Multiple String Search, Combinatorial Pattern Matching. Vol 1075. Berlin: Springer; 1996. pp. 75–86. [Google Scholar]
- 23.Griffiths-Jones S, Bateman A. The use of structure information to increase alignment accuracy does not aid homologue detection with profile HMMs. Bioinformatics. 2002;18(9):1243–1249. doi: 10.1093/bioinformatics/18.9.1243. [DOI] [PubMed] [Google Scholar]
- 24.Löytynoja A, Goldman N. An algorithm for progressive multiple alignment of sequences with insertions. Proc Natl Acad Sci USA. 2005;102(30):10557–10562. doi: 10.1073/pnas.0409137102. [DOI] [PMC free article] [PubMed] [Google Scholar]
- 25.Iantorno S, Gori K, Goldman N, Gil M, Dessimoz C. In: Who Watches the Watchmen? An Appraisal of Benchmarks for Multiple Sequence Alignment in Multiple Sequence Alignment Methods. Russell DJ, editor. Vol 1079(4) Humana Press, Clifton, NJ; 2014. pp. 59–73. [DOI] [PubMed] [Google Scholar]
Associated Data
This section collects any data citations, data availability statements, or supplementary materials included in this article.