

Abstract
Objective:
To determine the correlation between left ventricular mass index and calcium metabolism in patients with essential hypertension.
Study Design:
Cross sectional case-control study.
Material and Methods:
Twenty-seven patients with essential hypertension and 20 healthy individuals were compared with respect to calciotropic hormones, left ventricular mass index (LVMI), and urinary and serum biochemical parameters. The correlations between parathormone, vitamin D, and calcitonin levels and LVMI and blood pressure elevation were determined.
Results:
The parathormone level was significantly higher (p=0.006) and vitamin D level was significantly lower (p=0.01) in the patient group compared with the control group. However, the two groups were similar in terms of albumin-corrected calcium levels, which were within the normal range (p=0.988). The serum sodium (p=0.014) and urinary calcium (p=0.003) levels and LVMI (p<0.01) were also significantly higher in the patient group. No significant correlations were determined between ambulatory blood pressure and parathormone and vitamin D levels, but a significant correlation was found between LVMI and parathormone level (p=0.06) in hypertensive patients.
Conclusion:
Essential hypertension alters calcium metabolism, causing calciuresis by hypernatremia. Parathormone release increases to compensate for this, and leads to protein synthesis, which in turn provokes the development of myocardial hypertrophy.
Keywords: Essential hypertension, left ventricular hypertrophy, calcium metabolism, parathormone
Introduction
Left ventricular hypertrophy (LVH) is an independent risk factor for cardiovascular morbidity and mortality in hypertensive patients (1–3). Even though some results regarding the relationship between hypertrophy and the severity of hypertension are contradictory, a number of studies have reported that the prevalence of hypertrophy increases with the severity of hypertension (4, 5).
Essential hypertension is a multifactorial condition affecting a large percentage of the adult Turkish population (33.7%) (6). It induces LVH and dilatation, which can lead to heart failure (7, 8). The reasons for the development of LVH in patients with essential hypertension have not been established, and whether or not LVH results from long-term blood pressure (BP) elevation or non-hemodynamic factors affecting the myocardium is still a matter of debate (4, 9, 10).
Disturbances in calcium metabolism due to an increase in urinary calcium excretion have been observed in patients with essential hypertension. Thus, it has been suggested that there might be a relationship between calcium metabolism and myocardial hypertrophy (9). Parathormone (PTH) and vitamin D are the major calcitropic hormones, and the levels of these two hormones have been reported to vary in patients with essential hypertension (11). In several studies, a relationship between hyperparathyroidism with LVH and BP elevation has been demonstrated in hypertensive patients (1, 12–14). However, whether the increase in PTH level is the result of or the reason for the BP elevation has not been elucidated (15). In addition, it has been reported that PTH increases cytosolic free calcium, and this might cause myocardial hypertrophy through biochemical mechanisms (16). Vitamin D increases the calcium level in myocytes as well, and subsequently cardiac contractility increases and affects the PTH level through receptor binding mechanisms (11).
The purpose of the present study was to determine the relationship between calcium metabolism and hypertension by comparing healthy individuals and patients newly diagnosed with mild and moderate essential hypertension, and to elucidate the role of non-hemodynamic factors in the development of LVH in the hypertensive group.
Material and Methods
Study population
Twenty-seven patients, diagnosed with hypertension for the first time, in the 2nd Clinic of Internal Medicine of Okmeydanı Training and Research Hospital, and 20 healthy individuals were included in the study. Criteria for exclusion from the study included secondary hypertension based on medical history and physical and laboratory findings performed according to the criteria of the World Health Organization and Joint National Committee, cardiovascular diseases that could cause LVH, and diabetes mellitus, liver, or kidney diseases (17).
Written informed consent was obtained from each subject following a detailed explanation of the objectives and protocol of the study which was conducted in accordance with the ethical principles stated in the “Declaration of Helsinki” and approved by the institutional ethics committee.
Biochemical analysis
Blood samples were obtained from all patients at 8:30 am on the day of echocardiography and 24-hour ambulatory BP monitoring (described below), after an overnight fast, and with each patient in the supine position. Serum sodium, potassium, calcium, phosphorus, alkaline phosphatase (ALP), urea, and creatinine levels were determined by spectrophotometry (Synchron LX20; Beckman Coulter, Brea, CA, USA). Intact PTH and calcitonin were determined by radioimmunoassay (RIA), and 25-OH vitamin D and osteocalcin were measured by an RIA CT (Biosource, Bruxelles, Belgium) and Metra Osteocalcin Elisa Kit, respectively. In the 24-hour urine sample, creatinine, calcium, phosphorus, and hydroxyproline levels were measured by the Jaffe method, ion-selective electrode method, colorimetric analysis, and spectrophotometry, respectively.
Measurement of arterial blood pressure
Blood pressure was measured with a mercury sphygmomanometer (Erkameter-3000; Erka, Bad Tölz, Germany), with the patient in the sitting position after resting for at least 10 minutes. The subjects were not allowed to smoke or drink coffee for 30 minutes prior to the measurements. The measurements were performed according to the standards described in the Sixth Report of the Joint National Committee 20). Two measurements were performed on each subject, 2-minutes apart, and the average of the two measurements was calculated. Korotkoff phase I was used for systolic BP and Korotkoff phase V was used for diastolic BP. On the following day, 24-hour ambulatory BP monitoring was performed in the hypertensive group with the use of an oscillometric device (Norav Holter Blood Pressure Monitor, NBP-24-NG; Stolberg, Germany), outside the hospital. Ambulatory BP monitoring was conducted while the patients performed their normal daily activities. Ambulatory BP levels were recorded at 30-minute intervals. The mean systolic and diastolic BP levels were then calculated from these measurements.
Echocardiographic assessment
All patients underwent echocardiographic examinations using a 2.5 MHz cardiac probe (Model SSA-270; Toshiba, Nasu, Ottowara, Japan). We measured left ventricle internal diastolic diameter, diastolic posterior wall thickness, and interventricular septum thickness (IVST). Left ventricular mass (LVM) was calculated according to Devereux’s formula (18). Body surface area was calculated using by Mosteller formula (19). Left ventricular mass index (LVMI) was calculated by dividing LVM by body surface area.
Statistical analysis
The data were analyzed using the Statistical Program for the Social Sciences (version 10.0; SPSS, Inc., Chicago, IL, USA). Quantitative data are expressed as the mean±standard deviation and comparisons were performed by unpaired Student’s t-test. Pearson’s correlation coefficient was used to assess correlations between quantitative parameters, with p<0.05 as the criterion for statistical significance.
Results
Demographics and baseline characteristics
Forty-seven individuals were enrolled in the study. The patient group consisted of 27 individuals, 63% of whom were female. In the control group, there were 20 subjects and 24% were female. The mean age was 49±6.8 years (range, 37–68 years) in the patient group and 46.2±6.37 years (range, 38–60 years) in the control group (p=0.159).
The mean systolic and diastolic BP values, as measured in the hospital, were 161.8±17.5 mm Hg (range, 140–200 mm Hg) and 95.9±10.4 mm Hg (range, 80–120 mm Hg) in the patient group, and 118±7.1 mm Hg (range, 100–130 mm Hg) and 73±7.1 mm Hg (range, 60–85 mm Hg) in the control group, respectively (patient group vs. control group: p=0.001 for both systolic and diastolic BP).
In the patient group, the mean 24-hour ambulatory systolic and diastolic BP values were 139.2±25.92 mm Hg (range, 114–226 mm Hg) and 81.2±10.05 mm Hg (range, 61–100 mm Hg), respectively.
Biochemical findings
The mean serum biochemical parameters of the patient and control groups are presented in Table 1. While the mean sodium levels were significantly higher in the patient group compared with the control group (p=0.014), no statistically significant difference was found in terms of potassium, calcium, phosphorus, ALP, urea, or creatinine levels (p>0.05). The calcitonin, osteocalcin, PTH, and vitamin D levels were evaluated in both groups. No significant differences existed between the groups with respect to the levels of calcitonin and osteocalcin (p>0.05); however, the PTH level was significantly higher (p=0.006) and the vitamin D level was significantly lower in the patient group compared with the control group (p=0.01).
Table 1.
Comparison of serum biochemical parameters in patient and control groups
| Patient Group (n=27) Mean±SD | Control Group (n=20) Mean±SD | p value | |
|---|---|---|---|
| Na (mmol/L) | 141.18±4.37 | 139.95±9.5 | 0.014 |
| K (mmol/L) | 4.20±0.34 | 4.27±0.31 | 0.492 |
| Ca (mg/dL) | 9.69±0.38 | 9.69±0.26 | 0.988 |
| P (mg/dL) | 3.09±0.48 | 2.90±0.38 | 0.147 |
| ALP (U/L) | 166.56±59.51 | 178.30±41.76 | 0.431 |
| Urea (mg/dL) | 32.22±5.92 | 34.95±6.72 | 0.147 |
| Creatinine (mg/dL) | 0.92±0.17 | 0.94±0.14 | 0.718 |
| Calcitonin (pg/mL) | 8.49±5.54 | 6.03±2.83 | 0.054 |
| Osteocalcin (ng/mL) | 10.30±8.08 | 10.21±5.25 | 0.068 |
| PTH (pg/mL) | 53.74±23.46 | 37.7±17.22 | 0.006 |
| Vitamin D (ng/mL) | 11.03±1.57 | 17.38±7.21 | 0.010 |
Na: sodium, K: potassium, Ca: calcium, P: phosphorus, ALP: alkaline phosphatase, PTH: parathormone, SD: standard deviation
Comparison of the 24-hour urine samples of the patient and control groups revealed a significantly higher urinary calcium level in the patient group (p=0.003). No statistically significant differences existed between the groups in terms of the mean urinary phosphorus, hydroxyproline, and creatinine levels (p>0.05; Table 2).
Table 2.
Comparison of biochemical parameters in 24-hour urine samples in patient and control groups
| Patient Group (n=27) Mean±SD | Control Group (n=20) Mean±SD | p value | |
|---|---|---|---|
| Urinary Ca (mg/24 h) | 275.56±82.09 | 203.50±72.00 | 0.003 |
| Urinary P (g/24 h) | 0.86±0.24 | 0.92±0.23 | 0.409 |
| OH-proline (mmol/mol creatinine) | 9.92±6.64 | 10.99±2.86 | 0.461 |
| Urinary creatinine (g/24 h) | 1.31±0.39 | 1.42±0.39 | 0.349 |
Ca: calcium, P: phosphorus, OH-proline: hydroxyproline, SD: standard deviation
Echocardiographic findings
We found high left ventricular wall thickness (LVWT) in the patient group, with significantly higher values for LVMI (110.74±14.89 g/m2 vs. 85.713±23.990 g/m2, p<0.01), IVST (1.077±0.09 cm vs. 0.785±0.1 cm, p=0.000), and posterior wall thickness (1.042±0.07 cm vs. 0.682±0.1 cm, p=0.000) in the patient group compared with the control group.
Correlation analyses
The correlations between the mean 24-hour ambulatory systolic BP (ASBP) and diastolic BP (ADBP) and the levels of PTH, vitamin D, and calcitonin were evaluated in patients with essential hypertension; however, no significant correlations were found.
The correlations between LVMI and the levels of PTH, vitamin D, and calcitonin were also evaluated. A significant correlation was determined between LVMI and PTH level (r=0.683, p=0.001; Figure 1).
Figure 1.
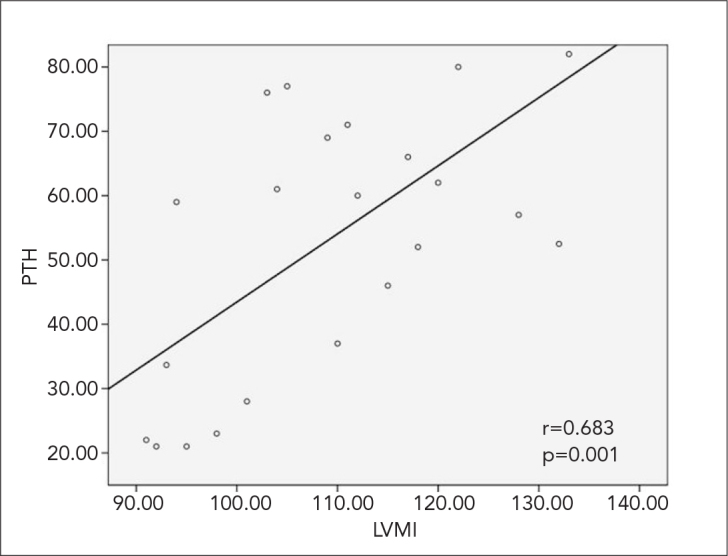
Correlation between LVMI and PTH levels in patients with essential hypertension
LVMI (g/m2): left ventricular mass index, PTH: parathormone
Left ventricular mass index was significantly correlated with PTH (r=0.683, p=0.001). Serum levels of sodium (r=0.806, r=0.700 and r=0.705, respectively; p=0.001 for each) and urinary calcium levels (r=0.580, r=0.579 and r=0.502, respectively; p=0.001 for each) were significantly and positively correlated with PTH level, ASBP, and ADBP. Vitamin D and serum calcium levels were not significantly correlated with PTH level, ASBP, or ADBP (Table 3).
Table 3.
LVMI: Left ventricular mass index, Na: Sodium, PTH: Parathormone, ASBP: 24-hour ambulatory systolic blood pressure, ADBP: 24-hour ambulatory diastolic blood pressure
| PTH | ASBP | ADBP | ||
|---|---|---|---|---|
| LVMI | r | 0.683 | 0.284 | 0.142 |
| p | 0.001 | 0.293 | 0.421 | |
| n | 27 | 27 | 27 | |
| Na | r | 0.806 | 0.700 | 0.705 |
| p | 0.001 | 0.001 | 0.001 | |
| n | 27 | 27 | 27 | |
| Vitamin D | r | −0.279 | 0.086 | 0.056 |
| p | 0.12 | 0.796 | 0.601 | |
| n | 27 | 27 | 27 | |
| Serum calcium | r | −0.299 | 0.058 | 0.002 |
| p | 0.13 | 0.774 | 0.431 | |
| n | 27 | 27 | 27 | |
| Urinary calcium | r | 0.580 | 0.579 | 0.502 |
| p | 0.001 | 0.001 | 0.001 | |
| n | 27 | 27 | 27 |
LVMI: Left ventricular mass index, Na: Sodium, PTH: Parathormone, ASBP: 24-hour ambulatory systolic blood pressure, ADBP: 24-hour ambulatory diastolic blood pressure
Discussion
The results of the present study are in agreement with those in the literature regarding calcium metabolism changes in patients with essential hypertension (11, 20). Our patients with essential hypertension had significantly higher PTH, sodium, and urinary calcium levels and significantly lower vitamin D levels than the normotensive control patients. No significant correlations were determined between ASBP/ADBP and the levels of PTH, vitamin D, and calcitonin. However, serum sodium and urinary calcium levels were determined to be positively and significantly correlated with PTH level, ASBP, and ADBP, while no correlations were evident between the levels of PTH, vitamin D, and calcium.
A negative correlation has been reported between diastolic BP and bone mineral density in elderly subjects, and this has been suggested to be due to chronic urinary calcium excretion (21). In light of this previous finding, it is noteworthy that despite significant correlations between both Na and urinary calcium levels and PTH level and BP, there was no significant difference between our hypertensive patients and control subjects with respect to osteocalcin and urinary hydroxyproline levels, which are markers of bone formation and resorption. Increased bone loss has been observed in elderly females with hypertension in a prospective study (22). Given this finding, the small sample size in the present study, composed of relatively younger participants, seems likely to have played a role in the inconsistency of our data on bone mineral density.
Our findings are in agreement with previous studies reporting high PTH levels in patients with essential hypertension (9, 11). The relationship between blood pressure and vitamin D has not been investigated as thoroughly as the relationship between blood pressure and PTH (23). Some studies have reported significantly higher vitamin D levels in hypertensive patients than normotensive patients (11, 22), and this increase has been shown to be related to the activation of 1.25-hydroxylase via PTH (11). However, in accordance with our findings of significantly lower levels of vitamin D in hypertensive patients, vitamin D level has been reported to be lower in subjects with higher systolic and diastolic BP (24). Though these contradictory results may be related to the heterogeneous characteristics of the patient populations in the studies, it seems notable that no significant correlations were determined between mean 24-hour ASBP and ADBP and levels of PTH, vitamin D, and calcitonin in our patients with essential hypertension.
Indeed, while the relationship between PTH and BP was not significant in our study population, it has been suggested in several other studies that PTH levels increase in order to compensate for urinary calcium excretion in essential hypertension (11, 20). Gennari et al. (25) also found simultaneous increases in PTH and urinary calcium excretion and suggested that high levels of serum sodium in patients with essential hypertension may have been due to excessive dietary salt in-take or a defect in the excretion of sodium, which leads to excessive calcium excretion (8, 15, 19, 25, 26). In agreement with the significant effect of renal dysfunction on PTH elevation reported in these previous studies, in the present study, sodium levels and urinary calcium levels were determined to be positively and significantly correlated with PTH, ASBP, and ADBP (p=0.001, for each) in our patient population.
Given our finding of significantly higher levels of PTH and lower levels of vitamin D in the patient group, the lack of significant correlation between PTH and vitamin D levels in our study population may be due to small sample size. Indeed, an inverse relationship between serum 25-hydroxyvitamin D and serum PTH has been well established, up to a certain level of 25-hydroxyvitamin D, at which little further decrease in serum PTH is observed (27). Use of different methods for measuring serum PTH and 25-hydroxyvitamin D and for defining baseline levels as well as different calcium intakes, have been linked to the wide range (8 to 44 ng/dL) of 25-hydroxyvitamin D threshold levels associated with any given serum PTH concentration (27, 28).
In the present study, LVWT was shown to be higher in hypertensive patients than in normotensive patients. LVMI has not always been associated with BP (2, 29). Moreover, the factors affecting LVH have not been clearly characterized, and there is ongoing debate on the relationship between increased LVWT and chronic high arterial BP and neural and humoral disorders, such as increased sympathetic nervous system activity, hyperreninemic hypertension, and hyperparathyroidism (9, 29, 30). We determined no correlations between LVMI, ASBP, and ADBP, whereas a strong correlation was shown between LVMI and PTH. This may have been due to the inclusion of mild to moderate and newly diagnosed hypertensive patients in our study population. PTH can induce hypertrophy by acting as a hypertrophic factor on myocardial muscle cells (31, 32). It is well-known that PTH causes an increase in calcium levels in cardiac myocytes by stimulating protein G, leading to the subsequent activation of L-type calcium channels. An increase in the cytosolic calcium level may lead to the activation of proto-oncogenes that serve to increase protein synthesis in general, leading to myocardial hypertrophy (16). In patients with hyperparathyroidism, LVH, which is post-operatively reversible, is a commonly observed complication (30, 33). Stefenelli et al. (30) have reported significantly higher LVMI values in normotensive patients with primary hyperparathyroidism. In another study by Bauwens et al. (9), a significant correlation between PTH and LVMI was found in untreated patients with mild and moderate essential hypertension. The rationale for including patients with mild and moderate essential hypertension in the present study was to reduce the effects of long-term chronic and high BP on the left ventricle and to reveal the other factors that may cause LVH.
We suggest that essential hypertension alters calcium metabolism. Specifically, calciuresis develops secondary to hypernatremia, with a compensatory release of PTH. Meanwhile, the increased levels of PTH cause a rise in general protein synthesis, which leads to the development of myocardial hypertrophy. However, since the small sample size in the present study precludes our ability to draw precise conclusions, an in-depth analysis of the relationship between PTH, vitamin D, and blood pressure, via future large-scale studies, is warranted.
Footnotes
Ethics Committee Approval: Ethics committee approval was received for this study.
Informed Consent: Written informed consent was obtained from patients who participated in this study.
Peer-review: Externally peer-reviewed.
Author contributions: Concept - A.H., M.A.; Design - A.H., M.A.; Supervision - A.H.; Resource - A.H., B.C., M.A.; Materials - A.H., B.C., M.A.; Data Collection&/or Processing - B.C., M.A.; Analysis&/or Interpretation - B.C., M.A.; Literature Search - A.H., B.C., M.A.; Writing - A.H., B.C.,; Critical Reviews - A.H..
Conflict of Interest: The present study was supported by Sanofi-Aventis.
Financial Disclosure: The present study was supported by Sanofi-Aventis.
References
- 1.Ghali JK, Liao Y, Simmons B, Castaner A, Cao G, Cooper RS. The prognostic role of left ventricular hypertrophy in patients with or without coronary artery disease. Ann Intern Med. 1992;117:831–6. doi: 10.7326/0003-4819-117-10-831. [DOI] [PubMed] [Google Scholar]
- 2.Levy D, Garrison RJ, Savage DD, Kannel WB, Castelli WP. Prognostic implications of echocardiographically determined left ventricular mass in the Framingham Heart Study. N Engl J Med. 1990;322:1561–6. doi: 10.1056/NEJM199005313222203. [DOI] [PubMed] [Google Scholar]
- 3.Pearson AC, Pasierski T, Labovitz AJ. Left ventricular hypertrophy:diagnosis, prognosis, and management. Am Heart J. 1991;121:148–57. doi: 10.1016/0002-8703(91)90968-n. [DOI] [PubMed] [Google Scholar]
- 4.Duprez D, Bauwens F, De Buyzere M, De Backer T, Kaufman JM, Van Hoecke J, et al. Relationship between parathyroid hormone and left ventricular mass in moderate essential hypertension. J Hypertens Suppl. 1991;9:116–7. [PubMed] [Google Scholar]
- 5.Levy D. Left ventricular hypertrophy. Epidemiological insights from the Framingham Heart Study. Drugs. 1988;35:1–5. doi: 10.2165/00003495-198800355-00002. [DOI] [PubMed] [Google Scholar]
- 6.Onat A, Sansoy V, Yıldırım B, Keleş İ, Çetinkaya A, Aksu H, et al. Investigations blood pressure levels in turkish adults: 8-year trends, rate of treatment, relationship to other risk factors and to coronary disease. Türk Kardiyol Dern Arş. 1999;27:136–43. [Google Scholar]
- 7.Messerli FH. Clinical determinants and consequences of left ventricular hypertrophy. Am J Med. 1983;75:51–6. doi: 10.1016/0002-9343(83)90118-3. [DOI] [PubMed] [Google Scholar]
- 8.Kaplan NM, Lieberman E. Clinical hypertension. 7th ed. Williams & Wilkins; Baltimore: 1998. pp. 281–99. [Google Scholar]
- 9.Bauwens FR, Duprez DA, De Buyzere ML, De Backer TL, Kaufman JM, Van Hoecke J, et al. Influence of the arterial blood pressure and nonhemodynamic factors on left ventricular hypertrophy in moderate essential hypertension. Am J Cardiol. 1991;68:925–9. doi: 10.1016/0002-9149(91)90410-m. [DOI] [PubMed] [Google Scholar]
- 10.Frohlich ED. Left ventricular hypertrophy, cardiac diseases and hypertension:recent experiences. J Am Coll Cardiol. 1989;14:1587–94. doi: 10.1016/0735-1097(89)90001-6. [DOI] [PubMed] [Google Scholar]
- 11.Brickman AS, Nyby MD, von Hungen K, Eggena P, Tuck ML. Calcitropic hormones, platelet calcium, and blood pressure in essential hypertension. Hypertension. 1990;16:515–22. doi: 10.1161/01.hyp.16.5.515. [DOI] [PubMed] [Google Scholar]
- 12.Piovesan A, Molineri N, Casasso F, Emmolo I, Ugliengo G, Cesario F, et al. Left ventricular hypertrophy in primary hyperparathyroidism. Effects of successful parathyroidectomy. Clin Endocrinol (Oxf) 1999;50:321–8. doi: 10.1046/j.1365-2265.1999.00651.x. [DOI] [PubMed] [Google Scholar]
- 13.Dominiczak AF, Lyall F, Morton JJ, Dargie HJ, Boyle IT, Tune TT, et al. Blood pressure, left ventricular mass and intracellular calcium in primary hyperparathyroidism. Clin Sci (Lond) 1990;78:127–32. doi: 10.1042/cs0780127. [DOI] [PubMed] [Google Scholar]
- 14.Stefenelli T, Abela C, Frank H, Koller-Strametz J, Globits S, Bergler-Klein J, et al. Cardiac abnormalities in patients with primary hyperparathyroidism:implications for follow-up. J Clin Endocrinol Metab. 1997;82:106–12. doi: 10.1210/jcem.82.1.3666. [DOI] [PubMed] [Google Scholar]
- 15.Morfis L, Smerdely P, Howes LG. Relationship between serum parathyroid hormone levels in the elderly and 24 h ambulatory blood pressures. J Hypertens. 1997;15:1271–6. doi: 10.1097/00004872-199715110-00011. [DOI] [PubMed] [Google Scholar]
- 16.Marban E, Koretsune Y. Cell calcium, oncogenes, and hypertrophy. Hypertension. 1990;15:652–8. doi: 10.1161/01.hyp.15.6.652. [DOI] [PubMed] [Google Scholar]
- 17.The sixth report of the Joint National Committee on prevention, detection evaluation, and treatment of high blood pressure. Arch Intern Med. 1997;157:2413–46. doi: 10.1001/archinte.157.21.2413. [DOI] [PubMed] [Google Scholar]
- 18.Foppa M, Duncan BB, Rohde LL. Echocardiography-based left ventricular mass estimation. How should we define hypertrophy? Cardiovasc Ultrasound. 2005;17:3–17. doi: 10.1186/1476-7120-3-17. [DOI] [PMC free article] [PubMed] [Google Scholar]
- 19.Mosteller RD. Simplified calculation of body-surface area. N Engl J Med. 1987;317:1098. doi: 10.1056/NEJM198710223171717. [DOI] [PubMed] [Google Scholar]
- 20.McCarron DA, Pingree PA, Rubin RJ, Gaucher SM, Molitch M, Krutzik S. Enhanced parathyroid function in essential hypertension:a homeostatic response to a urinary calcium leak. Hypertension. 1980;2:162–8. doi: 10.1161/01.hyp.2.2.162. [DOI] [PubMed] [Google Scholar]
- 21.Grobbee DE, Burger H, Hofman A, Pols HA. Blood pressure and bone density are inversely related in the elderly. J Hypertens. 1996;14:35. [Google Scholar]
- 22.Resnick LM, Müller FB, Laragh JH. Calcium-regulating hormones in essential hypertension. Relation to plasma renin activity and sodium metabolism. Ann Intern Med. 1986;105:649–54. doi: 10.7326/0003-4819-105-5-649. [DOI] [PubMed] [Google Scholar]
- 23.Young EW, Morris CD, McCarron DA. Urinary calcium excretion in essential hypertension. J Lab Clin Med. 1992;120:624–32. [PubMed] [Google Scholar]
- 24.Kristal-Boneh E, Froom P, Harari G, Ribak J. Association of calcitriol and blood pressure in normotensive men. Hypertension. 1997;30:1289–94. doi: 10.1161/01.hyp.30.5.1289. [DOI] [PubMed] [Google Scholar]
- 25.Gennari C, Nami R, Bianchini C, Pavese G, Lucani B, Perrone AF. Renal excretion of calcium in human hypertension. Am J Nephrol. 1986;6:124–7. doi: 10.1159/000167235. [DOI] [PubMed] [Google Scholar]
- 26.Sowers JR, Zemel MB, Standley PR, Zemel PC. Calcium and hypertension. J Lab Clin Med. 1989;114:338–48. [PubMed] [Google Scholar]
- 27.Steingrimsdottir L, Gunnarsson O, Indridason OS, Franzson L, Sigurdsson G. Relationship between serum parathyroid hormone levels, vitamin D sufficiency, and calcium intake. JAMA. 2005;294:2336–41. doi: 10.1001/jama.294.18.2336. [DOI] [PubMed] [Google Scholar]
- 28.Lips P, Chapuy MC, Dawson-Hughes B, Pols HA, Holick MF. An international comparison of serum 25- hydroxyvitamin D measurements. Osteoporos Int. 1999;9:394–7. doi: 10.1007/s001980050162. [DOI] [PubMed] [Google Scholar]
- 29.Savage DD, Drayer JI, Henry WL, Mathews EC, Jr, Ware JH, Gardin JM, et al. Echocardiographic assessment of cardiac anatomy and function in hypertensive subjects. Circulation. 1979;59:623–32. doi: 10.1161/01.cir.59.4.623. [DOI] [PubMed] [Google Scholar]
- 30.Stefenelli T, Abela C, Frank H, Koller-Strametz J, Niederle B. Time course of regression of left ventricular hypertrophy after successful parathyroidectomy. Surgery. 1997;121:157–61. doi: 10.1016/s0039-6060(97)90285-3. [DOI] [PubMed] [Google Scholar]
- 31.Schlüter KD, Piper HM. Left ventricular hypertrophy and parathyroid hormone:a causal connection? Cardiovascular Res. 1998;37:34–41. doi: 10.1016/s0008-6363(98)00097-2. [DOI] [PubMed] [Google Scholar]
- 32.Halapas A, Diamanti-Kondarakis E, Kremastinos D, Koutsilleris M. The PTHrP/PTH.1-R bioregulation system in cardiac hypertrophy:possible therapeutic implications. In vivo. 2006;20:837–44. [PubMed] [Google Scholar]
- 33.Stefenelli T, Mayr H, Bergler-Klein J, Globits S, Woloszczuk W, Niederle B. Primary hyperparathyroidism:incidence of cardiac abnormalities and partial reversibility after successful parathyroidectomy. Am J Med. 1993;95:197–202. doi: 10.1016/0002-9343(93)90260-v. [DOI] [PubMed] [Google Scholar]