Abstract
We recently reported evidence suggesting that migrating macrophages (Mϕs) eliminate renal crystals in hyperoxaluric mice. Mϕs can be inflammatory (M1) or anti-inflammatory (M2), and colony-stimulating factor-1 (CSF-1) mediates polarization to the M2Mϕ phenotype. M2Mϕs promote renal tissue repair and regeneration, but it is not clear whether these cells are involved in suppressing renal crystal formation. We investigated the role of M2Mϕs in renal crystal formation during hyperoxaluria using CSF-1–deficient mice, which lack M2Mϕs. Compared with wild-type mice, CSF-1–deficient mice had significantly higher amounts of renal calcium oxalate crystal deposition. Treatment with recombinant human CSF-1 increased the expression of M2-related genes and markedly decreased the number of renal crystals in both CSF-1–deficient and wild-type mice. Flow cytometry of sorted renal Mϕs showed that CSF-1 deficiency resulted in a smaller population of CD11b+F4/80+CD163+CD206hi cells, which represent M2-like Mϕs. Additionally, transfusion of M2Mϕs into CSF-1–deficient mice suppressed renal crystal deposition. In vitro phagocytosis assays with calcium oxalate monohydrate crystals showed a higher rate of crystal phagocytosis by M2-polarized Mϕs than M1-polarized Mϕs or renal tubular cells. Gene array profiling showed that CSF-1 deficiency resulted in disordered M2- and stone-related gene expressions. Collectively, our results provide compelling evidence for a suppressive role of CSF-1 signaling in renal crystal formation.
We previously used microarray analysis to show a correlation between renal calcium oxalate (CaOx) crystal formation and macrophages (Mϕs).1 We also observed the migration of Mϕs to renal tubular cells (RTCs) that include crystals followed by the disappearance of crystals in the tubular lumen from the corticomedullary junction in hyperoxaluric mice.2 Mϕs and multinucleated giant cells also encapsulated interstitial crystals in the kidneys of hyperoxaluric rats and humans with acute and chronic oxalosis.3 In addition, normal rat kidney epithelial cells expressed monocyte chemotactic protein-1 (MCP-1), the levels of which increased after exposure to CaOx monohydrate (COM) crystals and oxalate.4 Finally, several in vitro5 and in vivo6 studies reported that urinary COM crystals could be degraded and dissolved by Mϕs. These findings suggest that Mϕs influence crystal processing, although the mechanisms by which they interact with crystals remain unclear.
There are two subtypes of Mϕs, classically activated (M1) and alternatively activated (M2) Mϕs, which exert pro- and anti-inflammatory effects, respectively.7,8 Resident tissue Mϕs differentiate after stimulation by various cytokines.9,10 Associations were reported between kidney stones and atherosclerotic plaques in which various types of Mϕ migrate.11–14 In these studies, M2Mϕs infiltrated early atherosclerotic lesions, whereas M1Mϕs were found predominantly in advanced lesions. Plaque formation correlated with the dominance of the M1 phenotype.15 Several reports suggested that M2Mϕs decreased tissue inflammation and promoted tissue healing in GN16 and ischemia/reperfusion kidneys.17
Some reports suggested that colony-stimulating factor-1 (CSF-1) signaling mediates tissue regeneration after injury and also, alters Mϕ polarization to the M2 phenotype.18–20 In addition, several studies21–23 have used CSF-1–deficient (op/op) mice,24 which contain a point mutation in CSF1 and exhibit fewer circulating monocytes and tissue Mϕs than mice with CSF-1. Although these studies showed that loss of CSF-1 significantly reduces atherosclerotic severity, they did not elucidate the role of Mϕ polarization in these outcomes.
In this study, we examined and compared renal crystal formation and Mϕ polarization in wild-type and CSF-1–deficient mice after hyperoxaluric treatment. We showed that CSF-1 deficiency results in increased renal crystal deposition and fewer M2-like Mϕs. We also found that the in vitro phagocytosis of COM crystals was higher in M2-polarized Mϕs from bone marrow-derived Mϕs (BMMs). Overall, this study showed that CSF-1 suppresses renal crystal formation in hyperoxaluric mice.
Results
Morphologic and Quantitative Analysis of Renal and Urinary CaOx Crystals
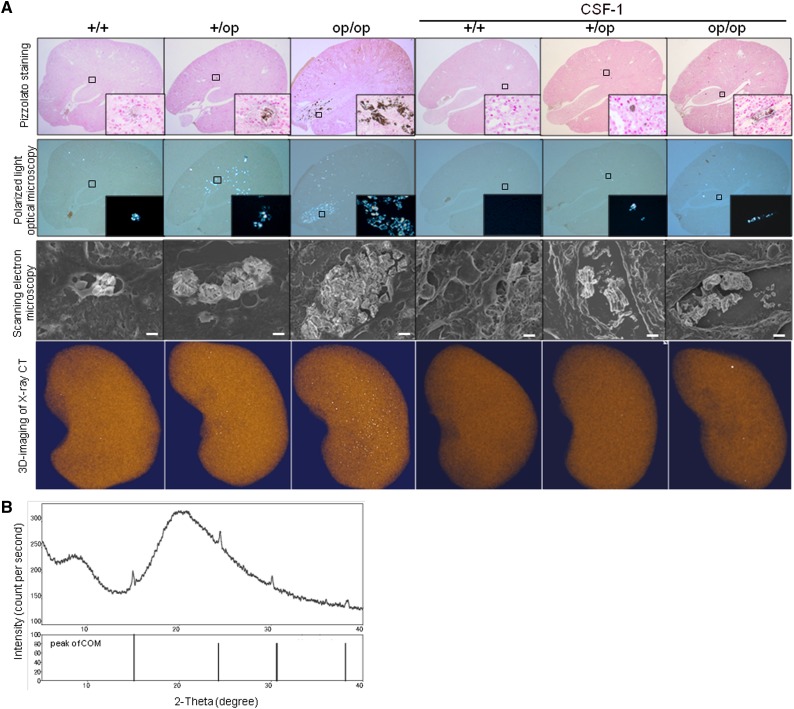
CaOx crystals were present predominantly in the renal tubular lumen at the papilla in op/op mice and the renal tubular lumen at the corticomedullary junction in both +/+ and +/op mice, consistent with a previous study.25 Three-dimensional computed tomography (CT) images of whole kidneys showed increased renal crystal deposits in op/op mice compared other groups (Figure 1A).
Figure 1.
Morphologic and quantitative distribution of renal CaOx crystals. (A) Representative micrographs and three-dimensional imaging of renal sections harvested on day 6. In op/op mice, renal crystal deposits were detected inside the tubular lumen, predominantly at the papilla, using Pizzolato staining and polarized light optical microphotography. Pizzolato staining showed large crystals in the intratubular space of the renal papillary region in op/op mice. Crystallization throughout the kidney tissue is observed as white dots in the renal parenchyma with three-dimensional CT images. Original magnification, ×40; ×400 in inset. Scanning EM showed that crystals in op/op mice were disordered and large compared with those crystals in the other groups of mice. Original magnification, ×3000. Scale bar: 5 μm. CSF-1–treated groups had the same intratubular crystal formation as the untreated groups, but the crystals were more disordered when assessed by scanning EM. (B) Qualitative analysis of crystals formed by the administration of glyoxylate using x-ray diffraction. X-ray diffraction analysis showed that the major component of renal crystals in op/op mice was COM, because multiple diffraction peaks characteristic of COM and no peaks characteristic of CaOx dihydrate or other components were detected.
Scanning electron microscopy (EM) revealed large disordered crystals in op/op mice compared with radial ordered crystals in +/+ and +/op mice. Moreover, the crystals in op/op mice caused dilation of the renal tubular lumen. CSF-1–treated mice had intratubular crystals comparable with those crystals observed in the untreated groups, but the crystals were more disordered by scanning EM. X-ray diffraction analysis showed that the major component of renal crystals in op/op mice was COM (Figure 1B).
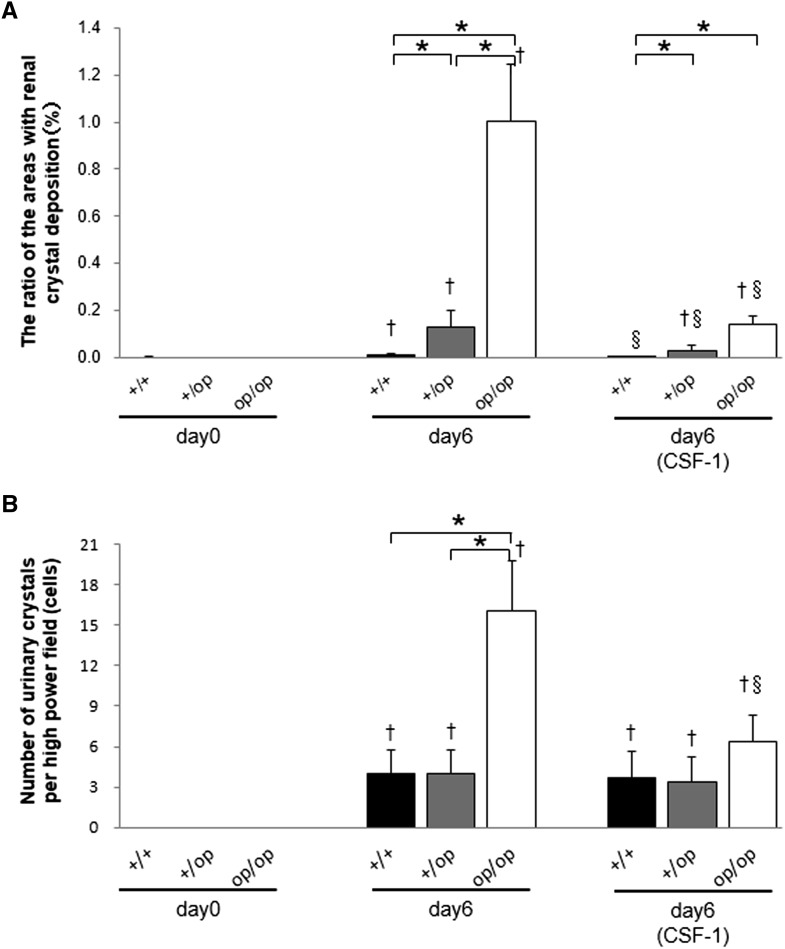
The number of renal crystal deposits on day 6 was significantly higher in op/op mice than in +/+ or +/op mice. CSF-1 treatment decreased the number of crystals in all groups (Figure 2A). After treatment with glyoxylate, all groups exhibited CaOx crystalluria at day 6, which was markedly higher in op/op mice. Importantly, CSF-1 treatment decreased CaOx crystalluria in op/op mice (Figure 2B).
Figure 2.
Quantitative estimation of renal and urinary CaOx crystals. (A) The ratio of areas with renal crystal deposition. Crystallization in each kidney section was quantified by calculating the ratio (percent) of the area containing crystals to the entire kidney section using Image Pro Plus. (B) The number of urinary crystals per high-powered field; 24-hour urine samples on days 0 and 6 were collected in a metabolic cage, and CaOx crystals were counted at ×400 magnification. Day 6 (CSF-1) indicates that all mice in each genotype group were treated with 5.0 μg CSF-1. n=6 for all time points in each group. Data are presented as means±SEMs. *P<0.05 compared between the +/+, +/op, and op/op groups at the same time points; †P<0.05 compared with day 0 in each group; §P<0.05 compared with day 6 in each group.
Serum and Urinary Variables
Serum biochemistry and urinary variables are shown in Table 1.
Table 1.
Serum and urinary biochemistry
| Treatment Days | Day 0 | Day 6 | Day 6 (CSF-1) | ||||||
|---|---|---|---|---|---|---|---|---|---|
| Genotypes | +/+ | +/op | op/op | +/+ | +/op | op/op | +/+ | +/op | op/op |
| Serum | |||||||||
| Cr (mg/dl) | 0.01±0.00 | 0.01±0.00 | 0.01±0.00 | 0.01±0.00 | 0.01±0.00 | 0.02±0.01 | 0.04±0.01a | 0.03±0.01a | 0.01±0.00b,c |
| Ca (mg/dl) | 9.10±0.10 | 9.47±0.32 | 10.25±0.12 | 9.35±0.09 | 9.23±0.36 | 9.44±0.17 | 9.02±0.07 | 9.23±0.08 | 9.44±0.37 |
| P (mg/dl) | 9.10±0.72 | 9.53±1.42 | 9.13±0.58 | 9.15±0.46 | 8.22±0.92 | 7.86±0.40 | 8.06±0.28 | 7.58±0.40 | 9.30±1.54 |
| Urine | |||||||||
| Volume (ml) | 1.46±0.29 | 1.80±0.41 | 0.70±0.09b,c | 1.97±0.28 | 1.71±0.33 | 1.48±0.24 | 2.00±0.19 | 1.98±0.11 | 1.60±0.22 |
| pH | 6.7±0.12 | 6.70±0.12 | 6.75±0.14 | 6.45±0.11 | 6.22±0.12 | 6.30±0.12 | 6.40±0.10 | 6.60±0.140 | 6.63±0.14 |
| Ca (μmol/g per Cr) | 2.35±0.23 | 2.94±0.58 | 3.22±0.20 | 2.88±0.31 | 3.00±0.15 | 3.89±0.51 | 2.54±0.27 | 2.93±0.20 | 3.56±0.33 |
| P (μmol/g per Cr) | 275.67±21.20 | 281.03±17.49 | 248.98±16.90 | 245.26±19.13 | 238.93±16.62 | 235.45±11.88 | 209.93±9.15 | 221.04±18.57 | 246.66±9.15 |
| Mg (μmol/g per Cr) | 55.57±3.45 | 63.98±3.86 | 77.99±5.62 | 71.48±3.19 | 66.80±2.61 | 77.95±1.77 | 66.03±7.59 | 61.32±4.55 | 69.33±1.70 |
| Ox (μmol/g per Cr) | 58.80±4.70 | 68.30±2.03 | 52.33±6.93 | 148.44±7.32a | 150.71±19.37a | 132.28±6.94a | 108.92±5.67a | 112.90±8.98a | 125.94±4.92a |
Serum calcium, creatinine (Cr), and phosphorus levels were not significantly different among the +/+, +/op, and op/op groups and each group with CSF-1 treatment, except for +/+ and +/op groups with CSF-1 treatment on day 6. Urinary volumes on day 0 were significantly lower in op/op mice than in +/+ and +/op mice. Urinary oxalate levels were significantly higher on day 6 in all groups (with or without CSF-1 treatment) than on day 0. Data are given as means±SEMs.
P<0.05 compared with day 0 in each group.
P<0.05 compared with the +/+ mice.
P<0.05 compared with the +/op mice.
CSF-1–Deficient Mice Had Increased Expression of Crystal Binding and Related Genes
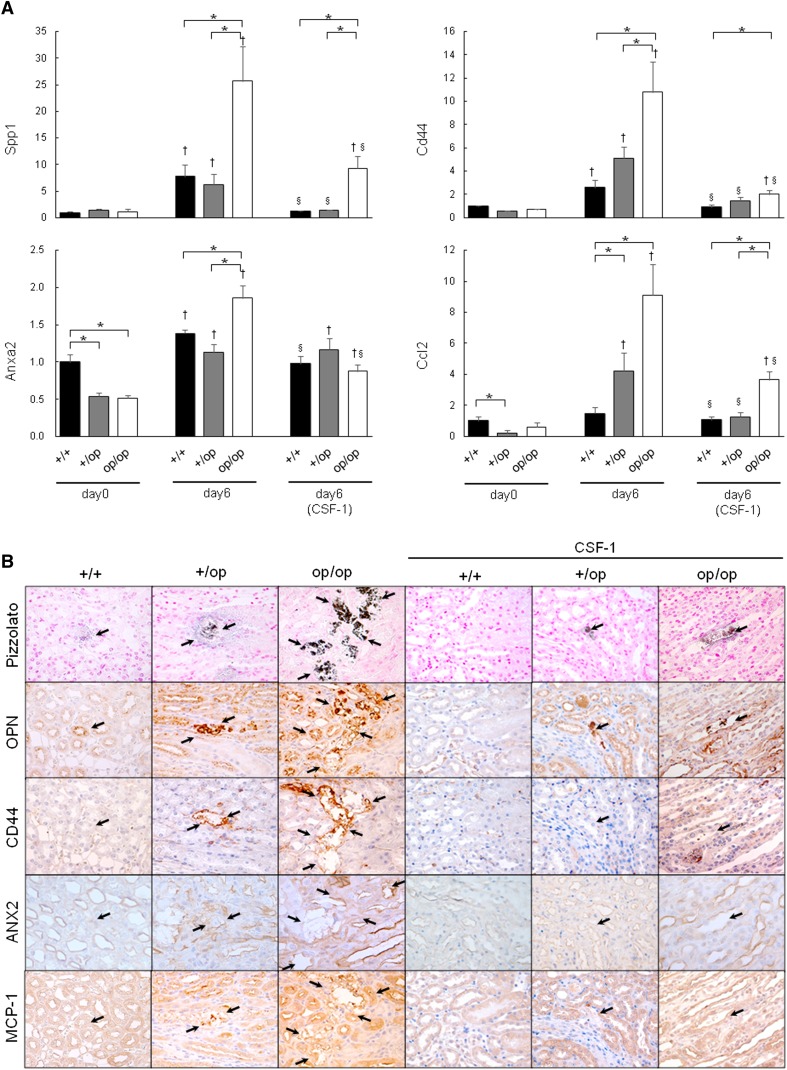
Quantitative RT-PCR of whole-kidney tissue revealed a marked increase in the expression of several genes from day 0 to 6 in all genotypes, including secreted phosphoprotein 1 (Spp1; encoding osteopontin [OPN]), Cd44 (encoding CD44), annexin A2 (Anxa2; encoding annexin II [ANX2)]), and chemokine (CC motif) ligand 2 (Ccl2; encoding MCP-1). Their expression was significantly higher in op/op mice than +/+ and +/op mice (Figure 3A). On day 6, the expressions of Spp1, Cd44, and Ccl2 increased in op/op mice and were 4-, 3-, and 5-fold higher than in the +/+ group, respectively. In addition, the expressions of Spp1, Cd44, Anxa2, and Ccl2 in each group receiving CSF-1 were significantly lower than in untreated mice. Nevertheless, the expressions of Spp1, Cd44, and Ccl2 in op/op mice on day 6 (CSF-1) remained higher than in +/+ or +/op mice.
Figure 3.
Evaluation of crystal binding and related gene expressions. (A) The expression of each gene indicated was determined by quantitative RT-PCR using TaqMan assays. Control values represent the average of the data for the +/+ mice on day 0. The data are presented as means±SEMs. Day 6 (CSF-1) indicates that all mice in each genotype group were treated with 5.0 μg CSF-1. n=6 for each group. *P<0.05 compared between the +/+, +/op, and op/op groups at the same time points; †P<0.05 compared with day 0 in each group; §P<0.05 compared with day 6 in each group. (B) Immunohistochemical distribution of the expression of crystal binding and binding-related molecules in mouse kidneys harvested at day 6. Pizzolato staining indicated CaOx crystal deposits (arrows). Original magnification, ×400.
Strong immunohistochemical staining for OPN, CD44, ANX2, and MCP-1 was observed on the luminal side of renal tubular epithelial cells, predominantly in the pericrystal region (Figure 3B). The staining intensity of these proteins was abrogated by CSF-1 treatment in all groups.
Glyoxylate Treatment Increased F4/80hi pan-Mϕ in All Mice
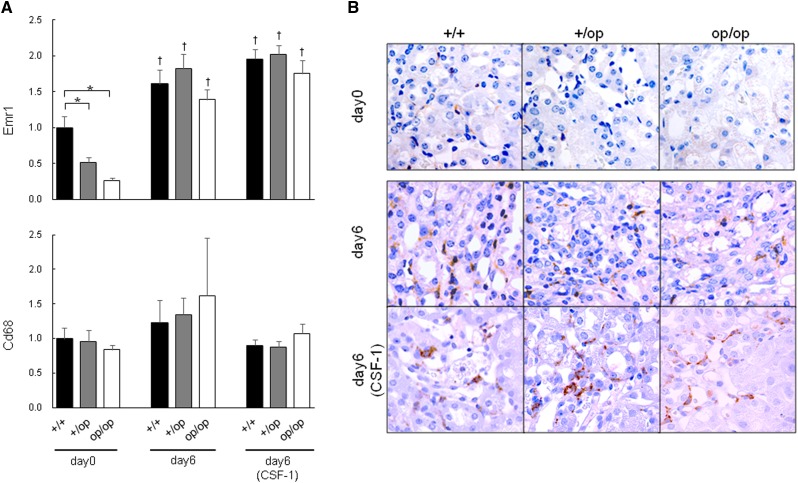
The mRNA expression of EGF-like module-containing mucin-like hormone receptor–like 1 (Emr1; encoding F4/80) and Cd68 (encoding CD68), which are pan-Mϕ markers, is shown in Figure 4A. Emr1 expression was lower in the +/op and op/op groups than in +/+ mice on day 0, but there was no significant difference between groups by day 6, irrespective of CSF-1 treatment. There was no significant difference in Cd68 expression between any groups of mice.
Figure 4.
Evaluation of pan-Mϕ–related gene expression. (A) The expression of each gene was determined by quantitative RT-PCR using TaqMan assays. Control values are the averages of the data for the +/+ mice on day 0. The data are presented as means±SEMs. Day 6 (CSF-1) indicates that all mice in each genotype group were administered 5.0 μg CSF-1. n=6 for each group. *P<0.05 compared between the +/+, +/op, and op/op groups at the same time points; †P<0.05 compared with day 0 in each group. (B) Immunohistochemical distribution of F4/80 expression in mouse kidneys harvested on day 6. Original magnification, ×400.
Immunohistochemically, F4/80-positive cells infiltrated the renal interstitium in all six groups; no significant differences were identified between groups (Figure 4B).
CSF-1 Deficiency Correlated with Insufficient Expression of M2- but Sufficient Expression of M1-Related Genes
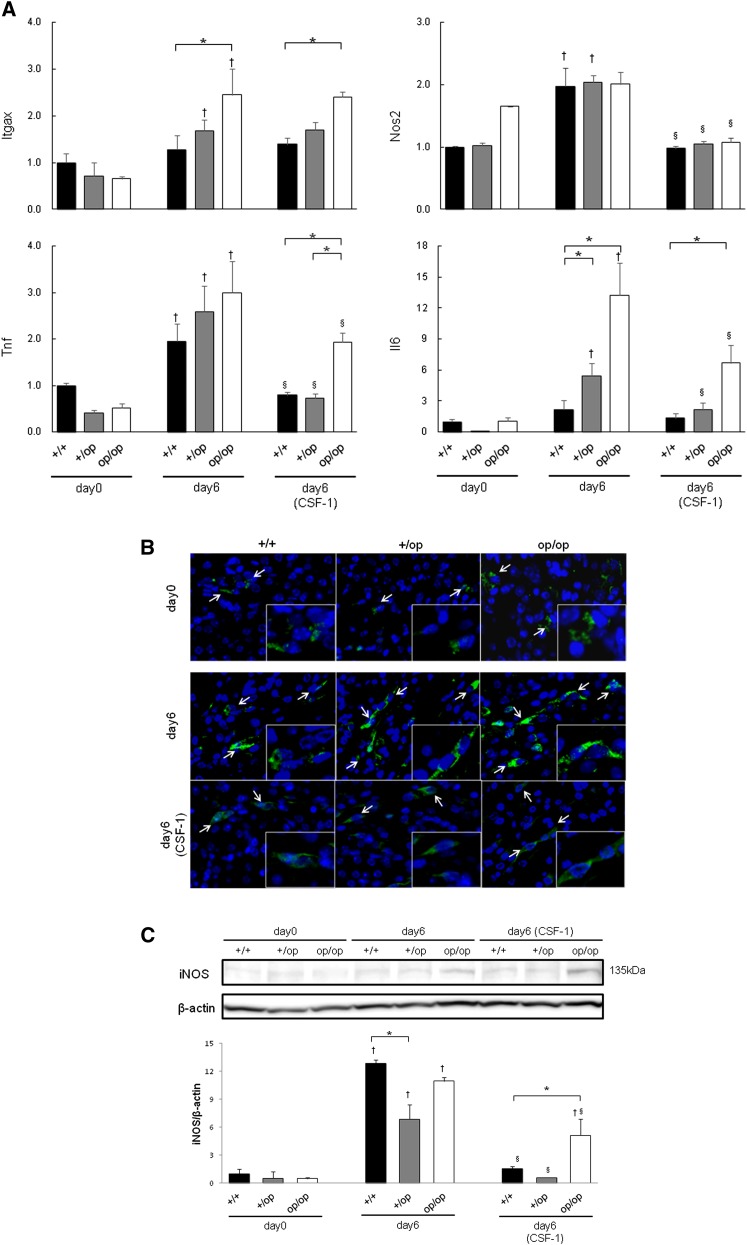
The expressions of integrin-αX (Itgax; encoding CD11c), inducible nitric oxide synthase 2 (Nos2; encoding iNOS), Tnf (encoding TNFα), and Il6 (encoding IL-6) at day 0 were comparable between the three genotypes. Expressions of Nos2 in the +/+ and +/op groups and Itgax and Il6 in +/op and op/op mice increased significantly from day 0 to 6. The expression of Tnf in all genotypes increased from day 0 to 6. The initial expressions of Nos2, Tnf, and Il6 in all CSF-1–treated groups were decreased significantly compared with the respective groups on day 6. After CSF-1 treatment, the expressions of Itgax, Tnf, and Il6 were higher in the op/op group than the +/+ group (Figure 5A).
Figure 5.
Evaluation of M1-like Mϕ-related genes. (A) The expression of each gene was determined by quantitative RT-PCR using TaqMan assays. Control values are the average of the data for the +/+ mice on day 0. The data are presented as means±SEMs. Day 6 (CSF-1) indicates that all mice in each genotype group were administered 5.0 μg CSF-1. n=6 for each group. *P<0.05 compared between the +/+, +/op, and op/op groups at the same time points; †P<0.05 compared with day 0 in each group; §P<0.05 compared with day 6 in each group. (B) Fluorescence immunohistochemical distribution of iNOS expression in mouse kidneys harvested on days 0 and 6. In the interstitial space of the corticomedullary junction, iNOS-positive Mϕs (white arrows) were detected in all six groups. Blue, nucleus; green, iNOS. Original magnification, ×400; ×800 in inset. (C) Western blotting of mouse kidneys for iNOS protein expression. The molecular mass of iNOS was confirmed by bands at 135 kD. Control values are the average of the data for the +/+ mice on day 0. The data are presented as means±SEMs. n=3 for each group. *P<0.05 compared between the +/+, +/op, and op/op groups at the same time points; †P<0.05 compared with day 0 in each group; §P<0.05 compared with day 6 in each group.
iNOS-positive Mϕs were detected in the interstitial space of the corticomedullary junction in all six groups (Figure 5B). The expression of iNOS was higher on day 6 than day 0 in all three genotypes, and it was decreased by CSF-1 treatment. iNOS expression was higher in op/op mice than +/+ and +/op mice after CSF-1 treatment (Figure 5C).
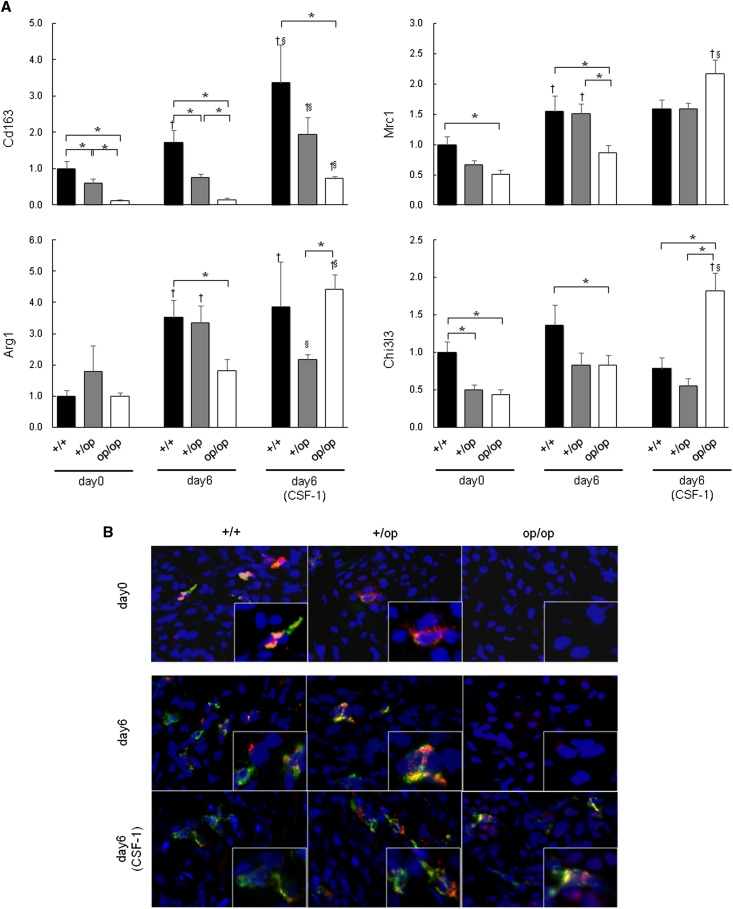
On day 0, the expressions of Cd163 (encoding CD163), mannose receptor C type 1 (Mrc1; encoding CD206), and chitinase 3–like 3 (Chi3l3; encoding Ym-1) were significantly lower in op/op than +/+ mice (Figure 6A). The expressions of Cd163 in +/+ mice and Mrc1 and arginase 1 (Arg1) in +/+ and +/op mice were increased markedly from day 0 to 6. In op/op mice, the expressions of Cd163, Mrc1, Arg1, and Chi3l3 on day 6 were significantly lower than in +/+ mice. All genes were increased by CSF-1 treatment.
Figure 6.
Evaluation of M2-like Mϕ-related genes. (A) The expression of each gene was determined by quantitative RT-PCR using TaqMan assays. Control values are the average of the data for the +/+ mice on day 0. The data represent mean±SEM values. Day 6 (CSF-1) indicates that every mouse in each genotype group was administered 5.0 μg CSF-1. n=6 for each group. *P<0.05 compared between the +/+, +/op, and op/op groups at the same time points; †P<0.05 compared with day 0 in each group; §P<0.05 compared with day 6 in each group. (B) Fluorescence immunohistochemical distribution of CD163 and CD206 expression in mouse kidneys harvested on days 0 and 6. CD163 and CD206 double positive Mϕs are shown in the interstitial cells of the corticomedullary junction in the +/+ and +/op groups; however, neither protein was expressed in the op/op group on day 0 or 6. The expression of CD163 and CD206 was increased by CSF-1 treatment. Blue, nucleus; green, CD206; red, CD163. Original magnification, ×400; ×800 in inset.
Fluorescence double immunohistochemical staining revealed CD163 and CD206 double positive Mϕs in the interstitial cells of the corticomedullary junction in +/+ and +/op mice; however, neither protein was expressed in op/op mice on day 0 or 6 (Figure 6B). The expressions of CD163 and CD206 were detected in the interstitial space of the corticomedullary junction in op/op mice after CSF-1 treatment.
CSF-1 Deficiency Significantly Reduced the M2-Like Population
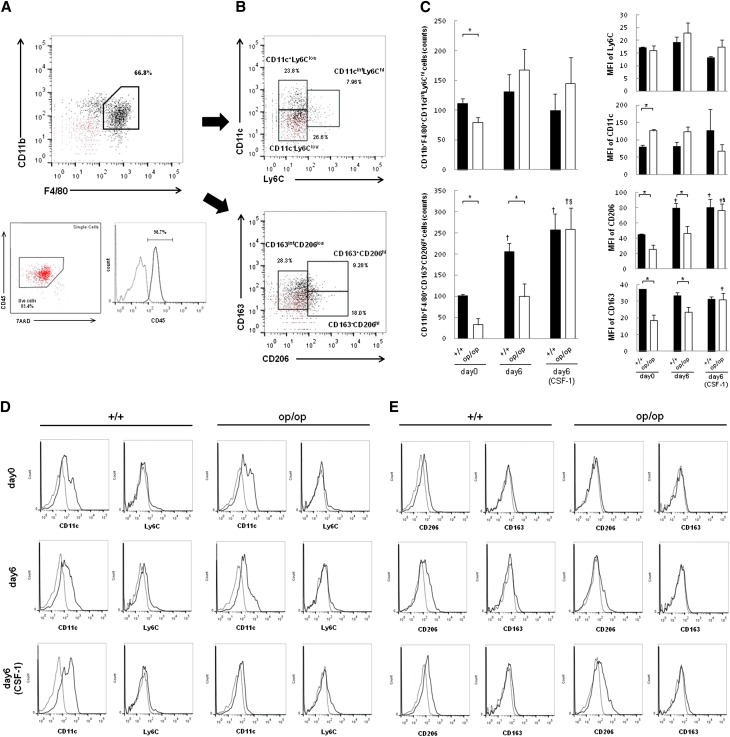
To quantify M1/M2-polarization Mϕs, we measured their surface markers (M1, CD11c and Ly6C; M2, CD163 and CD206) by flow cytometry. Approximately 70% of renal interstitial Mϕs were CD11b+F4/80+ (Figure 7A). This population was then separated into six populations based on differences in the expression of CD11c/Ly6C (Figure 7B, upper panel) and CD163/CD206 (Figure 7B, lower panel). There were no significant differences in M1-like Mϕs expressing CD11b+F4/80+CD11cintLy6Chi between +/+ and op/op mice, except at day 0, and CSF-1 treatment did not change the characteristics of those populations (Figure 7, C and D). There were markedly fewer CD11b+F4/80+CD163+CD206hi cells, representing M2-like Mϕs (Figure 7, C and E), in op/op than +/+ mice on days 0 and 6. These M2-like Mϕs were increased after CSF-1 treatment in the op/op group.
Figure 7.
Flow cytometric analysis of renal Mϕs. (A) Gating strategy for CD11b+F4/80+ of renal mononuclear cells. The population of F4/80hiCD11b+ cells was determined from the representative graph. Isotype controls of both F4/80 and CD11b proteins are shown as red dot plots (upper panel). Back gates for live cells and CD45 are also shown. Most F4/80hiCD11b+ cells were CD45-positive and 7AAD-negative (lower left panel). The dotted line shows the isotype control of CD45 protein (lower right panel). (B) The CD11cintLy6Chi (upper panel) and CD163+CD206hi (lower panel) subpopulations of CD11b+F4/80+ cells are shown. Isotype controls for CD11c and Ly6C (upper panel) and CD163 and CD206 (lower panel) are shown on each graph as red dotted lines. (C) Quantification of CD11b+F4/80+CD11cintLy6Chi (upper left panel) and CD11b+F4/80+CD163+CD206hi Mϕs (lower left panel). There were no significant differences between +/+ and op/op mice except on day 0, and treatment with CSF-1 did not change the characteristics of those populations; op/op mice had a significantly lower number of CD11b+F4/80+CD163+CD206hi Mϕs than +/+ mice on days 0 and 6. The number of CD11b+F4/80+CD163+CD206hi Mϕs was increased after CSF-1 treatment in op/op mice. The median fluorescent intensities (MFIs) of Ly6C, CD11c, CD206, and CD163 in CD11b+F4/80+ cells are shown in right panel; op/op had lower intensities of CD206 and CD163 staining than +/+ mice, but CSF-1 treatment increased CD206 intensity. The data represent mean±SEM values. Day 6 (CSF-1) indicates that all mice in each genotype group were treated with 5.0 μg CSF-1. n=4 for each group. *P<0.05 compared with the +/+ group; †P<0.05 compared with day 0 in each group; §P<0.05 compared with day 6 in each group. (D) M1-like Mϕ expression. Representative FACS histograms of either CD11c or Ly6C in CD11b+F4/80+ cells are shown. Dotted lines show isotype controls of CD11c and Ly6C proteins. (E) M2-like Mϕ expression. Representative FACS histograms of either CD206 or CD163 in CD11b+F4/80+ cells are shown. Dotted lines show isotype controls of CD206 and CD163 proteins.
M2Mϕs Phagocytized COM Crystals In Vitro
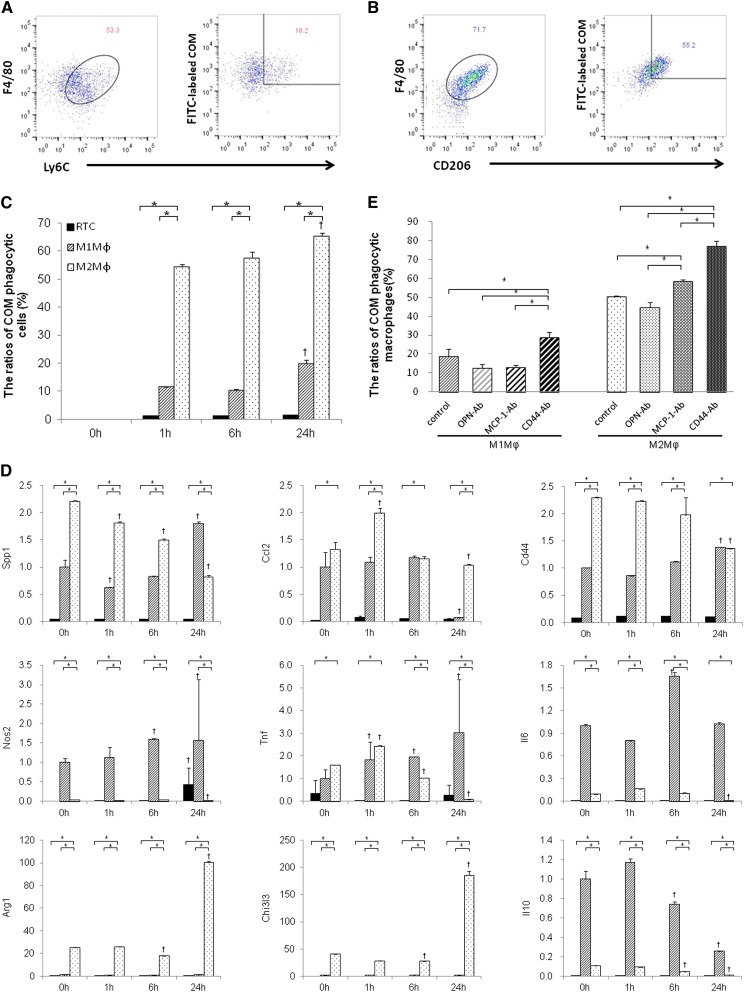
BMM-derived M1Mϕs (Figure 8A) and M2Mϕs (Figure 8B) were detected by flow cytometry with staining for F4/80+Ly6C+ and F4/80+CD206+, respectively. BMM-derived M2Mϕs were differentiated using IL-4 and CSF-1, which showed that the M2a subtype was CD163hiCD206hiArginasehiPparghiIL-10low (Figure 8D). M2Mϕs had a higher phagocytic rate of COM crystals than RTCs or M1Mϕs at each time point. The phagocytic ability of M2Mϕs increased gradually with COM exposure.
Figure 8.
Analysis of the ability of M1- and M2Mϕs to phagocytize COM crystals in vitro. (A) Schematic representation using flow cytometry. Detection of M1Mϕs (left panel) and FITC-labeled COMs phagocytized by M1Mϕs (right panel). (B) Detection of M2Mϕs (left panel) and FITC-labeled COMs phagocytized by M2Mϕs (right panel). (C) Quantitative analysis of phagocytic Mϕs. The ratios of COM phagocytic Mϕs were evaluated by flow cytometry according to the strategy described above. M2Mϕs had a higher rate of phagocytosis for COM crystals than RTCs and M1Mϕ. These relative cell numbers of phagocytic Mϕs were increased time-dependently; 0, 1, 6, and 24 hours indicate the time elapsed after COM treatment in each cell type. The data represent mean±SEM values. n=4 for each group. *P<0.05 compared between the RTC, M1Mϕ, and M2Mϕ groups; †P<0.05 compared with 0 hours in each group. (D) The expression of each gene was determined by quantitative RT-PCR using TaqMan assays. Black bar, RTCs; slashed bar, M1Mϕs; dotted bar, M2Mϕs. Control values are the average of the data for the M1Mϕ group at 1 hour; 0, 1, 6, and 24 hours indicate the time elapsed after COM treatment in the RTC, M1Mϕ, and M2Mϕ groups. The data represent mean±SEM values. n=4 for each group. *P<0.05 compared between the RTC, M1Mϕ, and M2Mϕ groups; †P<0.05 compared with 0 hours in each group. (E) Quantitative analysis of phagocytic M1Mϕs and M2Mϕs after neutralization with crystal binding molecules. The ratios of COM phagocytic Mϕs were evaluated by flow cytometry according to the strategy described above. Cells were incubated with COM for 6 hours in all groups. In both M1 and M2Mϕ groups, CD44 suppression increased the relative number of phagocytic cells. MCP-1 neutralization also increased the relative number of COM phagocytic M2Mϕs. There were no differences in the relative number of phagocytic M1- or M2Mϕs after OPN neutralization. OPN-Ab, MCP-1-Ab, and CD44-Ab indicate groups that were treated with each respective neutralization antibody. The data represent mean±SEM values. n=4 for each group. *P<0.05 compared between four groups.
The expressions of Spp1, Cd44, Arg1, and Chi3l3 were significantly higher in M2Mϕs than RTCs and M1Mϕs (Figure 8D). Spp1 and Cd44 levels decreased in M2Mϕs but increased in M1Mϕs over time. The expressions of Nos2, Il6, and Il10 were significantly lower in M2Mϕs compared with M1Mϕs and decreased after 24 hours of COM exposure. In M1Mϕs, the expression levels of Nos2 at 6 and 24 hours, Tnf from 1 to 24 hours, and Il6 at 6 hours were higher than at 0 hours. Neutralization of crystal binding molecules showed that suppressing CD44 increased COM phagocytosis by M1 and M2Mϕ significantly, whereas suppressing MCP-1 increased phagocytic M2Mϕ. Neutralizing OPN did not affect COM phagocytosis by these Mϕs (Figure 8E).
M2Mϕ Transfusion Suppressed Renal Crystal Deposition and the Expression of Crystal Binding Molecules
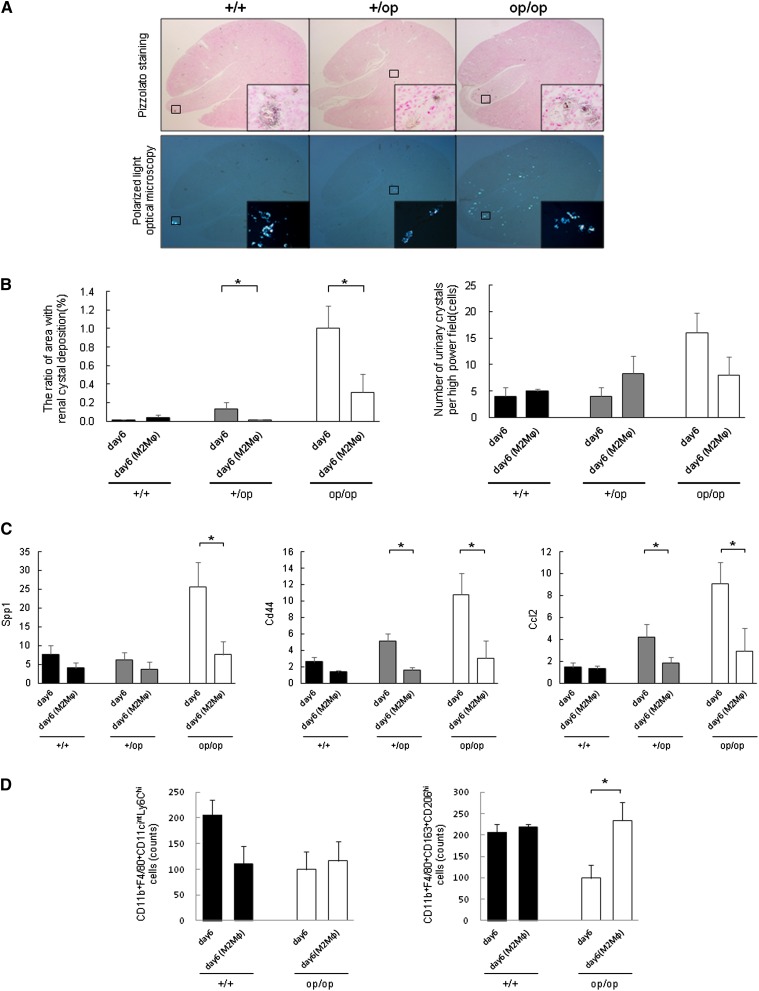
Adoptive transfusion of BMM-derived M2Mϕs decreased renal crystal deposition in +/op and op/op mice on day 6, whereas there were no differences in the number of urinary crystals between genotypes (Figure 9B). The renal crystals in each genotype were intratubular CaOx crystals from the corticomedullary junction to the papilla (Figure 9A). The expressions of Spp1, Cd44, and Ccl2 in whole-kidney tissue of op/op mice after M2Mϕ transfusion were lower than in untreated mice (Figure 9C). Flow cytometric analyses revealed no differences in the number of M1-like Mϕs, whereas M2-like Mϕs increased in op/op mice after M2Mϕ transfusion (Figure 9D).
Figure 9.
Evaluation of the effect of M2Mϕ transfusion on crystal formation. In each graph, the data from day 6 experiments of each genotype (described previously) were used as the control to compare the differences between groups treated with M2Mϕ and those groups not treated. Day 6 (M2Mϕ) indicates that every mouse in each genotype group was transfused with 1.0×10⁶ cells of M2Mϕs. Data represent means±SEMs. (A) Representative micrographs of renal sections harvested on day 6 from M2Mϕ-transfused mice. Each genotype had the same intratubular CaOx crystals from the corticomedullary junction to papilla. n=5 for each group. Original magnification, ×40; ×400 in inset. (B) Quantitative estimation of renal and urinary CaOx crystals. (Left panel) The ratio of the area containing renal crystal deposition. Crystallization in each kidney section was quantified by calculating the ratio (percent) of the area containing crystals to the entire kidney section using Image Pro Plus. (Right panel) The number of urinary crystals per high-powered field; 24-hour urine samples were collected in a metabolic cage, and CaOx crystals were counted at ×400 magnification. n=5 for each group. (C) Evaluation of crystal binding and related gene expressions. The expression of each gene was determined by quantitative RT-PCR using TaqMan assays. Control values are the average of the data for the +/+ mice on day 0. The data are presented as means±SEMs. n=5 for each group. (D) Flow cytometric analysis of renal Mϕs. The numbers of CD11b+F4/80+CD11cintLy6Chi (left panel) and CD11b+F4/80+CD163+CD206hi (right panel) Mϕs were calculated by flow cytometry. The gating strategy was the same as the strategy used in Figure 7 (described above). n=4 for each group. *P<0.05 compared with the +/+ group.
CSF-1 Deficiency Resulted in Severely Disordered Stone- and M2-Related Related Gene Expressions in Renal Mϕs
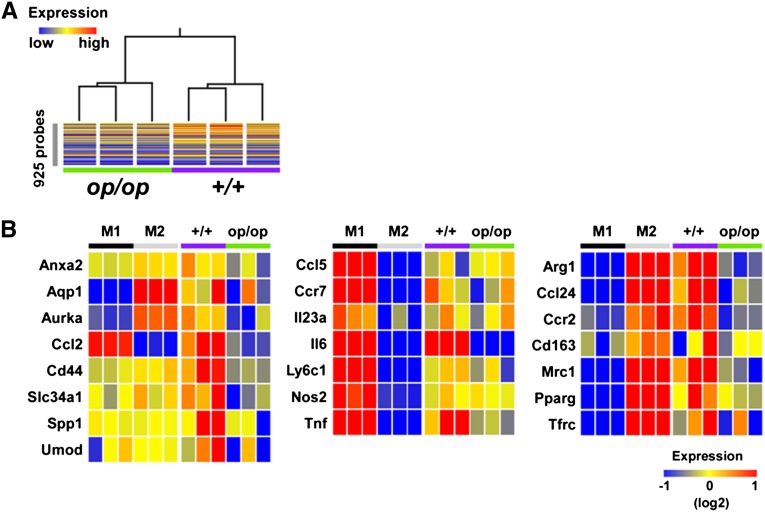
Finally, we characterized the gene expression profiles of renal Mϕs isolated from +/+ and op/op mice using DNA microarrays. As shown in Figure 10A, renal Mϕs from +/+ and op/op mice were distinguished by the hybridization signals of 925 probes corresponding to M1- and M2-abundant genes (Figure 10A, Supplemental Table 2). Moreover, Mϕs in op/op mice treated with glyoxylate for 6 days exhibited reduced expression of stone- and M2-related genes compared with Mϕs in +/+ mice. In contrast, there was negligible difference in the expressions of M1-related genes, except for Il6 and Tnf (Figure 10B).
Figure 10.
Microarray analysis of renal Mϕs sorted from +/+ and op/op mice and M1- and M2Mϕs derived from mouse bone marrow cells. M1Mϕs (M1) and M2Mϕs (M2) were prepared from wild-type mouse bone marrow. Renal Mϕs were sorted from glyoxylate-treated op/op mice (op/op) or wild-type littermates (+/+) after 6 days of treatment. (A) Cluster analysis of renal Mϕ samples obtained from +/+ and op/op mice using the expression pattern of M1- and M2-abundant genes. For the clustering analysis, we used 925 probes that gave significantly different (P<0.01 and more than 4-fold) signals between the +/+ and op/op mice. (B) Heat map representation of the expression of renal stone- (left panel), M1- (center panel), and M2-related (right panel) genes.
Discussion
Previous studies of the mechanism of kidney stone formation using hyperoxaluric animal models showed intratubular crystals at the corticomedullary region.26,27 Two major pathways lead to kidney stone formation.28 One pathway involves overgrowth on interstitial apatite plaques (Randall’s plaques), which was observed in idiopathic CaOx stone formers.28–30 The other pathway involves intratubular crystal plugs in the duct of Bellini, which was observed with all other stone formers.28,31 Several studies revealed that the primary causative factors for crystal formation were increased supersaturation of the tubular fluid and attachment of crystals to undifferentiated tubular epithelial cells by crystal binding molecules, such as OPN, CD44, and ANX2.32–35 In this study, CSF-1–deficient mice retained large crystals in the tubular lumen at the papilla, similar to human nephrolithiasis with hyperoxaluric status.28
Serum biochemistry showed no statistical differences between the three genotypes. On day 0, the urinary volumes were significantly lower in op/op mice than in the other two groups. However, there were no differences in urinary volumes on days 0 and 6, urinary biochemistries with both concentrations (Supplemental Table 1), and 24-hour urine excretion between the +/+ and op/op mice. Therefore, it remains unclear how differences in urinary volume affect crystal formation. There were no other differences in Ca, P, Mg, and oxalate excretion on day 6, irrespective of CSF-1 treatment; therefore, CSF-1 treatment may not affect these minerals or oxalate metabolism.
Oxalate exposure promotes the adherence of crystals to renal epithelial cells and differentially modulates the genes required for molecular functions, biologic pathways, and cellular components, particularly by suppressing genes.36,37 Therefore, we investigated changes in the expression of genes encoding molecules related to crystal binding. OPN is an inflammatory chemokine and major component of the stone matrix,38,39 and it plays a key role in CaOx stone formation.40,41 The CD44 antigen acts as a receptor for hyaluronic acid and OPN, and it is related to the phagocytic function of Mϕs42 and OPN-induced Mϕ accumulation.43 It also plays a role in Mϕ migration during kidney stone formation.2 MCP-1 promotes the migration and aggregation of monocytes and Mϕs to inflammatory regions of injured tissues.3 Exposure to COM crystals increased MCP-1 expression in RTCs.4 Spp1, Cd44, Anxa2, and Ccl2 expression and crystal deposition were higher in op/op mice than in other genotypes. Immunohistochemical staining revealed OPN, CD44, ANX2, and MCP-1 expression in tubular epithelial cells in both pericrystal regions and other lumens. In addition, the expression of these genes was decreased significantly at both the mRNA and protein levels after CSF-1 treatment. Thus, CSF-1 deficiency is associated with the promotion of crystal formation by increased expression of crystal binding and related molecules.
There were no differences between the three genotypes in the resident pan-Mϕs F4/80 and CD68 during hyperoxaluric statement. Therefore, renal resident pan-Mϕs were induced simultaneously in the kidney during crystal formation, and this induction was independent of CSF-1 function. These results suggest that CSF-1 deficiency induced inflammation independent of the undifferentiated immune cell function.
Membrane surface markers, such as CD11c, identify M1Mϕs. They also produce chemokines and cytokines, such as iNOS, TNFα, IL-6, and MCP-1. In contrast, M2Mϕs express the scavenger receptor CD163, mannose receptor CD206, and Ym-1 and produce chemokines and cytokines, including arginase-1, TGF-β, and IL-10.44–47 M2Mϕs promote cell proliferation, reduce apoptosis, stimulate angiogenesis,44 facilitate muscle injury repair,48 and regenerate the growth response of sensory axons after spinal cord injury.49 They also reduce glomerular cell injury and proteinuria through the angiotensin type 1 receptor,50 and they affect the resolution of ischemia-reperfusion injury.17,19,20
Because the expression of M1-related genes and iNOS in the renal interstitial space on day 0 was comparable between the three genotypes, CSF-1 deficiency did not affect the expression of these genes in the kidney. According to flow cytometry analysis, there were no differences in M1-like Mϕ expression between the +/+ and op/op groups, suggesting that CSF-1 deficiency did not contribute to a shift to M1-type renal Mϕs. However, the increased expression of these genes from day 0 to 6 and the decreased expression of Nos2, Tnf, and II6 after CSF-1 treatment suggest that hyperoxaluria promotes the expression of inflammatory M1-related genes, which was suppressed by CSF-1 treatment. Our data provide no evidence of a correlation between M1-like Mϕs and the promotion of renal crystal formation.
In contrast, there were significantly fewer renal M2-like Mϕs (CD11b+F4/80+CD163+CD206hi) in the op/op group than the +/+ group. In +/+ mice, the M2-like Mϕ population increased after glyoxylate treatment, which was enhanced by CSF-1. These results suggest that M2-like Mϕs were recruited through a CSF-1–dependent pathway in the hyperoxaluric kidney. Our finding that the expression of M2-related genes, such as Arg1 and Chi3l3, was lower in op/op than +/+ mice but increased by CSF-1 treatment strengthens this hypothesis in terms of renal crystal formation. Because a significant decrease in M2Mϕ levels in op/op mice resulted in an increase in both renal crystal deposition and urinary crystal excretion, M2Mϕs could reduce renal crystal deposition by reducing crystal formation or crystal retention and deposition in the kidney.
To identify the specific role of M2Mϕs, we assessed the in vitro crystal phagocytic ability of BMM-derived M1/M2Mϕs and the direct effect of M2Mϕ transfusion on crystal formation in vivo. M2Mϕs had a significantly greater ability to phagocytize COM crystals than RTCs and M1Mϕs, and transfusion of M2Mϕs suppressed renal crystal deposition. These results suggest that M2Mϕs directly suppress renal crystal formation by phagocytizing crystals. In addition, Spp1 and Cd44 expressions were higher in M2Mϕs at 0 hours in the in vitro study, and microarray analysis revealed increased Spp1 and Cd44 expressions in Mϕs from +/+ compared with op/op mice. Neutralization of CD44 and MCP-1 increased the COM phagocytic ability of M2Mϕs. Because both MCP-1 and CD44 are related to tissue inflammation and inflammatory-related Mϕ migration,51,52 inhibiting these molecules could reduce renal crystal formation by increasing M2 phagocytic activity. Interestingly, renal Mϕs sorted from op/op mice expressed lower levels of stone- and M2-related genes based on microarray analysis. Some genes listed in Figure 10A (such as Aqp1, Aurka, and Slc34a1) inhibit the development of renal stones,53,54 suggesting that CSF-1 deficiency resulted in severely impaired defense against crystal formation in Mϕs.
In conclusion, this study provides compelling evidence that CSF-1–deficient mice had markedly increased renal crystal deposition and that the reintroduction of CD11b+F4/80+CD163+CD206hi M2-like Mϕs by CSF-1 treatment reduced renal crystal deposition and CaOx crystal formation. We also showed that M2Mϕ transfusion directly suppressed crystal formation and the marked crystal phagocytic ability of M2Mϕs. This study is the first report showing that CSF-1 signaling suppresses renal crystal formation by inducing M2Mϕs.
Concise Methods
Animal Procedures and Genotyping
All experimental procedures were performed in accordance with the National Institutes of Health Guide for the Care and Use of Laboratory Animals, conformed to the Regulations for Animal Experimentation at Nagoya City University, and were reviewed by the Institutional Laboratory Animal Care and Use Committee of Nagoya City University.
A breeding pair of heterozygous B6C3Fe-a/a-Csf1op mice (+/op) was purchased from Charles River Japan Inc. (Yokohama, Japan). Heterozygous (+/op) mice were mated to yield mice with a homogeneous genetic background. The mice were fed standard chow (containing 1.01/100 g calcium, 0.78/100 g phosphorus, and 0.21/100 g magnesium; Oriental Yeast Co., Tokyo, Japan) and had free access to water. CSF-1–deficient mice were fed a powdered diet, because they lack incisors. The genotypes of the progeny from the heterozygous crosses were determined using TaqMan genotyping assays. Genomic DNA samples were extracted from tail tissue using custom designed TaqMan probe sets (Applied Biosystems, Foster City, CA).
We divided the 8-week-old male mice into three groups according to their genotypes: wild type (+/+), heterozygous (+/op), and homozygous (op/op). Based on our previous report,25 the mice were given daily intra-abdominal injections of 80 mg/kg glyoxylate; then, the kidneys were extracted, and blood and 24-hour urine samples were collected on days 0 and 6 (n=6 per group) to examine crystal formation. Blood biochemistry and urinary calcium, phosphorus, creatinine, and magnesium analyses were conducted by Mitsubishi Chemical Medicine (Tokyo, Japan). Urinary pH and volumes were measured manually. Urinary oxalate concentrations were analyzed using FOM-110A (Hokuto Denko Co., Tokyo, Japan).55 The urine was centrifuged at 1500×g for 15 minutes, and 100-μl sediment samples were observed at ×400 magnification using light optical microphotography (AX80; Olympus, Tokyo, Japan) to detect and quantify the number of CaOx crystals.
Supplementation with Recombinant Human CSF-1
To investigate the role of CSF-1 in kidney crystal formation, mice of each genotype were injected subcutaneously with 5 μg purified recombinant human CSF-1, with concomitant glyoxylate administration daily for 6 days as described previously.19,56 Recombinant human CSF-1 was purchased from Miltenyi Biotec, Inc. (Auburn, CA).
Induction of M1Mϕs and M2Mϕs from Bone Marrow Cell Cultures
BMMs grown in lymphocytes and 10% l-conditioned medium were generated as described previously.57 On day 7, adherent cells were harvested and seeded at a density of 1.0×10⁵ cells/cm2. For priming experiments, BMMs were stimulated for 20 hours with 100 ng/ml LPS (Sigma-Aldrich) and 20 ng/ml GM-CSF (R&D Systems) for M1Mϕs or 50 ng/ml IL-4 (R&D Systems) and 10 ng/ml M-CSF (Miltenyi Biotec, Inc.) for M2Mϕs.58,59
Transfusion of In Vitro–Derived M2Mϕs
After the culture and differentiation of M2Mϕs from BMMs, the M2Mϕs were counted, and 1.0×10⁶ viable cells were suspended in 0.2 ml serum-free medium. These cells were then transfused by a single tail vein injection 1 day before glyoxylate administration as described previously.60,61
Evaluation of COM Crystal Internalization by RTCs, M1Mϕs, and M2Mϕs
Fluorescence-labeled COM crystals were prepared as described in detail previously.62 The COM crystals were made from a mixture of 5 mM CaCl2·2H2O and 0.5 mM Na2C2O4 in buffer containing 90 mM Tris⋅HCl and 10 mM NaCl. Briefly, the COM crystals were crystallized as described earlier but in the presence of 0.58 μg/ml rabbit anti-mouse IgG conjugated with Alexa Fluor 488 (Life Technologies, Carlsbad, CA).
We used murine renal tubular epithelial cells (M-1; American Type Culture Collection, Manassas, VA) and M1Mϕs and M2Mϕs that had been induced from BMMs as described above. Cells of each type (1.0×10⁵ cells/cm2) were grown in six-well culture dishes (Nagle Nunc, Naperville, IL). The cells were maintained in a humidified incubator at 37°C with 5% CO2 for 24 hours and then treated with 25 μg/cm2 fluorescence-labeled COM crystals. Each group of cultured cells was harvested after 0, 1, 6, and 24 hours of COM treatment and used for flow cytometry and RT-PCR.
For the neutralization of crystal binding molecules, 2 μg/ml OPN antibody (R&D Systems),63 2 μg/ml MCP-1 antibody (R&D Systems),64 and 10 μg/ml CD44 antibody (Calbiochem)65 were added to dishes of M1Mϕs and M2Mϕs 6 hours before COM treatment.
Enrichment of Renal Mononuclear Cells by Magnetic Sorting
We prepared single cell suspensions from mouse kidneys by digestion with 500 μg/ml collagenase II and 10 ng/ml DNase I (Sigma-Aldrich). CD11b+ and/or CD11c+ cells in the kidney single cell suspensions were then enriched using mouse CD11b− or CD11c− microbeads and auto-MACS (Miltenyi Biotec, Inc.) using the manufacturer’s protocol.
Flow Cytometry
Single cell suspensions of CD11b and/or CD11c cells from mouse kidneys and BMM-derived M1/M2Mϕs were stained with V450-labeled rat anti-mouse Ly-6C (BD Horizon), V510-labeled anti-mouse CD45 (BioLegend, San Diego, CA), FITC-labeled rat anti-mouse CD11b (BD Pharmingen), PE-labeled hamster anti-mouse CD11c (BD Pharmingen), CD163 (M-96; Santa Cruz Biotechnology), goat anti-rabbit IgG, F(ab′)2-PE-Cy7 (Santa Cruz Biotechnology), APC-labeled anti-mouse CD206 (MMR; BioLegend), and APC/Cy7-labeled anti-mouse F4/80 antibodies (BioLegend). Renal mononuclear (1.0–8.0×10⁵) and cultured M1/M2Mϕ (1.0–5.0×10⁵) cells were harvested using a FACS CantoII (Becton Dickinson, San Jose, CA), and data were analyzed using FlowJo software 7.6.5 (Tree Star, Palo Alto, CA).
Detection of Kidney CaOx Crystals
Crystal formation in the extracted mouse kidneys was examined using Pizzolato staining as described previously.66 To confirm that the positively stained materials were crystals, nonstained sections were observed using polarized light optical microphotography (AX80; Olympus, Tokyo, Japan). We also observed crystal deposits in renal parenchyma with three-dimensional imaging using an in vivo x-ray μCT system (R_mCT2; Rigaku, Tokyo, Japan) to determine spatial structure. Crystal formation, calculated as the percent area of CaOx crystal deposition per kidney section, was assessed quantitatively using Image Pro Plus (Media Cybernetics, Inc., Bethesda, MD).
Scanning EM was performed to observe the superstructure of generated crystals. The paraffin-embedded sections were dewaxed and washed with phosphoric acid buffer. Then, sections were refixed with 2.5% glutaraldehyde first and then, 2% osmium tetroxide. Dehydration was performed using a 50%–100% ethanol series. The samples were embedded in epoxy resin, coated with platinum, and then photographed with a scanning electron microscope (S-4800; Hitachi, Tokyo, Japan).
X-Ray Diffraction of Crystals
The components of inorganic calcification were determined with x-ray diffraction. One half of the section of the extracted kidney of the op/op genotype was frozen, crushed, and placed in a sample holder, and qualitative and quantitative analyses were performed with SmartLab (Rigaku, Tokyo, Japan).
Immunohistochemical Staining
OPN, CD44, ANX2, MCP-1, and F4/80 were immunohistochemically stained on 4-μm-thick renal cross-sections as described previously.2 Anti-mouse OPN rabbit polyclonal antibody (IBL Co. Ltd., Gunma, Japan), anti-mouse CD44 rat monoclonal antibody (BioLegend), anti-mouse ANX2 rabbit polyclonal antibody (Abcam, Inc., Cambridge, MA), anti-mouse MCP-1 rat monoclonal antibody (Monosan, Uden, The Netherlands), and anti-mouse F4/80 rat monoclonal antibody (Abcam) were used as primary antibodies. The reacted antibodies were detected using a Histofine Simple Stain Kit for rat or rabbit IgG (Nichirei Biosciences, Inc., Tokyo, Japan), according to the manufacturer’s instructions.
The Mϕ subtypes were detected by immunohistochemical staining for iNOS, CD163, and CD206 using the color modification method. Slides were incubated for 1 hour at 37°C with anti-mouse iNOS rabbit polyclonal antibody (Thermo Fisher Scientific, Cheshire, UK), anti-mouse CD163 rabbit polyclonal antibody (Santa Cruz Biotechnology), or anti-mouse CD206 rat monoclonal antibody (AbD Serotec, Oxford, UK). Anti-rat IgG (Alexa Fluor 594; Life Technologies) and anti-rabbit IgG (Alexa Fluor 488; Life Technologies) secondary antibodies were added and incubated for 30 minutes at 37°C. Nuclei were counterstained with 4′,6-diamidino-2-phenylindole (Dojindo Laboratories, Kumamoto, Japan) solution for 10 minutes at 37°C. After washing several times in reverse osmosis water, the slides were mounted with water-soluble mounting medium (Cosmo Bio Co. Ltd., Tokyo, Japan) and examined by confocal laser scanning microscopy (Pascal, Osaka, Japan).
Quantitative RT-PCR
For quantitative RT-PCR, total RNA was extracted from kidney tissues using an RNeasy Midi Kit (Qiagen, Hilden, Germany). All RNA samples were reverse-transcribed into cDNA using a high-capacity cDNA Reverse Transcription Kit (Applied Biosystems). To assess the expression of genes encoding crystal binding and related molecules, the annotation information for Spp1 (Mm00436767_m1), Cd44 (Mm01277163_m1), Anxa2 (Mm01150673_m1), and Ccl2 (Mm00441242_m1) were used to generate a TaqMan Gene Expression Assay product and a TaqMan MGB probe (6-carboxyfluorescein dye-labeled) for each complete mRNA sequence. For the detection of Mϕ-related genes, we used probe sets for Emr1 (Mm00802529_m1), Cd68 (Mm03047340_m1), Itgax (Mm00498698_m1), Nos2 (Mm00440502_m1), Tnf (Mm00443258_m1), Il6 (Mm00446190_m1), Cd163 (Mm00474091_m1), Mrc1 (Mm00485148_m1), Arg1 (Mm00475988_m1), Chi3l3 (Mm04213363_u1), and Il10 (Mm00439614_m1). Quantitative PCR was performed using a TaqMan FAST Universal PCR Master Mix (4352042; Applied Biosystems) with a 7500 FAST Real-Time PCR System (Applied Biosystems).23 The expression of each gene was normalized to the expression of β-actin, which was used as the internal control. The corrected expression of each gene was normalized to the average value on day 0 (+/+ group) for the in vivo study and at 0 hours (M1Mϕ group) for the in vitro study.
Western Blotting
Whole-protein extracts prepared by sonication were separated on 12.5% SDS polyacrylamide gels and transferred to Immobilon-H polyvinylidene difluoride membranes (EMD Millipore). After blocking with Tris-buffered saline (pH 7.5) –Tween 20 containing 5% skimmed milk, the membranes were incubated with anti-mouse iNOS antibody (Thermo Fisher Scientific) followed by horseradish peroxidase-conjugated secondary antibody (GE Healthcare, Piscataway, NJ). Chemiluminescent signals were visualized using enhanced chemiluminescence Western blotting detection reagents and scanned using a LAS4000 analyzer (GE Healthcare).
Microarray Analyses
cDNAs amplified using the Ovation Pico System (Nugen, San Carlos, CA) were subjected to transcriptome analysis using Agilent SurePrint G3 microarrays. Microarray data were analyzed using the GeneSpring GX 12.1 program (Agilent Technologies, Santa Clara, CA). Changes in gene expression that were more than 3-fold between groups were deemed to be significantly different (P<0.01). All microarray data were deposited in Gene Expression Omnibus (accession number GSE51466).
Statistical Analyses
All data are expressed as means±SEMs. Statistical analyses were performed by two-way repeated measures ANOVA (comparisons among three or more groups) or the Mann–Whitney U test (comparisons between two groups) using SAS, version 9.1 (SAS Institute, Inc., Cary, NC). Values of P<0.05 were considered to be statistically significant.
Disclosures
None.
Supplementary Material
Acknowledgments
This work was supported in part by Grants-in-Aid for Scientific Research 23249074, 23592374, 23592375, 23791770, 23791774, 22791481, and 21791517 from the Ministry of Education, Culture, Sports, Science, and Technology and the Ninth Research Grant of Asahi Kasei Pharma Urological Academy.
Footnotes
Published online ahead of print. Publication date available at www.jasn.org.
This article contains supplemental material online at http://jasn.asnjournals.org/lookup/suppl/doi:10.1681/ASN.2013060675/-/DCSupplemental.
References
- 1.Okada A, Yasui T, Hamamoto S, Hirose M, Kubota Y, Itoh Y, Tozawa K, Hayashi Y, Kohri K: Genome-wide analysis of genes related to kidney stone formation and elimination in the calcium oxalate nephrolithiasis model mouse: Detection of stone-preventive factors and involvement of macrophage activity. J Bone Miner Res 24: 908–924, 2009 [DOI] [PubMed] [Google Scholar]
- 2.Okada A, Yasui T, Fujii Y, Niimi K, Hamamoto S, Hirose M, Kojima Y, Itoh Y, Tozawa K, Hayashi Y, Kohri K: Renal macrophage migration and crystal phagocytosis via inflammatory-related gene expression during kidney stone formation and elimination in mice: Detection by association analysis of stone-related gene expression and microstructural observation. J Bone Miner Res 25: 2701–2711, 2010 [DOI] [PubMed] [Google Scholar]
- 3.de Water R, Noordermeer C, van der Kwast TH, Nizze H, Boevé ER, Kok DJ, Schröder FH: Calcium oxalate nephrolithiasis: Effect of renal crystal deposition on the cellular composition of the renal interstitium. Am J Kidney Dis 33: 761–771, 1999 [DOI] [PubMed] [Google Scholar]
- 4.Umekawa T, Chegini N, Khan SR: Oxalate ions and calcium oxalate crystals stimulate MCP-1 expression by renal epithelial cells. Kidney Int 61: 105–112, 2002 [DOI] [PubMed] [Google Scholar]
- 5.Grover PK, Thurgood LA, Fleming DE, van Bronswijk W, Wang T, Ryall RL: Intracrystalline urinary proteins facilitate degradation and dissolution of calcium oxalate crystals in cultured renal cells. Am J Physiol Renal Physiol 294: F355–F361, 2008 [DOI] [PubMed] [Google Scholar]
- 6.Vervaet BA, Verhulst A, Dauwe SE, De Broe ME, D’Haese PC: An active renal crystal clearance mechanism in rat and man. Kidney Int 75: 41–51, 2009 [DOI] [PubMed] [Google Scholar]
- 7.Gordon S: Alternative activation of macrophages. Nat Rev Immunol 3: 23–35, 2003 [DOI] [PubMed] [Google Scholar]
- 8.Mantovani A, Sica A, Sozzani S, Allavena P, Vecchi A, Locati M: The chemokine system in diverse forms of macrophage activation and polarization. Trends Immunol 25: 677–686, 2004 [DOI] [PubMed] [Google Scholar]
- 9.Verreck FA, de Boer T, Langenberg DM, Hoeve MA, Kramer M, Vaisberg E, Kastelein R, Kolk A, de Waal-Malefyt R, Ottenhoff TH: Human IL-23-producing type 1 macrophages promote but IL-10-producing type 2 macrophages subvert immunity to (myco)bacteria. Proc Natl Acad Sci U S A 101: 4560–4565, 2004 [DOI] [PMC free article] [PubMed] [Google Scholar]
- 10.Verreck FA, de Boer T, Langenberg DM, van der Zanden L, Ottenhoff TH: Phenotypic and functional profiling of human proinflammatory type-1 and anti-inflammatory type-2 macrophages in response to microbial antigens and IFN-gamma- and CD40L-mediated costimulation. J Leukoc Biol 79: 285–293, 2006 [DOI] [PubMed] [Google Scholar]
- 11.van der Wal AC, Das PK, Tigges AJ, Becker AE: Macrophage differentiation in atherosclerosis. An in situ immunohistochemical analysis in humans. Am J Pathol 141: 161–168, 1992 [PMC free article] [PubMed] [Google Scholar]
- 12.Woollard KJ, Geissmann F: Monocytes in atherosclerosis: Subsets and functions. Nat Rev Cardiol 7: 77–86, 2010 [DOI] [PMC free article] [PubMed] [Google Scholar]
- 13.Yasui T, Itoh Y, Bing G, Okada A, Tozawa K, Kohri K: Aortic calcification in urolithiasis patients. Scand J Urol Nephrol 41: 419–421, 2007 [DOI] [PubMed] [Google Scholar]
- 14.Reiner AP, Kahn A, Eisner BH, Pletcher MJ, Sadetsky N, Williams OD, Polak JF, Jacobs DR, Jr., Stoller ML: Kidney stones and subclinical atherosclerosis in young adults: The CARDIA study. J Urol 185: 920–925, 2011 [DOI] [PMC free article] [PubMed] [Google Scholar]
- 15.Khallou-Laschet J, Varthaman A, Fornasa G, Compain C, Gaston AT, Clement M, Dussiot M, Levillain O, Graff-Dubois S, Nicoletti A, Caligiuri G: Macrophage plasticity in experimental atherosclerosis. PLoS One 5: e8852, 2010 [DOI] [PMC free article] [PubMed] [Google Scholar]
- 16.Fujita E, Shimizu A, Masuda Y, Kuwahara N, Arai T, Nagasaka S, Aki K, Mii A, Natori Y, Iino Y, Katayama Y, Fukuda Y: Statin attenuates experimental anti-glomerular basement membrane glomerulonephritis together with the augmentation of alternatively activated macrophages. Am J Pathol 177: 1143–1154, 2010 [DOI] [PMC free article] [PubMed] [Google Scholar]
- 17.Lee S, Huen S, Nishio H, Nishio S, Lee HK, Choi BS, Ruhrberg C, Cantley LG: Distinct macrophage phenotypes contribute to kidney injury and repair. J Am Soc Nephrol 22: 317–326, 2011 [DOI] [PMC free article] [PubMed] [Google Scholar]
- 18.Zhang MZ, Yao B, Yang S, Jiang L, Wang S, Fan X, Yin H, Wong K, Miyazawa T, Chen J, Chang I, Singh A, Harris RC: CSF-1 signaling mediates recovery from acute kidney injury. J Clin Invest 122: 4519–4532, 2012 [DOI] [PMC free article] [PubMed] [Google Scholar]
- 19.Alikhan MA, Jones CV, Williams TM, Beckhouse AG, Fletcher AL, Kett MM, Sakkal S, Samuel CS, Ramsay RG, Deane JA, Wells CA, Little MH, Hume DA, Ricardo SD: Colony-stimulating factor-1 promotes kidney growth and repair via alteration of macrophage responses. Am J Pathol 179: 1243–1256, 2011 [DOI] [PMC free article] [PubMed] [Google Scholar]
- 20.Menke J, Iwata Y, Rabacal WA, Basu R, Yeung YG, Humphreys BD, Wada T, Schwarting A, Stanley ER, Kelley VR: CSF-1 signals directly to renal tubular epithelial cells to mediate repair in mice. J Clin Invest 119: 2330–2342, 2009 [DOI] [PMC free article] [PubMed] [Google Scholar]
- 21.Qiao JH, Tripathi J, Mishra NK, Cai Y, Tripathi S, Wang XP, Imes S, Fishbein MC, Clinton SK, Libby P, Lusis AJ, Rajavashisth TB: Role of macrophage colony-stimulating factor in atherosclerosis: Studies of osteopetrotic mice. Am J Pathol 150: 1687–1699, 1997 [PMC free article] [PubMed] [Google Scholar]
- 22.Wiktor-Jedrzejczak W, Bartocci A, Ferrante AW, Jr., Ahmed-Ansari A, Sell KW, Pollard JW, Stanley ER: Total absence of colony-stimulating factor 1 in the macrophage-deficient osteopetrotic (op/op) mouse. Proc Natl Acad Sci U S A 87: 4828–4832, 1990 [DOI] [PMC free article] [PubMed] [Google Scholar]
- 23.Cecchini MG, Dominguez MG, Mocci S, Wetterwald A, Felix R, Fleisch H, Chisholm O, Hofstetter W, Pollard JW, Stanley ER: Role of colony stimulating factor-1 in the establishment and regulation of tissue macrophages during postnatal development of the mouse. Development 120: 1357–1372, 1994 [DOI] [PubMed] [Google Scholar]
- 24.Yoshida H, Hayashi S, Kunisada T, Ogawa M, Nishikawa S, Okamura H, Sudo T, Shultz LD, Nishikawa S: The murine mutation osteopetrosis is in the coding region of the macrophage colony stimulating factor gene. Nature 345: 442–444, 1990 [DOI] [PubMed] [Google Scholar]
- 25.Okada A, Nomura S, Higashibata Y, Hirose M, Gao B, Yoshimura M, Itoh Y, Yasui T, Tozawa K, Kohri K: Successful formation of calcium oxalate crystal deposition in mouse kidney by intraabdominal glyoxylate injection. Urol Res 35: 89–99, 2007 [DOI] [PubMed] [Google Scholar]
- 26.Khan SR, Glenton PA, Byer KJ: Modeling of hyperoxaluric calcium oxalate nephrolithiasis: Experimental induction of hyperoxaluria by hydroxy-L-proline. Kidney Int 70: 914–923, 2006 [DOI] [PubMed] [Google Scholar]
- 27.Khan SR, Canales BK: Genetic basis of renal cellular dysfunction and the formation of kidney stones. Urol Res 37: 169–180, 2009 [DOI] [PMC free article] [PubMed] [Google Scholar]
- 28.Coe FL, Evan AP, Worcester EM, Lingeman JE: Three pathways for human kidney stone formation. Urol Res 38: 147–160, 2010 [DOI] [PMC free article] [PubMed] [Google Scholar]
- 29.Evan A, Lingeman J, Coe FL, Worcester E: Randall’s plaque: Pathogenesis and role in calcium oxalate nephrolithiasis. Kidney Int 69: 1313–1318, 2006 [DOI] [PubMed] [Google Scholar]
- 30.Miller NL, Gillen DL, Williams JC, Jr., Evan AP, Bledsoe SB, Coe FL, Worcester EM, Matlaga BR, Munch LC, Lingeman JE: A formal test of the hypothesis that idiopathic calcium oxalate stones grow on Randall’s plaque. BJU Int 103: 966–971, 2009 [DOI] [PMC free article] [PubMed] [Google Scholar]
- 31.Khan SR: Experimental calcium oxalate nephrolithiasis and the formation of human urinary stones. Scanning Microsc 9: 89–100, 1995 [PubMed] [Google Scholar]
- 32.Asselman M, Verhulst A, De Broe ME, Verkoelen CF: Calcium oxalate crystal adherence to hyaluronan-, osteopontin-, and CD44-expressing injured/regenerating tubular epithelial cells in rat kidneys. J Am Soc Nephrol 14: 3155–3166, 2003 [DOI] [PubMed] [Google Scholar]
- 33.Kumar V, Farell G, Deganello S, Lieske JC: Annexin II is present on renal epithelial cells and binds calcium oxalate monohydrate crystals. J Am Soc Nephrol 14: 289–297, 2003 [DOI] [PubMed] [Google Scholar]
- 34.Verhulst A, Asselman M, De Naeyer S, Vervaet BA, Mengel M, Gwinner W, D’Haese PC, Verkoelen CF, De Broe ME: Preconditioning of the distal tubular epithelium of the human kidney precedes nephrocalcinosis. Kidney Int 68: 1643–1647, 2005 [DOI] [PubMed] [Google Scholar]
- 35.Vervaet BA, Verhulst A, De Broe ME, D’Haese PC: The tubular epithelium in the initiation and course of intratubular nephrocalcinosis. Urol Res 38: 249–256, 2010 [DOI] [PubMed] [Google Scholar]
- 36.Koul S, Khandrika L, Meacham RB, Koul HK: Genome wide analysis of differentially expressed genes in HK-2 cells, a line of human kidney epithelial cells in response to oxalate. PLoS One 7: e43886, 2012 [DOI] [PMC free article] [PubMed] [Google Scholar]
- 37.Koul HK, Koul S, Fu S, Santosham V, Seikhon A, Menon M: Oxalate: From crystal formation to crystal retention. J Am Soc Nephrol 10[Suppl 14]: S417–S421, 1999 [PubMed] [Google Scholar]
- 38.Kohri K, Suzuki Y, Yoshida K, Yamamoto K, Amasaki N, Yamate T, Umekawa T, Iguchi M, Sinohara H, Kurita T: Molecular cloning and sequencing of cDNA encoding urinary stone protein, which is identical to osteopontin. Biochem Biophys Res Commun 184: 859–864, 1992 [DOI] [PubMed] [Google Scholar]
- 39.Umekawa T, Yamate T, Amasaki N, Kohri K, Kurita T: Osteopontin mRNA in the kidney on an experimental rat model of renal stone formation without renal failure. Urol Int 55: 6–10, 1995 [DOI] [PubMed] [Google Scholar]
- 40.Okada A, Nomura S, Saeki Y, Higashibata Y, Hamamoto S, Hirose M, Itoh Y, Yasui T, Tozawa K, Kohri K: Morphological conversion of calcium oxalate crystals into stones is regulated by osteopontin in mouse kidney. J Bone Miner Res 23: 1629–1637, 2008 [DOI] [PubMed] [Google Scholar]
- 41.Hamamoto S, Nomura S, Yasui T, Okada A, Hirose M, Shimizu H, Itoh Y, Tozawa K, Kohri K: Effects of impaired functional domains of osteopontin on renal crystal formation: Analyses of OPN transgenic and OPN knockout mice. J Bone Miner Res 25: 2712–2723, 2010 [DOI] [PubMed] [Google Scholar]
- 42.Vachon E, Martin R, Plumb J, Kwok V, Vandivier RW, Glogauer M, Kapus A, Wang X, Chow CW, Grinstein S, Downey GP: CD44 is a phagocytic receptor. Blood 107: 4149–4158, 2006 [DOI] [PubMed] [Google Scholar]
- 43.Marcondes MC, Poling M, Watry DD, Hall D, Fox HS: In vivo osteopontin-induced macrophage accumulation is dependent on CD44 expression. Cell Immunol 254: 56–62, 2008 [DOI] [PMC free article] [PubMed] [Google Scholar]
- 44.Nelson PJ, Rees AJ, Griffin MD, Hughes J, Kurts C, Duffield J: The renal mononuclear phagocytic system. J Am Soc Nephrol 23: 194–203, 2012 [DOI] [PMC free article] [PubMed] [Google Scholar]
- 45.Ricardo SD, van Goor H, Eddy AA: Macrophage diversity in renal injury and repair. J Clin Invest 118: 3522–3530, 2008 [DOI] [PMC free article] [PubMed] [Google Scholar]
- 46.Shaul ME, Bennett G, Strissel KJ, Greenberg AS, Obin MS: Dynamic, M2-like remodeling phenotypes of CD11c+ adipose tissue macrophages during high-fat diet—induced obesity in mice. Diabetes 59: 1171–1181, 2010 [DOI] [PMC free article] [PubMed] [Google Scholar]
- 47.Liao X, Sharma N, Kapadia F, Zhou G, Lu Y, Hong H, Paruchuri K, Mahabeleshwar GH, Dalmas E, Venteclef N, Flask CA, Kim J, Doreian BW, Lu KQ, Kaestner KH, Hamik A, Clément K, Jain MK: Krüppel-like factor 4 regulates macrophage polarization. J Clin Invest 121: 2736–2749, 2011 [DOI] [PMC free article] [PubMed] [Google Scholar]
- 48.Ruffell D, Mourkioti F, Gambardella A, Kirstetter P, Lopez RG, Rosenthal N, Nerlov C: A CREB-C/EBPbeta cascade induces M2 macrophage-specific gene expression and promotes muscle injury repair. Proc Natl Acad Sci U S A 106: 17475–17480, 2009 [DOI] [PMC free article] [PubMed] [Google Scholar]
- 49.Kigerl KA, Gensel JC, Ankeny DP, Alexander JK, Donnelly DJ, Popovich PG: Identification of two distinct macrophage subsets with divergent effects causing either neurotoxicity or regeneration in the injured mouse spinal cord. J Neurosci 29: 13435–13444, 2009 [DOI] [PMC free article] [PubMed] [Google Scholar]
- 50.Ma LJ, Corsa BA, Zhou J, Yang H, Li H, Tang YW, Babaev VR, Major AS, Linton MF, Fazio S, Hunley TE, Kon V, Fogo AB: Angiotensin type 1 receptor modulates macrophage polarization and renal injury in obesity. Am J Physiol Renal Physiol 300: F1203–F1213, 2011 [DOI] [PMC free article] [PubMed] [Google Scholar]
- 51.Lan HY: Role of macrophage migration inhibition factor in kidney disease. Nephron, Exp Nephrol 109: e79–e83, 2008 [DOI] [PubMed] [Google Scholar]
- 52.Kang HS, Liao G, DeGraff LM, Gerrish K, Bortner CD, Garantziotis S, Jetten AM: CD44 plays a critical role in regulating diet-induced adipose inflammation, hepatic steatosis, and insulin resistance. PLoS One 8: e58417, 2013 [DOI] [PMC free article] [PubMed] [Google Scholar]
- 53.Yasui T, Okada A, Urabe Y, Usami M, Mizuno K, Kubota Y, Tozawa K, Sasaki S, Higashi Y, Sato Y, Kubo M, Nakamura Y, Matsuda K, Kohri K: A replication study for three nephrolithiasis loci at 5q35.3, 7p14.3 and 13q14.1 in the Japanese population. J Hum Genet 58: 588–593, 2013 [DOI] [PubMed] [Google Scholar]
- 54.Fujii Y, Okada A, Yasui T, Niimi K, Hamamoto S, Hirose M, Kubota Y, Tozawa K, Hayashi Y, Kohri K: Effect of adiponectin on kidney crystal formation in metabolic syndrome model mice via inhibition of inflammation and apoptosis. PLoS One 8: e61343, 2013 [DOI] [PMC free article] [PubMed] [Google Scholar] [Retracted]
- 55.Honda K, Yoshimura M, Rao TN, Fujishima A: Electrogenerated chemiluminescence of the ruthenium Tris(2,2′)bipyridyl/amines system on a boron-doped diamond electrode. J Phys Chem B 107: 1653–1663, 2003 [Google Scholar]
- 56.Umeda S, Takahashi K, Shultz LD, Naito M, Takagi K: Effects of macrophage colony-stimulating factor on macrophages and their related cell populations in the osteopetrosis mouse defective in production of functional macrophage colony-stimulating factor protein. Am J Pathol 149: 559–574, 1996 [PMC free article] [PubMed] [Google Scholar]
- 57.Lari R, Fleetwood AJ, Kitchener PD, Cook AD, Pavasovic D, Hertzog PJ, Hamilton JA: Macrophage lineage phenotypes and osteoclastogenesis—complexity in the control by GM-CSF and TGF-beta. Bone 40: 323–336, 2007 [DOI] [PubMed] [Google Scholar]
- 58.Fleetwood AJ, Lawrence T, Hamilton JA, Cook AD: Granulocyte-macrophage colony-stimulating factor (CSF) and macrophage CSF-dependent macrophage phenotypes display differences in cytokine profiles and transcription factor activities: Implications for CSF blockade in inflammation. J Immunol 178: 5245–5252, 2007 [DOI] [PubMed] [Google Scholar]
- 59.Hamers AA, Vos M, Rassam F, Marinković G, Kurakula K, van Gorp PJ, de Winther MP, Gijbels MJ, de Waard V, de Vries CJ: Bone marrow-specific deficiency of nuclear receptor Nur77 enhances atherosclerosis. Circ Res 110: 428–438, 2012 [DOI] [PubMed] [Google Scholar]
- 60.Zheng D, Wang Y, Cao Q, Lee VW, Zheng G, Sun Y, Tan TK, Wang Y, Alexander SI, Harris DC: Transfused macrophages ameliorate pancreatic and renal injury in murine diabetes mellitus. Nephron, Exp Nephrol 118: e87–e99, 2011 [DOI] [PubMed] [Google Scholar]
- 61.Oh DY, Morinaga H, Talukdar S, Bae EJ, Olefsky JM: Increased macrophage migration into adipose tissue in obese mice. Diabetes 61: 346–354, 2012 [DOI] [PMC free article] [PubMed] [Google Scholar]
- 62.Chaiyarit S, Thongboonkerd V: Changes in mitochondrial proteome of renal tubular cells induced by calcium oxalate monohydrate crystal adhesion and internalization are related to mitochondrial dysfunction. J Proteome Res 11: 3269–3280, 2012 [DOI] [PubMed] [Google Scholar]
- 63.Li H, Liu Y, Zhang Q, Jing Y, Chen S, Song Z, Yan J, Li Y, Wu X, Zhang X, Zhang Y, Case J, Yu M, Ingram DA, Yang FC: Ras dependent paracrine secretion of osteopontin by Nf1+/- osteoblasts promote osteoclast activation in a neurofibromatosis type I murine model. Pediatr Res 65: 613–618, 2009 [DOI] [PubMed] [Google Scholar]
- 64.Kawada M, Seno H, Kanda K, Nakanishi Y, Akitake R, Komekado H, Kawada K, Sakai Y, Mizoguchi E, Chiba T: Chitinase 3-like 1 promotes macrophage recruitment and angiogenesis in colorectal cancer. Oncogene 31: 3111–3123, 2012 [DOI] [PMC free article] [PubMed] [Google Scholar]
- 65.Raheja LF, Genetos DC, Yellowley CE: Hypoxic osteocytes recruit human MSCs through an OPN/CD44-mediated pathway. Biochem Biophys Res Commun 366: 1061–1066, 2008 [DOI] [PubMed] [Google Scholar]
- 66.Pizzolato P: Histochemical recognition of calcium oxalate. J Histochem Cytochem 12: 333–336, 1964 [DOI] [PubMed] [Google Scholar]
Associated Data
This section collects any data citations, data availability statements, or supplementary materials included in this article.


