

SUMMARY
Species of Aspergillus produce a diverse array of secondary metabolites, and recent genomic analysis has predicted that these species have the capacity to synthesize many more compounds. It has been possible to infer the presence of 55 gene clusters associated with secondary metabolism in Aspergillus flavus; however, only three metabolic pathways—aflatoxin, cyclopiazonic acid (CPA) and aflatrem—have been assigned to these clusters. To gain an insight into the regulation of and to infer the ecological significance of the 55 secondary metabolite gene clusters predicted in A. flavus, we examined their expression over 28 diverse conditions. Variables included culture medium and temperature, fungal development, colonization of developing maize seeds and misexpression of laeA, a global regulator of secondary metabolism. Hierarchical clustering analysis of expression profiles allowed us to categorize the gene clusters into four distinct clades. Gene clusters for the production of aflatoxins, CPA and seven other unknown compound(s) were identified as belonging to one clade. To further explore the relationships found by gene expression analysis, aflatoxin and CPA production were quantified under five different cell culture environments known to be conducive or nonconducive for aflatoxin biosynthesis and during the colonization of developing maize seeds. Results from these studies showed that secondary metabolism gene clusters have distinctive gene expression profiles. Aflatoxin and CPA were found to have unique regulation, but are sufficiently similar that they would be expected to co‐occur in substrates colonized with A. flavus.
INTRODUCTION
Aspergillus flavus first came to notoriety for its production of the highly carcinogenic secondary metabolite aflatoxin. Aflatoxins represent a family of mycotoxins that occur worldwide in several important food and feed crops, including maize, peanuts and seeds of nut trees, colonized by A. flavus or Aspergillus parasiticus. Aflatoxin B1 (AF) is the most carcinogenic member of the family and that most carefully studied. The presence of aflatoxins in food and feed is regulated by the Food and Drug Administration in the USA, and by other agencies in most countries. Because of health concerns and the worldwide distribution of AF contamination, environmental and genetic regulation of the AF biosynthetic pathway has been studied extensively since its discovery in the early 1960s (Bhatnagar et al., 2006; Georgianna and Payne, 2008; Yu and Keller, 2005).
Aflatoxins are not the only mycotoxins produced by A. flavus. Over 14 described mycotoxins are known to be produced by A. flavus (see http://www.aspergillus.org.uk), although 10 of these are derived from the AF biosynthetic pathway. All characterized mycotoxins in A. flavus are secondary metabolites produced by genes organized in physical clusters throughout the genome. Genomic analysis of A. flavus has led to the prediction of 55 secondary metabolism gene clusters by the Secondary Metabolite Unknown Regions Finder (smurf), available at http://www.jcvi.org/smurf (N. Khaldi et al., Smurfit Institute of Genetics, Trinity College, Dublin, Ireland and Department of Infectious Disease, The J. Craig Venter Institute, Rockville, MD, USA). Cluster prediction was performed using the smurf program which searches for genes encoding multifunctional enzymes (called backbone genes by smurf) associated with four classes of secondary metabolites. These included nonribosomal peptide synthetases (NRPSs) for nonribosomal peptides, polyketide synthases (PKSs) for polyketides, hybrid NRPS–PKS enzymes for hybrids and prenyltransferases (PTRs) for terpenoids (Hoffmeister and Keller, 2007; Keller et al., 2005). The structures for aflatoxin, a polyketide, and cyclopiazonic acid (CPA), a hybrid NRPS–PKS, are shown in Fig. 1. Once these putative multifunctional enzymes are identified, smurf explores neighbouring genes for domains commonly found in enzymes associated with secondary metabolism. This process defines the extent of the physical genomic regions for each identified cluster.
Figure 1.
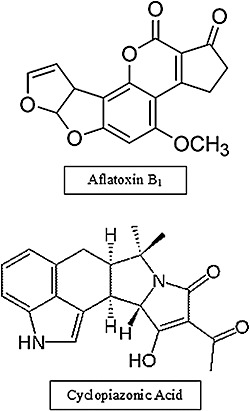
Structures of aflatoxin B1 (top) and cyclopiazonic acid (bottom).
The metabolites produced by most of the 55 predicted secondary metabolism clusters in A. flavus are unknown. The fact that one secondary metabolism cluster can produce numerous products suggests that A. flavus has the potential to produce a very diverse repertoire of secondary metabolites. Although secondary metabolites are, by definition, not essential, they play many important roles. As an example they can be important in host–pathogen relationships, with some providing protection against environmental stresses as well as fungivory (Rohlfs et al., 2007). Many secondary metabolites also include beneficial products for human health, such as the antibiotic penicillin and the cholesterol‐lowering drug lovastatin (Endo et al., 1976; Hoffmeister and Keller, 2007; Keller et al., 2005). Thus, understanding the conditions under which the genes of these clusters are expressed may allow us to predict when these compounds may be found in food and feed, as well as give potential clues for ecological roles.
We recently began a series of studies examining gene expression in A. flavus with a whole‐genome Affymetrix GeneChip. Expression datasets were collected from a variety of experimental conditions. These conditions included field inoculation of maize kernels, inoculation of kernels in different stages of development, inoculation of autoclaved mature kernels and kernel tissues, incubation of infected kernels at temperatures conducive and nonconducive for AF biosynthesis, and field inoculation of maize with Aspergillus oryzae, a species thought to be domesticated from A. flavus, which is commonly used for food fermentations (Payne et al., 2006). Other experiments have examined the effect of AF conducive and nonconducive culture media and temperature, and the effect of laeA, a global secondary metabolism regulator of gene expression (Kale et al., 2008). LaeA misexpression was also examined during conditions favourable for sclerotia development (S. Horowitz‐Brown et al., unpublished work). The overall goal of these studies was to better understand the factors governing the morphological development, secondary metabolism biosynthesis and pathogenicity of A. flavus.
The goals of our study were to establish the expression patterns of the putative secondary metabolism clusters under a variety of experimental conditions and to associate gene clusters with known functions to others having no currently accepted roles. We hypothesized that the variety of conditions examined would result in the identification of groups of secondary metabolites that are likely to be produced under similar conditions or environments. We show that the genes expressed in the cluster responsible for the secondary metabolite CPA share a similar transcription profile with genes in the AF cluster.
RESULTS
Transcriptional analysis of 55 predicted gene clusters in A. flavus
Expression data obtained from 28 experiments (Table 1) were used to identify patterns among the genes in the 55 different secondary metabolism clusters predicted by smurf. A hierarchical clustering analysis was used to determine which clusters showed the most similar patterns of transcription over the 28 conditions. Attempts to use all of the predicted genes contained within each of the 55 secondary metabolism clusters yielded results that were not easily interpreted. Therefore, the genes encoding the ‘backbone’ enzymes predicted with smurf for each cluster were chosen (Table 2). These enzymes are likely to be essential for metabolite biosynthesis, and our assumption is that the expression of the corresponding gene should be representative of gene cluster biosynthetic activity. In 13 of the 55 clusters, more than one backbone gene was found. Another advantage of the method used was that it was not affected by errors in predicted cluster boundaries. Our method is not biased by the expression of nonenzymatic genes within the cluster, such as transcription factors, which may follow a different expression pattern from other genes within a secondary metabolism gene cluster (O'Brian et al., 2007).
Table 1.
Experimental conditions used for the analysis of secondary metabolism gene clusters.
| Number | Name | Description |
|---|---|---|
| 1 | Blister | Inbred maize line B73 kernels identified at the blister, milk, dough and dent stages of development were used for each treatment. Pin‐bar needles were dipped into a 1E6 conidia/mL conidial suspension of NRRL3357. The needles were then inserted into a row of kernels, introducing approximately 11–13 conidia into each kernel. Five rows were inoculated per ear and harvested after 4 days |
| 2 | Milk | |
| 3 | Dough | |
| 4 | Dent | |
| 5 | Autoclaved endosperm | Kernels from maize line B73 were autoclaved and dissected to include the endosperm, germ or whole kernel. Tissue sections were placed in vials, inoculated with 1E5 conidia NRRL3357 and incubated at 29 °C for 5 days |
| 6 | Autoclaved germ | |
| 7 | Autoclaved whole kernel | |
| 8 | B73 48 h | At the late milk–early dough stage of development, maize line B73 kernels were inoculated as described above for the blister, milk, dough and dent experiments. Harvesting took place 48, 60, 72 and 96 h after inoculation |
| 9 | B73 60 h | |
| 10 | B73 72 h | |
| 11 | B73 96 h | |
| 12 | 28C maize | Kernels from maize line B73 were placed in vials, inoculated with 1E6 conidia NRRL3357 and incubated at 28 °C or 37 °C for 5 days |
| 13 | 37C maize | |
| 14 | 28C A&M | 100 mL of modified A&M medium in a 500‐mL flask were inoculated with conidia from NRRL3357 at 1E6 conidia/mL. Shake cultures (200 rpm) were grown for 24 h at either 28 or 37 °C |
| 15 | 37C A&M | |
| 16 | RIB40 maize | Inbred maize line B73 ears in the milk stage were inoculated with a pin‐bar dipped in 1E6 conidia/mL of strain NRRL3357 or RIB40 and harvested after 4 days |
| 17 | NRRL3357 maize | |
| 18 | RIB40 wheat bran | A mix of 5 g wheat bran and 5 mL dH2O was autoclaved and mixed with 1E8 conidia of either strain NRRL3357 or RIB40 and analysed after 2 days of growth |
| 19 | NRRL3357 wheat bran | |
| 20 | WT 6 h | 50 mL liquid YEP medium (6% peptone, 2% yeast extract) was inoculated with 10E6 conidia/mL of A. flavus NRRL 3357, an laeA deletion strain or an laeA overexpression strain in 50‐mL flasks, incubated with shaking at 250 rpm at 29 °C. After 24 h, the mycelium was collected and incubated in the aflatoxin‐stimulating YEP medium for 6 and 24 h (220 rpm, 29 °C) |
| 21 | WT 24 h | |
| 22 | laeA deletion 6 h | |
| 23 | laeA deletion 24 h | |
| 24 | laeA OE 6 h | |
| 25 | laeA OE 24 h | |
| 26 | WT sclerotia | 10E5 conidia were inoculated into liquid glucose minimal media (GMM) + 2% sorbitol in a 60 × 15‐mm Petri plate. The plates were incubated at 29 °C under continuous darkness for 6 days |
| 27 | laeA deletion sclerotia | |
| 28 | laeA OE sclerotia |
Table 2.
Secondary metabolism gene clusters and accession numbers for backbone enzymes predicted by smurf.
| Cluster | Gene name | Accession |
|---|---|---|
| 1 | Polyketide synthase, putative | AFLA_002900 |
| 2 | Dimethylallyl tryptophan synthase, putative | AFLA_004300 |
| 4 | Nonribosomal peptide synthetase, putative | AFLA_005440 |
| 5 | Polyketide synthase PksP | AFLA_006170 |
| 6 | Nonribosomal peptide synthetase, putative | AFLA_008770 |
| 7 | Nonribosomal peptide synthetase‐like enzyme, putative | AFLA_009120 |
| 7 | Polyketide synthase‐like enzyme, putative | AFLA_009140 |
| 8 | Polyketide synthase, putative | AFLA_010000 |
| 8 | Nonribosomal peptide synthetase, putative | AFLA_010010 |
| 8 | Nonribosomal peptide synthetase, putative | AFLA_010020 |
| 9 | Nonribosomal peptide synthetase, putative | AFLA_010580 |
| 9 | Nonribosomal siderophore peptide synthase Sid2 | AFLA_010620 |
| 10 | Conidial pigment biosynthesis scytalone dehydratase Arp1 | AFLA_016140 |
| 11 | Nonribosomal peptide synthetase‐like enzyme, putative | AFLA_023020 |
| 12 | Nonribosomal peptide synthetase‐like enzyme, putative | AFLA_028720 |
| 13 | Nonribosomal peptide synthetase, putative | AFLA_038600 |
| 14 | Enterobactin esterase IroE‐like, putative | AFLA_041050 |
| 15 | Dimethylallyl tryptophan synthase, putative | AFLA_045490 |
| 16 | L‐Ornithine N5‐oxygenase SidA | AFLA_047190 |
| 16 | Palmitoyltransferase SidR | AFLA_047200 |
| 17 | Polyketide synthase‐like enzyme, putative | AFLA_053770 |
| 17 | Polyketide synthase‐like enzyme, putative | AFLA_053780 |
| 17 | Polyketide synthase, putative | AFLA_053870 |
| 18 | Nonribosomal peptide synthetase‐like enzyme, putative | AFLA_054270 |
| 19 | Dimethylallyl tryptophan synthase, putative | AFLA_060680 |
| 20 | Polyketide synthase, putative | AFLA_062820 |
| 20 | Polyketide synthase, putative | AFLA_062860 |
| 21 | Nonribosomal peptide synthetase, putative | AFLA_064560 |
| 22 | Nonribosomal peptide synthetase, putative | AFLA_066720 |
| 23 | Hybrid nonribosomal peptide synthetase–polyketide synthase enzyme, putative | AFLA_066840 |
| 23 | Polyketide synthase, putative | AFLA_066980 |
| 24 | Nonribosomal peptide synthetase Pes1 | AFLA_069330 |
| 25 | ACV synthetase PcbAB | AFLA_070860 |
| 25 | Nonribosomal peptide synthetase‐like enzyme, putative | AFLA_070920 |
| 26 | Polyketide synthase‐like enzyme, putative | AFLA_079360 |
| 26 | Nonribosomal peptide synthetase‐like enzyme, putative | AFLA_079380 |
| 26 | Nonribosomal peptide synthetase‐like enzyme, putative | AFLA_079400 |
| 27 | Polyketide synthase, putative | AFLA_082150 |
| 28 | Nonribosomal peptide synthetase‐like enzyme, putative | AFLA_082480 |
| 29 | Dimethylallyl tryptophan synthase, putative | AFLA_084080 |
| 30 | Dimethylallyl tryptophan synthase, putative | AFLA_090190 |
| 30 | Nonribosomal peptide synthetase, putative | AFLA_090200 |
| 31 | Nonribosomal peptide synthetase‐like enzyme, putative | AFLA_095040 |
| 31 | Dimethylaniline monooxygenase, putative | AFLA_095050 |
| 33 | Nonribosomal peptide synthetase‐like enzyme, putative | AFLA_096700 |
| 33 | Nonribosomal peptide synthetase‐like enzyme, putative | AFLA_096710 |
| 33 | Polyketide synthase, putative | AFLA_096770 |
| 35 | Nonribosomal peptide synthetase‐like enzyme, putative | AFLA_101700 |
| 36 | Polyketide synthase‐like enzyme, putative | AFLA_104210 |
| 36 | Polyketide synthase‐like enzyme, putative | AFLA_104240 |
| 36 | Polyketide synthase‐like enzyme, putative | AFLA_104250 |
| 37 | Nonribosomal peptide synthetase‐like enzyme, putative | AFLA_105190 |
| 38 | Polyketide synthase, putative | AFLA_105450 |
| 39 | Polyketide synthase, putative | AFLA_108550 |
| 40 | Polyketide synthase, putative | AFLA_112840 |
| 41 | Polyketide synthase, putative | AFLA_114820 |
| 42 | Polyketide synthase, putative | AFLA_116220 |
| 43 | Polyketide synthase‐like enzyme, putative | AFLA_116500 |
| 44 | Polyketide synthase, putative | AFLA_116890 |
| 45 | Nonribosomal peptide synthetase‐like enzyme, putative | AFLA_118440 |
| 46 | Polyketide synthase, putative | AFLA_118940 |
| 46 | Polyketide synthase, putative | AFLA_118960 |
| 47 | Nonribosomal peptide synthetase‐like enzyme, putative | AFLA_119110 |
| 48 | Nonribosomal peptide synthetase‐like enzyme, putative | AFLA_121520 |
| 49 | Polyketide synthase‐like enzyme, putative | AFLA_125630 |
| 49 | Polyketide synthase‐like enzyme, putative | AFLA_125640 |
| 50 | Polyketide synthase, putative | AFLA_126710 |
| 51 | Polyketide synthase, putative | AFLA_127090 |
| 52 | Polyketide synthase, putative | AFLA_128060 |
| 53 | Nonribosomal peptide synthetase, putative | AFLA_135490 |
| 54 | aflC/pksA/pksL1/polyketide synthase | AFLA_139410 |
| 55 | Dimethylallyl tryptophan synthase, putative | AFLA_139480 |
| 55 | Hybrid polyketide synthase–nonribosomal peptide synthetase enzyme, putative | AFLA_139490 |
Distance relationships derived from the hierarchical clustering analysis revealed four discernible expression patterns, designated clades A–D (Fig. 2). Notably, a few backbone genes from the same cluster failed to group together. For example, the three backbone genes of cluster 26 exhibited expression patterns associated with clades A, C and D, respectively. It is possible that cluster 26 is more than one cluster merged together, or that it contains nonfunctional backbone genes.
Figure 2.
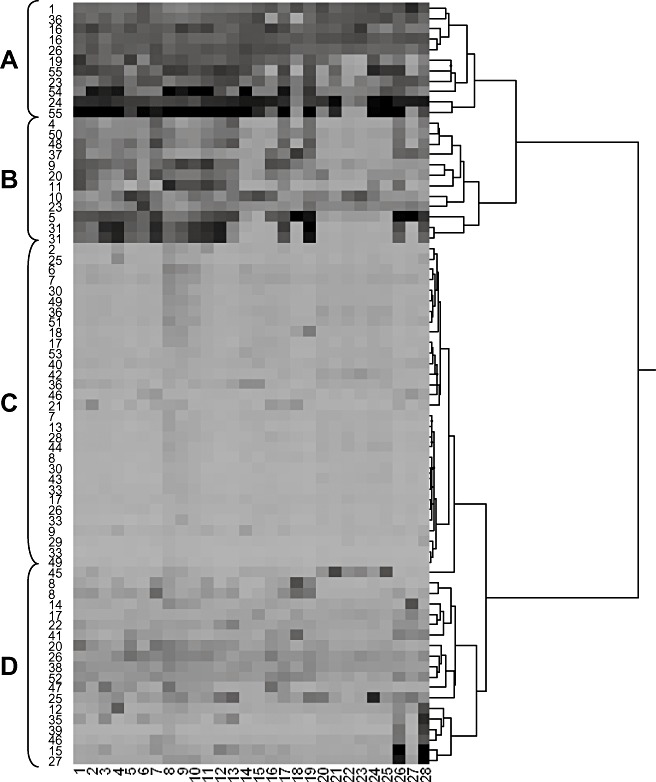
Hierarchical clustering of backbone enzymes. The cluster numbers of each backbone enzyme are given on the left. Experiments 1–28 (Table 1) are listed along the bottom. Shading represents the intensity of gene expression, with darker shading indicating higher expression. Letters A–D represent the four clades discussed in more detail in the text.
Clade A contains the aflatoxin cluster (cluster 54) and eight other predicted gene clusters (1, 16, 19, 23, 24, 26, 36 and 55). Cluster 55 was later found to be necessary for the biosynthesis of CPA. Moderate to high levels of gene expression are characteristic of this clade in most of the 28 experimental conditions examined. On the basis of the predicted multifunctional synthases (Table 2) in these clusters, we inferred that their products would contain diverse classes of secondary metabolites, including polyketides, nonribosomal peptides, pigments and siderophores.
Clade B contains 11 gene clusters (4, 5, 9, 10, 11, 20, 23, 31, 37, 48 and 50). The characteristic of this group is low gene expression in liquid shake culture medium [A&M medium (Mateles and Adye, 1965) experiments and laeA experiments]. The expression values in other experiments were also not as high as those associated with genes in clade A.
Clade C contains genes from 25 of the 55 predicted clusters. Gene expression in these clusters appeared to be low across almost all experimental conditions. These expression results suggest that products from these clusters are not being actively synthesized under the conditions tested. For example, these metabolites may be involved in competition with other fungi, bacteria and other soil inhabitants, and only synthesized during co‐cultivation with these microorganisms.
Clade D contains 18 different gene clusters. Most of the backbone genes monitored for these clusters appeared to be only slightly more expressed than those in clade C. A group of eight clusters within clade D were highly expressed during only two conditions. Included in this small group is the aflatrem biosynthesis cluster (cluster 15). The biosynthesis of aflatrem is thought to require two clusters located on separate chromosomes (Saikia et al., 2008; Zhang et al., 2004).
Characterization of the CPA cluster
Among the nine clusters in clade A, cluster 55 is located nearest the AF cluster in the genome. Cluster 55 spans a 20‐kb region of DNA near the telomere of chromosome 3, immediately distal to the AF cluster (Fig. 3). Until recently, the genes in cluster 55 had remained uncharacterized. Tokuoka et al. (2008) reported that the PKS–NRPS gene encoded within this cluster is necessary for CPA production in A. oryzae. On the basis of its proximity to PKS, we disrupted a gene (designated dmaA) encoding a PTR with homology to dimethylallyl tryptophan synthases, and studied its function in CPA biosynthesis. By homologous recombination, we obtained a transformant, number 39, with a deleted dmaA. Integration of the disruption vector at the dmaA locus was verified by amplification of a 5‐kb DNA fragment from the mutant with PCR primers 7 and 8 (Fig. 4A,B). To determine the impact of dmaA deletion on CPA biosynthesis, transformant 39 and the wild‐type (WT) strain were grown in potato dextrose broth medium. After 24 h, the medium was analysed by liquid chromatography‐tandem mass spectrometry (LC‐MS/MS) for the presence of CPA. As can be seen in Fig. 5, a distinct peak with a mass of 337.2 Da at a retention time of 5.45 min, representing CPA, was observed in the analysis of culture medium from the WT strain, but not in culture medium from transformant 39. Two additional transformants with predicted gene deletions for dmaA were also selected, and these transformants also tested negative for CPA (data not shown).
Figure 3.
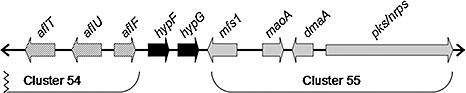
Location of cluster 55 in the genome of Aspergillus flavus. Cluster 55 is located immediately distal to the aflatoxin cluster (cluster 54, entire 70‐kb cluster not shown) near the telomere of chromosome 3. Cluster 55 spans approximately 20 kb and contains four genes: a major facilitator superfamily protein (mfs1), a flavin adenine dinucelotide oxidoreductase (maoA), a predicted dimethylallyl tryptophan synthase (dmaA) and a hybrid polyketide–nonribosomal peptide synthase. AFLA_139450 (hypF) and CO1467294 (hypG) have also been characterized in our results.
Figure 4.
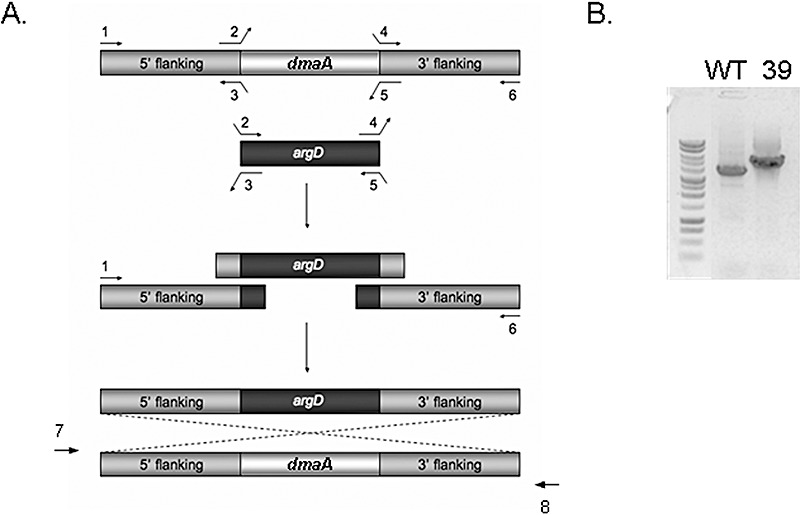
Overlap polymerase chain reaction (PCR) strategy for dmaA deletion construct and predicted integration into the genome. (A) Using overlap PCR with primers numbered 1–6, a DNA deletion construct was prepared with the upstream and downstream flanking regions of dmaA flanking the argD marker. After transformation, the presence of this construct at the dmaA locus was determined by screening DNA from the transformants with external PCR primers 7 and 8. (B) Gel showing DNA bands amplified from wild‐type (WT) and transformant 39 (39) when screened with primers 7 and 8. The PCR band of 5 kb is predicted for replacement of the WT gene, dmaA, with the deletion construct.
Figure 5.
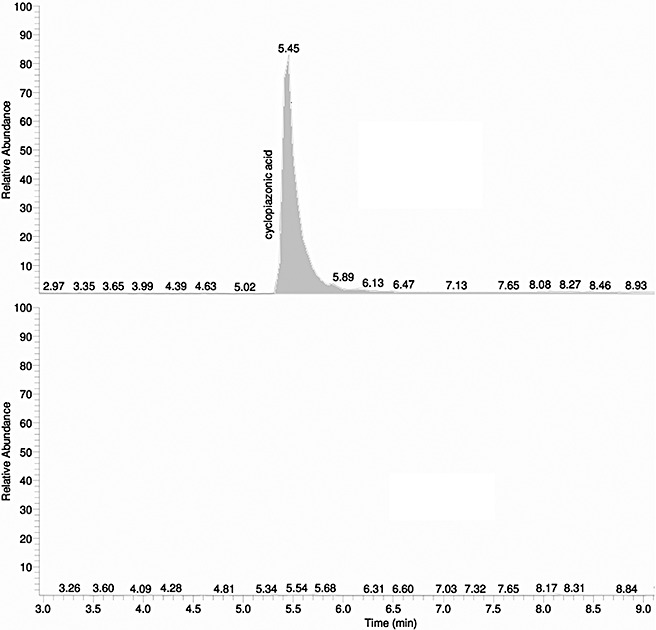
Selected ion chromatogram for cyclopiazonic acid (CPA). Full‐scan liquid chromatography‐mass spectrometry (LC‐MS) chromatogram displayed for the detection of mass 337 Da, corresponding to CPA.
We also examined the potential role of two putative genes, hypF and hypG, located between the AF cluster and the CPA cluster in AF and CPA production. hypF encodes the hypothetical protein AFLA_139450, and hypG (CO146294.10) (Fig. 3) was identified in an expressed sequence tag (EST) library. The hypG gene was not predicted during annotation of the A. flavus genome. The predicted gene product from hypG was found to have weak homology to transcription factors in Aspergillus niger and Penicillium chrysogenum. We hypothesized that they may be necessary for CPA cluster gene transcription. Both genes were deleted in strain CA14Δku70ΔpyrG. The deletion strains ΔhypF and ΔhypG were grown in potato dextrose broth medium for 48 h at 28 °C. Reverse transcriptase‐polymerase chain reaction (RT‐PCR) analysis (Fig. 6) showed that neither deletion of hypF nor hypG had an effect on the transcription of genes within the AF (aflK) or CPA (dmaA) clusters. In addition, mycotoxin analysis showed no effect on the accumulation of CPA or AF in either gene deletion mutant (data not shown). The hypG gene was clearly expressed, whereas hypF showed very weak expression (Fig. 6). Neither of the predicted genes was expressed in their respective deletion strain; however, it appears that hypF may either be needed for the expression of hypG or the promoter for hypG may be contained within hypF, as the expression of hypG was not detected in ΔhypF. Regardless, the data indicate that these two genes do not play an essential role in AF or CPA biosynthesis.
Figure 6.
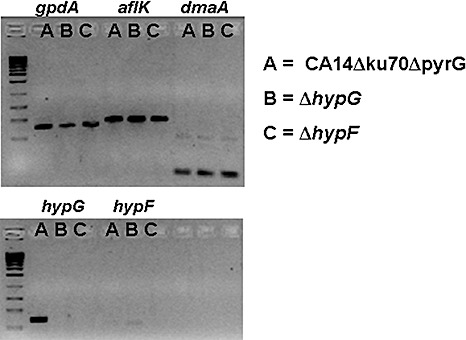
Reverse transcriptase‐polymerase chain reaction (RT‐PCR) for gene products in ΔhypG, ΔhypF and parent strain CA14Δku70ΔpyrG. Each strain was assayed for the expression of the aflatoxin cluster gene aflK, cyclopiazonic acid (CPA) cluster gene dmaA, hypG and hypF. The gpdA gene was used as a control.
Accumulation of CPA and AF
Studies have shown that many strains of A. flavus commonly produce both AF and CPA (Chang et al., 2005; Gallagher et al., 1978; Martins and Martins, 1999; Widiastuti et al., 1988). We further examined the production of these mycotoxins more closely by testing the effects of specific culture conditions that are known to affect AF biosynthesis. Concentrations of both AF and CPA increased over time (48, 60 and 96 h) in maize kernels infected by strain NRRL3357, indicating that this substrate is favourable for the production of the two mycotoxins (Fig. 7). Growth of the fungus on defined media, however, showed AF and CPA biosynthesis to respond differently to the carbon and nitrogen sources of the media and to culture temperature.
Figure 7.
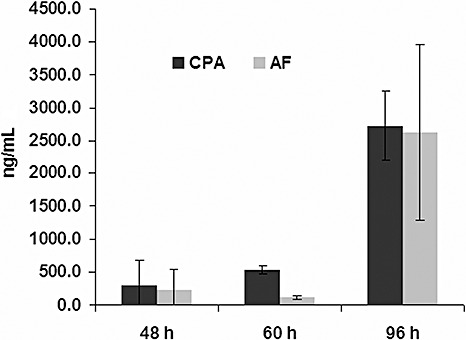
Cyclopiazonic acid (CPA) and aflatoxin (AF) concentrations in maize kernels after 48, 60 and 96 h of infection.
The medium most conducive for AF production contained sucrose as the carbon source, ammonium salt as the nitrogen source and had a pH value of 4.5 (shown as the 28 °C treatment in Fig. 8). Although CPA was produced on all media examined, the most favourable carbon and nitrogen sources for CPA production differed from those for aflatoxin production. Lactose, for example, supported the greatest amount of CPA production. Increasing the temperature from 28 to 37 °C, or the pH from pH 4.0 to pH 8.0, supported more CPA production but inhibited AF production. Addition of the anti‐oxidant gallic acid, a compound known to inhibit AF (Mahoney and Molyneux, 2004), to the medium reduced AF production but had no measurable affect on CPA production.
Figure 8.
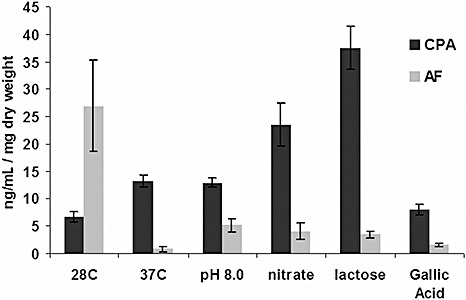
Response of cyclopiazonic acid (CPA) and aflatoxin (AF) concentrations to changes in temperature, pH, nitrogen source, carbon source and addition of the anti‐oxidant gallic acid. Each medium used for the growth of Aspergillus flavus was identical to the most AF‐conducive condition, listed as 28C, except for the modification of pH, nitrogen source, carbon source, temperature or addition of anti‐oxidant.
DISCUSSION
The results presented in Fig. 2 allow further insights into the regulation and ecological roles of secondary metabolites in A. flavus. The functions for most secondary metabolites, including CPA and AF, are not known. They are assumed to be important for niche adaptation, and thus confer a fitness advantage in particular environments. From a functional perspective, multiple secondary metabolites may have overlapping or synergistic effects to optimize fitness (Challis and Hopwood, 2003). The characterization of fungi lacking the ability to produce multiple mycotoxins may provide further insight into the potential ecological roles for these compounds.
The four different gene clusters (1, 16, 26, 36) represented in the upper grouping of clade A of Fig. 2 appear to be constitutively expressed at moderate to high levels. It is plausible that their products may have important roles in basal functions, such as the growth and development of the fungus. As an example, secondary metabolites can be important effectors of differentiation, often acting as signalling molecules known to influence sporulation and germination (Demain and Fang, 2000). Siderophores are known to influence germination through their ability to solubilize iron (Horowitz et al., 1976). Consistent with our hypothesis of these secondary metabolites being involved in basal functioning, the sidA gene, an orthologue of the A. flavus siderophore biosynthesis gene from cluster 16, has been shown to be essential for the growth of Aspergillus nidulans (Eisendle et al., 2003).
A possible ecological role for the products from the three better characterized gene clusters within the remainder of clade A [clusters 24, 54 (AF) and 55 (CPA)] could be linked to oxidative stress. CPA, produced by cluster 55, was found to prevent lipid peroxidation cause by patulin (Riley and Showker, 1991). Mutants for pes1, the NRPS in cluster 24, show increased sensitivity to oxidative stress (Reeves et al., 2006). Finally, AF, produced by cluster 54, has been proposed to be involved in the quenching of reactive oxygen (Campbell, 2005). Researchers have shown that aflatoxin is induced by oxidative stress (Jayashree and Subramanyam, 2000). In A. parasticus, deletion of the anti‐oxidant enzyme gene yapA resulted in altered timing of AF biosynthesis in culture media and maize seeds (2007, 2008). A possible functional relatedness of the products from three of the gene clusters in clade A as anti‐oxidants may be one possible explanation for their close grouping. We predict that the other secondary metabolite gene clusters in this clade may also produce metabolites that are related to oxidative stress responses as well as basal functioning.
In plants, exposure to a fungal pathogen results in many defence responses, including the production of reactive oxygen species (ROS), such as superoxide, hydrogen peroxide and hydroxyl free radicals (Ferreira et al., 2006). The potential shared functions of the three members of clade A may explain the strong expression of each of these gene clusters in living maize kernels (Fig. 2). The deletion of laeA in Aspergillus species has been shown to result in reduced pathogenicity (Bok et al., 2005; Rohlfs et al., 2007; Sugui et al., 2007), including A. flavus (Amaike and Keller, 2009; Kale et al., 2008). Although the regulation of gene clusters by LaeA, as observed in our study, extends beyond just those in clade A, it is conceivable that the lack of one of the metabolites or an antagonistic affect from a lack of all of these metabolites in the previous LaeA studies could have resulted in the decreased potential for pathogenicity/survival of A. flavus.
We observed that the metabolites in clade B of Fig. 2 were more highly expressed on solid rather than liquid medium. This led us to hypothesize that some of these clusters are involved in conidiogenesis. Within clade B, the gene pksP (alb1) from cluster 5 has been implicated in Aspergillus fumigatus for the production of dihydroxynaphthalene (DHN)‐like melanin (Tsai et al., 1998). Consistent with our hypothesis, conidia from A. fumigatus strains lacking the pksP gene appear white instead of the typical bluish‐green and smooth rather than echinulate (Tsai et al., 1998). Strains lacking pksP were also less virulent than WT strains (Langfelder et al., 1998; Tsai et al., 1998). The DHN cluster contains six different genes in a 19‐kb region in A. fumigatus (Tsai et al., 1999). The genes from this cluster do not appear to be contained within a single intact cluster in A. flavus; arp1, another gene in the A. fumigatus DHN cluster, is found in A. flavus cluster 10 (clade A). The gene arp2 does not appear to be present in A. flavus, and abr1, abr2 and ayg1 have genes sharing significant homology located elsewhere in the A. flavus genome. Among the clusters in clade B, cluster 31 appears to follow the most similar expression pattern to that of cluster 5. The only conditions that appear to contrast are expression in A. oryzae and expression in the ΔlaeA strain under sclerotia‐favouring conditions. Interestingly, ΔlaeA strains have been found to show slightly reduced conidiation (Kale et al., 2008).
For clades A and B, we observed that expression often appeared to be greater in A. flavus strain NRRL3357 relative to A. oryzae strain RIB40. The different expression patterns of these identified clusters between the two species could provide clues for their function. Expression in A. flavus and not A. oryzae, a domesticated fungus important for food fermentations, may indicate a role for these compounds unique to the ecology of A. flavus. Alternatively, but not exclusive of the role postulated above, these compounds may be toxic. During the domestication of A. oryzae, strains would have been selected for the lack of toxic compounds.
Many of the biosynthetic pathways present in A. flavus may be silent. One possible reason for low/no expression for the 25 clusters from clade C is that they may have been silenced by epigenetic factors. Researchers have observed enhanced chemical diversity when treating A. flavus and other fungal species with DNA methyltransferase inhibitors and histone deacetylase inhibitors (Shwab et al., 2007; Williams et al., 2008). It is also conceivable that secondary metabolism pathways represented in clade C could produce their respective metabolites in very low quantities, or simply be expressed in response to conditions not encountered within these experiments.
Based on our results, clade D appears to contain some metabolites that are only expressed in the dark during conditions favourable for sclerotia production. Although aflatrem has no known role, deletion of veA, a gene necessary for sclerotia formation, was found to inhibit the biosynthesis of aflatrem (Duran et al., 2007). Interestingly, several anti‐insectan products thought to prevent fungivory have been found in sclerotia (Whyte et al., 1996; Wicklow et al., 1996). We hypothesize that the six clusters within clade D (12, 15, 27, 35, 39, 46) from the subgroup that shows expression under conditions 26 and 28 will be involved in the development or survival of sclerotia. These six clusters were not expressed in the ΔlaeA strain from condition 27, which was grown under the same conditions as 26 and 28. Fittingly, ΔlaeA strains do not produce sclerotia (Kale et al., 2008).
We have more closely characterized cluster 55, which has now been shown to be necessary for CPA production (Chang et al., 2009; Tokuoka et al., 2008). Although the function of the major facilitator superfamily (MFS), predicted to be part of the CPA cluster, has not yet been verified, Chang et al. (2009) recently characterized dmaA, which they named dmaT. They also described an essential role in CPA biosynthesis for the predicted flavin adenine dinucleotide oxidoreductase in cluster 55, and named its gene maoA. The shared regulation we have observed for the four genes from cluster 55 shown in Fig. 3 provides strong evidence that they are part of a gene cluster necessary for CPA biosynthesis. Whether there are additional structural genes required for the biosynthesis of CPA, located elsewhere in the genome, is not yet known. No pathway‐specific transcription factor has been described for CPA biosynthesis and no gene with predicted sequence to a transcription factor resides in cluster 55. Chang et al. (2009) deleted a predicted zinc‐finger transcription factor found distal to PKS–NRPS, but observed no effect on CPA. This gene is on the A. flavus Affymetrix GeneChip and was not significantly transcribed under any of the 25 experimental conditions examined in this study. In addition, we have shown that the two predicted genes located between the CPA and AF clusters do not appear to be essential for the biosynthesis of either metabolite.
As the AF and CPA gene clusters are located next to each other, we also investigated whether the AF pathway‐specific transcription factor AflR could control genes in the CPA cluster. Price et al. (2006) studied the effect of AflR on gene expression by deleting the AF pathway transcription factor aflR. A closer look at the microarray data revealed no significant differences for any of the three CPA biosynthetic genes contained on the 5002‐element arrays used for this study. There is one caveat to the aflR deletion experiment regarding CPA. These studies were performed using A. parasiticus, which is not known to produce CPA (Dorner et al., 1984); however, a closer examination of the data shows a strong expression signal in both the WT and deletion mutant for two of the three genes needed for CPA production present on the 5002‐element array. This result indicates that the lack of CPA production in A. parasiticus is probably not a result of a deficiency in gene expression from these two genes.
With our newfound knowledge of the location of the CPA cluster, we were able to further explore some previous results examining A. flavus strain 649. The afl‐1 mutation in A. flavus strain 649 is the only known dominant mutation inhibiting AF biosynthesis, and thus AF biosynthesis cannot be restored in parasexual diploids resulting from the pairing of afl‐1 mutants with WT AF‐producing strains (Papa, 1979). This dominant mutation is thought to inhibit AF biosynthesis through an unknown silencing mechanism which can be overcome through the addition of ectopic copies of the pathway regulatory gene aflR (Smith et al., 2007). Strain 649 does not contain the AF cluster or the CPA cluster as a result of a large chromosomal loss. Unknown to Smith et al. (2007), when they assayed for the effects of afl‐1 on genes outside the aflatoxin cluster, one of the genes measured was the predicted dimethylallyl tryptophan synthase (dmaA) of the CPA cluster [denoted 16TV in the study by Smith et al. (2007)]. This gene was found to be expressed at WT levels in the diploid between the afl‐1 mutant strain 649 and AF‐producing strain 86. We examined the same 86×649 diploid and found it to produce CPA (data not shown), indicating that all of the genes necessary for the biosynthesis of CPA in the WT strain are expressed in the diploid. On the basis of these results, we hypothesize that, if there is a regulatory gene specific to the CPA cluster, it is at a locus outside the deleted region on chromosome 3 of the afl‐1 mutation.
Until now, very little was known about the regulation of CPA in A. flavus. CPA appears to respond more similarly to sterigmatocystin biosynthesis in A. nidulans with regard to nitrogen source. Nitrate, like temperature, affects the biosynthesis of sterigmatocystin differently from that of AF, with more sterigmatocystin being produced on nitrate rather than the more AF‐conducive nitrogen source, ammonium (Feng and Leonard, 1998). Nitrogen source, pH and carbon source are thought to directly affect the expression of genes through cis‐regulatory elements related to the environmental sensing of nitrogen, pH and carbon. The proteins that interact with these regulatory elements include global transcription factors, such as AreA for nitrogen (Caddick et al., 1994), PacC for pH (Penalva et al., 2008) and the various regulatory DNA‐binding proteins associated with carbon catabolite repression (Ebbole, 1998). Many aflatoxin genes possess these regulatory elements, but appear to respond differently from sterigmatocystin and CPA; however, proteins such as PacC can act as both activators and repressors of gene expression (Cary et al., 2006; Georgianna and Payne, 2008; Penalva et al., 2008). From these data, it appears that, although CPA does not respond identically to AF for the culture conditions tested, it responds very similarly to how we would expect sterigmatocystin to accumulate in A. nidulans. Despite the differential accumulation of CPA and AF in response to the culture medium environment, Fig. 7 shows that these two metabolites accumulate almost identically in a natural environment such as maize.
The goal of our study was to establish expression patterns and to associate gene clusters with known functions to others having no currently accepted roles. In addition, we were able to determine the identity of the metabolite produced by predicted gene cluster 55 as CPA. CPA has the potential to become an overlooked mycotoxin that could have significant health risks (Nishie et al., 1985). Our data show that, under conditions favourable for the production of AF, CPA will also probably be produced, assuming that the strain has the capacity to produce CPA. As not all strains of A. flavus produce aflatoxin, some do not produce CPA because of mutations or a loss of the gene cluster (Chang et al., 2005; Geiser et al., 2000). As both metabolites can be detected simultaneously (see Experimental procedures), it is not difficult to include CPA testing when checking for AF. In addition, CPA may be more commonly encountered than AF because of its biosynthesis by both Aspergillus and Penicillium species (Frisvad and Thrane, 2000; Hermansen et al., 1984; Le Bars, 1979; Pitt et al., 1986), and its production over a wide range of conditions.
EXPERIMENTAL PROCEDURES
Fungal strains
Aspergillus flavus strains NRRL3357, AFC‐1 and CA14Δku70ΔpyrG were used in these studies. Strain 3357‐5, a uracil auxotroph of NRRL3357 (He et al., 2007), was used to create a new strain with both an arginine and uracil requirement, called AFC‐1. This strain was created through the use of pyr4‐blaster, a plasmid containing complementary kanamycin cassette sequences flanking the pyr4 gene from Neurospora crassa. The construct is designed such that the marker gene can be forced to loop out under selection on 5‐fluoro‐orotic acid (5‐FOA) (5‐FOA is metabolized to the toxic compound fluorodeoxyuridine in strains containing an active 5′‐orotidine decarboxylase gene such as pyr4), similar to the method used by d'Enfert (1996) with pyrG in A. fumigatus (d'Enfert, 1996). The loss of this marker on growth on medium containing 5‐FOA and uracil restored the requirement for uracil in the fungus.
We used pyr4‐blaster to delete the argD gene in 3357‐5, with subsequent mutagenesis with 5‐nitroquinoline 1‐oxide (5‐NQO), as described by He et al. (2007), and selection on 5‐FOA (100 µg/mL) (Zymo Research, Orange, CA, USA)‐containing MLS medium (Czapeck‐Dox Broth (Difco) plus 0.4 m (NH4)2SO4 and 1% agar) with nucleic acid supplements uracil (7.5 mm) and uridine (7.5 mm) plus the amino acid arginine (1.5 mm) at pH 3 to create the AFC‐1 double mutant (‐pyrG, ‐argD) (note: agar was autoclaved separately and added to a filter‐sterilized pH 3 solution of the 5‐FOA‐containing medium). The 5‐NQO step was added because the background in strains simply selected on 5‐FOA was not sufficient for genetic transformations. Strain AFC‐1 shows no background when selecting against either marker, and produces AF at similar levels to the parent strains 3357 and 3357‐5.
The A. flavus strain CA14Δku70ΔpyrG has a ku70 deletion background which results in high rates of homologous recombination for more efficient gene targeting. CA14Δku70ΔpyrG was kindly provided by Perng‐Kuang Chang (Southern Regional Research Center, Agricultural Research Service, US Department of Agriculture, New Orleans, LA, USA).
Gene deletion, fungal transformation and DNA isolation
An overlap PCR method (Davidson et al., 2002) was used to create gene deletion constructs with argD as the selectable marker (Fig. 6A). Primers were designed from the DNA sequence downloaded from the genome browser (Stein et al., 2002) for A. flavus (http://www.aspergillusflavus.org). Genomic DNA from strain NRRL3357 was used as a PCR template for both the 5′ and 3′ homologous flanking regions of the genes targeted for deletion in this study. Amplification of argD included sufficient upstream sequence to include the native promoter. For fungal transformation, we used the methods suggested by He et al. (2007) and currently available at http://www.aspergillusflavus.org. The transformation selection medium, MLS, was supplemented with 1.12 g/L of uracil in order to use the argD‐containing deletion construct with strain AFC‐1. DNA was isolated from transformants for PCR‐based screening using the cetyltrimethylammonium bromide (CTAB) method described by He et al. (2007). Screening primers were designed to amplify outside of the dmaA deletion construct to screen for its integration in the genome (Fig. 6A, primers 7 and 8). Other genes were deleted in strain CA14Δku70ΔpyrG using the same method, but with pyr4 as the selectable marker, with the appropriate ∼1‐kb flanking regions and MLS as the selective medium.
Culture media for CPA and AF production
A total of five different cell culture conditions known to influence AF biosynthesis (Mahoney and Molyneux, 2004; Price et al., 2005) were tested for their effect on the accumulation of CPA and AF. NRRL3357 was grown in either A&M medium (Mateles and Adye, 1965) or A&M medium modified for carbon source (50 g/L), nitrogen source (3 g/L), pH or the presence of anti‐oxidants. All media were buffered at pH 4.5 with 100 mm citric acid, except for the pH 8.0 treatment, which was buffered with 100 mm tris(hydroxymethyl)aminomethane (Tris). The following five conditions were compared: (i) the AF‐conducive carbon source, sucrose, was compared with lactose; (ii) the AF‐conducive nitrogen source, ammonium sulphate, was compared with sodium nitrate; (iii) the AF‐conducive temperature, 28 °C, was compared with 37 °C; (iv) the AF‐conducive pH 4.5 was compared with pH 8.0; and (v) A&M medium containing 2.5 mm gallic acid (n‐propyl gallate; MP Biomedicals, Inc., Solon, OH, USA), an anti‐oxidant that inhibits AF (Mahoney and Molyneux, 2004), was compared with standard A&M medium. A 2‐mL aliquot of the medium was placed in 24‐well plates (Corning Life Sciences Inc., Lowell, MA, USA) and inoculated with A. flavus to a final concentration of 1 × 10⁶ condia/mL. The plates were wrapped with parafilm and incubated at 28 °C, except for the 37 °C treatment. Each treatment was replicated three times.
RNA isolation and RT‐PCR
Mycelia were filtered from 48 h potato dextrose broth cultures grown at 28 °C with shaking at 200 rpm using miracloth filters together with vacuum flasks. This tissue was lyophilized and used for RNA isolation with the Qiagen Plant RNeasy kit (Qiagen Inc., Valencia, CA, USA). After RNA isolation, the concentration was determined using a NanoDrop ND‐1000 spectrophotometer (NanoDrop Technologies, Wilmington, DE, USA).
A total of 3 µg of RNA was used for DNase treatment with Promega RQ1 DNase according to the manufacturer's suggestion (Promega, Madison, WI, USA). After DNase treatment, 1.5 µg of RNA was used for reverse transcription employing the first‐strand cDNA sythesis protocol for SuperScript™ II RT (Invitrogen Corp., Carlsbad, CA, USA). PCR was performed on the resulting cDNA with the appropriate gene‐specific primers with Takara ExTaq (Takara Bio, Otsu, Shiga, Japan), following the manufacturer's suggestion, with a total of 30 1‐min extension cycles. Primers were purchased from Sigma‐Aldrich (St Louis, MO, USA). PCR products were analysed on a 0.8% Tris‐acetate‐ethylenediaminetetracetic acid (TAE) agarose gel.
Microarray analysis
Data from experiments using the A. flavus Affymetrix GeneChip microarrays were imported into jmp genomics (SAS, Cary, NC, USA). All array data was deposited in the National Center for Biotechnology Information (NCBI) GEO database as experiment GSE15435. The arrays included data from the following experiments: (i) a 28 °C vs. 37 °C comparison in A&M culture medium from Georgianna et al. (2008); (ii) a 28 °C vs. 37 °C experiment on detached field‐grown corn kernels from Smith et al. (2008); (iii) a time course study in which developing seeds were inoculated in the field with A. flavus and the seeds were assayed every 24 h from 48 to 96 h; (iv) a study in which developing seeds were inoculated at four different corn development stages and assayed 4–5 days later (A.L. Dolezal et al., unpublished work); (v) A. flavus grown on either the endosperm or embryo of autoclaved corn kernels (C.P. Woloshuk et al., unpublished work); (vi) a comparison of WT A. flavus with an laeA deletion strain and laeA overexpression strain at 6 and 24 h (J. Bok and N.P. Keller, unpublished work); (vii) a comparison of A. flavus (NRRL3357) with A. oryzae (RIB40) grown on field‐inoculated corn and wheat bran koji (D.R. Georgianna et al., unpublished work); and (viii) a comparison of WT A. flavus with an laeA deletion strain and laeA overexpression strain under sclerotia‐forming conditions (S. B. Sigal et al., Department of Medical Microbiology and Immunology, Department of Plant Pathology, University of Wisconsin, Madison, WI 53706, USA). These experiments are described in further detail in Table 1. Data from each experiment were corrected for background, normalized and summarized in jmp genomics using the robust multichip average (RMA) normalization procedure (2003a, 2003b). The mean value for all replicates of each individual experiment was taken. We analysed the subset of values for all backbone genes associated with secondary metabolism clusters predicted in smurf. Hierarchical clustering using the Fast Ward procedure was performed in jmp genomics for the backbone gene expression values across all microarray experiments.
Detection and quantification of CPA and AF
All experiments were performed with the Thermo LTQ ion trap instrument (Thermo Scientific, Bremen, Germany) at the North Carolina State University Genome Sciences Laboratory (GSL; http://gsl.cals.ncsu.edu/). For the quantification of CPA and AF, standards were purchased (Sigma‐Aldrich). The solvent system used consisted of 25 mm morpholine and methanol (MeOH) at 50 µL/min on a Thermo Hypersil Gold C18 column (3 µm particle size, 150 × 1 mm). A 15‐min linear gradient was used, starting at 20% MeOH, increasing to 80% MeOH, followed by a hold at 80% MeOH for 9 min, and column equilibration at 20% MeOH for 12 min. The mass spectrometer was set to run in electrospray ionization (ESI) positive mode with six different scans: one full scan from 200 to 2000 m/z, followed by five selected ion MS/MS mode scans for 331 Da (AFG2), 329 Da (AFG1), 315 Da (AFB2), 313 Da (AFB1) and 337 Da (CPA). Metabolites were identified from MS/MS scans using the National Institute of Standards and Technology Mass Spectral Search Program. All samples used for quantification in A&M medium were diluted by 1/10th with 1 : 4 MeOH : 25 mm morpholine. The dilution of the sample and the use of the highly basic (>pH 10) morpholine limited signal‐suppressing matrix effects that were observed for CPA using undiluted sample or other carrier ions. A standard curve was created in a similar dilution of A&M medium and, for each different condition examined, a single standard addition was used to verify the accuracy and comparability of quantitative measurements. Values for the accumulation of CPA and AF in A&M medium were adjusted for dry weights by determining the mass of lyophilized tissue for each replicate. Maize samples were analysed similarly to the A&M experiments, except that the concentrations were not normalized for biomass.
Qualitative analysis, employed to determine the absence or presence of mycotoxins, was performed using a similar method with direct injection of the sample medium onto the column and no reference standards. This method was used for the detection of CPA in the deletion mutants created in this study, where the deletion was hypothesized to contain no detectable CPA.
ACKNOWLEDGEMENTS
Thanks are due to the US Department of Agriculture CSRS grant 2006‐35604‐16666 and the National Institutes of Health/North Carolina State University Molecular Biotechnology Training Program for their generous support of this research.
REFERENCES
- Amaike, S. and Keller, N.P. (2009) Distinct roles for VeA and LaeA in development and pathogenesis of Aspergillus flavus . Eukaryot. Cell, 1, 1. [DOI] [PMC free article] [PubMed] [Google Scholar]
- Bhatnagar, D. , Cary, J.W. , Ehrlich, K. , Yu, J. and Cleveland, T.E. (2006) Understanding the genetics of regulation of aflatoxin production and Aspergillus flavus development. Mycopathologia, 162, 155–166. [DOI] [PubMed] [Google Scholar]
- Bok, J.W. , Balajee, S.A. , Marr, K.A. , Andes, D. , Nielsen, K.F. , Frisvad, J.C. and Keller, N.P. (2005) LaeA, a regulator of morphogenetic fungal virulence factors. Eukaryot. Cell, 4, 1574–1582. [DOI] [PMC free article] [PubMed] [Google Scholar]
- Caddick, M.X. , Peters, D. and Platt, A. (1994) Nitrogen regulation in fungi. Antonie Van Leeuwenhoek, 65, 169–177. [DOI] [PubMed] [Google Scholar]
- Campbell, B.C. (2005) Panel Discussion: Fungal Genomics Workshop. Raleigh, NC: Aflatoxin Elimination Workshop. [Google Scholar]
- Cary, J.W. , Ehrlich, K.C. , Kale, S.P. , Calvo, A.M. , Bhatnagar, D. and Cleveland, T.E. (2006) Regulatory elements in aflatoxin biosynthesis. Mycotoxin. Res. 22, 105–109. [DOI] [PubMed] [Google Scholar]
- Challis, G.L. and Hopwood, D.A. (2003) Synergy and contingency as driving forces for the evolution of multiple secondary metabolite production by Streptomyces species. Proc. Natl. Acad. Sci. USA, 100, 14555–14561. Epub 12003 September 14511. [DOI] [PMC free article] [PubMed] [Google Scholar]
- Chang, P.K. , Horn, B.W. and Dorner, J.W. (2005) Sequence breakpoints in the aflatoxin biosynthesis gene cluster and flanking regions in nonaflatoxigenic Aspergillus flavus isolates. Fungal. Genet. Biol. 42, 914–923. Epub 2005 September 2009. [DOI] [PubMed] [Google Scholar]
- Chang, P.K. , Horn, B.W. and Dorner, J.W. (2009) Clustered genes involved in cyclopiazonic acid production are next to the aflatoxin biosynthesis gene cluster in Aspergillus flavus . Fungal. Genet. Biol. 46, 176–182. [DOI] [PubMed] [Google Scholar]
- Davidson, R.C. , Blankenship, J.R. , Kraus, P.R. , Berrios, Jesus, M. , Hull, C.M. et al. (2002) A PCR‐based strategy to generate integrative targeting alleles with large regions of homology. Microbiology, 148, 2607–2615. [DOI] [PubMed] [Google Scholar]
- Demain, A.L. and Fang, A. (2000) The natural functions of secondary metabolites. Adv. Biochem. Engl. Biotechnol. 69, 1–39. [DOI] [PubMed] [Google Scholar]
- Dorner, J.W. , Cole, R.J. and Diener, U.L. (1984) The relationship of Aspergillus flavus and Aspergillus parasiticus with reference to production of aflatoxins and cyclopiazonic acid. Mycopathologia, 87, 13–15. [DOI] [PubMed] [Google Scholar]
- Duran, R.M. , Cary, J.W. and Calvo, A.M. (2007) Production of cyclopiazonic acid, aflatrem, and aflatoxin by Aspergillus flavus is regulated by veA, a gene necessary for sclerotial formation. Appl. Microbiol. Biotechnol. 73, 1158–1168. Epub 2006 September 1119. [DOI] [PubMed] [Google Scholar]
- Ebbole, D.J. (1998) Carbon catabolite repression of gene expression and conidiation in Neurospora crassa . Fungal. Genet. Biol. 25, 15–21. [DOI] [PubMed] [Google Scholar]
- Eisendle, M. , Oberegger, H. , Zadra, I. and Haas, H. (2003) The siderophore system is essential for viability of Aspergillus nidulans: functional analysis of two genes encoding l‐ornithine N 5‐monooxygenase (sidA) and a non‐ribosomal peptide synthetase (sidC). Mol. Microbiol. 49, 359–375. [DOI] [PubMed] [Google Scholar]
- Endo, A. , Kuroda, M. and Tanzawa, K. (1976) Competitive inhibition of 3‐hydroxy‐3‐methylglutaryl coenzyme A reductase by ML‐236A and ML‐236B fungal metabolites, having hypocholesterolemic activity. FEBS Lett. 72, 323–326. [DOI] [PubMed] [Google Scholar]
- D'Enfert, C. (1996) Selection of multiple disruption events in Aspergillus fumigatus using the orotidine‐5′‐decarboxylase gene, pyrG, as a unique transformation marker. Curr. Genet. 30, 76–82. [DOI] [PubMed] [Google Scholar]
- Feng, G.H. and Leonard, T.J. (1998) Culture conditions control expression of the genes for aflatoxin and sterigmatocystin biosynthesis in Aspergillus parasiticus and A. nidulans . Appl. Environ. Microbiol. 64, 2275–2277. [DOI] [PMC free article] [PubMed] [Google Scholar]
- Ferreira, R.B. , Monteiro, S. , Freitas, R. , Santos, C.N. , Chen, Z. , Batista, L.M. , Duarte, J. , Borges, A. and Teixeira, A.R. (2006) Fungal pathogens: the battle for plant infection. Crit. Rev. Plant. Sci. 25, 505–524. [Google Scholar]
- Frisvad, J.C. and Thrane, U. (2000) Mycotoxin production by common filamentous fungi. In: Introduction to Food- and Airborne Fungi (Filtenborg O., ed.), pp. 321–331. Utrecht: Centraalbureau voor Schimmelcultures. [Google Scholar]
- Gallagher, R.T. , Richard, J.L. , Stahr, H.M. and Cole, R.J. (1978) Cyclopiazonic acid production by aflatoxigenic and non‐aflatoxigenic strains of Aspergillus flavus . Mycopathologia, 66, 31–36. [DOI] [PubMed] [Google Scholar]
- Geiser, D.M. , Dorner, J.W. , Horn, B.W. and Taylor, J.W. (2000) The phylogenetics of mycotoxin and sclerotium production in Aspergillus flavus and Aspergillus oryzae . Fungal. Genet. Biol. 31, 169–179. [DOI] [PubMed] [Google Scholar]
- Georgianna, D.R. , Hawkridge, A.M. , Muddiman, D.C. and Payne, G.A. (2008) Temperature‐dependent regulation of proteins in Aspergillus flavus: whole organism stable isotope labeling by amino acids. J. Proteome. Res. 7(7), 2973–2979. [DOI] [PubMed] [Google Scholar]
- Georgianna, D.R. and Payne, G.A. (2008) Genetic regulation of aflatoxin biosynthesis: from gene to genome. Fungal. Genet. Biol. 5, 5. [DOI] [PubMed] [Google Scholar]
- He, Z. , Price, M.S. , OBrian, G.R. , Georgianna, D.R. and Payne, G.A. (2007) Improved protocols for the functional analysis in the pathogenic fungus Aspergillus flavus . BMC Microbiol. 26, 7–104. [DOI] [PMC free article] [PubMed] [Google Scholar]
- Hermansen, K. , Frisvad, J.C. , Emborg, C. and Hansen, J. (1984) Cyclopiazonic acid production by submerged cultures of Penicillium and Aspergillus strains. FEMS Microbiol. Lett. 21, 253–261. [Google Scholar]
- Hoffmeister, D. and Keller, N.P. (2007) Natural products of filamentous fungi: enzymes, genes, and their regulation. Nat. Prod. Rep. 24, 393–416. Epub 2006 December 2020. [DOI] [PubMed] [Google Scholar]
- Horowitz, N.H. , Charlang, G. , Horn, G. and Williams, N.P. (1976) Isolation and identification of the conidial germination factor of Neurospora crassa . J. Bacteriol. 127, 135–140. [DOI] [PMC free article] [PubMed] [Google Scholar]
- Irizarry, R.A. , Bolstad, B.M. , Collin, F. , Cope, L.M. , Hobbs, B. and Speed, T.P. (2003a) Summaries of Affymetrix GeneChip probe level data. Nucleic Acids Res. 31, e15. [DOI] [PMC free article] [PubMed] [Google Scholar]
- Irizarry, R.A. , Hobbs, B. , Collin, F. , Beazer‐Barclay, Y.D. , Antonellis, K.J. , Scherf, U. and Speed, T.P. (2003b) Exploration, normalization, and summaries of high density oligonucleotide array probe level data. Biostatistics, 4, 249–264. [DOI] [PubMed] [Google Scholar]
- Jayashree, T. and Subramanyam, C. (2000) Oxidative stress as a prerequisite for aflatoxin production by Aspergillus parasiticus . Free Radic. Biol. Med. 29, 981–985. [DOI] [PubMed] [Google Scholar]
- Kale, S.P. , Milde, L. , Trapp, M.K. , Frisvad, J.C. , Keller, N.P. and Bok, J.W. (2008) Requirement of LaeA for secondary metabolism and sclerotial production in Aspergillus flavus . Fungal. Genet. Biol. 45, 1422–1429. Epub 2008 July 1411. [DOI] [PMC free article] [PubMed] [Google Scholar]
- Keller, N.P. , Turner, G. and Bennett, J.W. (2005) Fungal secondary metabolism—from biochemistry to genomics. Nat. Rev. Microbiol. 3, 937–947. [DOI] [PubMed] [Google Scholar]
- Langfelder, K. , Jahn, B. , Gehringer, H. , Schmidt, A. , Wanner, G. and Brakhage, A.A. (1998) Identification of a polyketide synthase gene (pksP) of Aspergillus fumigatus involved in conidial pigment biosynthesis and virulence. Med. Microbiol. Immunol. 187, 79–89. [DOI] [PubMed] [Google Scholar]
- Le Bars, J. (1979) Cyclopiazonic acid production by Penicillium camemberti Thom and natural occurrence of this mycotoxin in cheese. Appl. Environ. Microbiol. 38, 1052–1055. [DOI] [PMC free article] [PubMed] [Google Scholar]
- Mahoney, N. and Molyneux, R.J. (2004) Phytochemical inhibition of aflatoxigenicity in Aspergillus flavus by constituents of walnut (Juglans regia). J. Agric. Food. Chem. 52, 1882–1889. [DOI] [PubMed] [Google Scholar]
- Martins, M.L. and Martins, H.M. (1999) Natural and in vitro coproduction of cyclopiazonic acid and aflatoxins. J. Food. Prot. 62, 292–294. [DOI] [PubMed] [Google Scholar]
- Mateles, R.I. and Adye, J.C. (1965) Production of aflatoxins in submerged culture. Appl. Microbiol. 13, 208–211. [DOI] [PMC free article] [PubMed] [Google Scholar]
- Nishie, K. , Cole, R.J. and Dorner, J.W. (1985) Toxicity and neuropharmacology of cyclopiazonic acid. Food. Chem. Toxicol. 23, 831–839. [DOI] [PubMed] [Google Scholar]
- O'Brian, G.R. , Georgianna, D.R. , Wilkinson, J.R. , Yu, J. , Abbas, H.K. , Bhatnagar, D. , Cleveland, T.E. , Nierman, W. and Payne, G.A. , (2007) The effect of elevated temperature on gene transcription and aflatoxin biosynthesis. Mycologia, 99, 232–239. [DOI] [PubMed] [Google Scholar]
- Papa, K.E. (1979) Genetics of Aspergillus flavus: complementation and mapping of aflatoxin mutants. Genet. Res. 34(1), 1–9. [DOI] [PubMed] [Google Scholar]
- Payne, G.A. , Nierman, W.C. , Wortman, J.R. , Pritchard, B.L. , Brown, D. , Dean, R.A. , Bhatnagar, D. , Cleveland, T.E. , Machida, M. and Yu, J.J. (2006) Whole genome comparison of Aspergillus flavus and A. oryzae . Med. Mycol. 44, 9–11. [DOI] [PubMed] [Google Scholar]
- Penalva, M.A. , Tilburn, J. , Bignell, E. and Arst, H.N., Jr (2008) Ambient pH gene regulation in fungi: making connections. Trends Microbiol. 16, 291–300. Epub 2008 May 2003. [DOI] [PubMed] [Google Scholar]
- Pitt, J.I. , Cruickshank, R.H. and Leistner, L. (1986) Penicillium commune, P. camembertii, the origin of the white cheese moulds, and the production of cyclopiazonic acid. Food. Microbiol. 3, 363–371. [Google Scholar]
- Price, M.S. , Conners, S.B. , Tachdjian, S. , Kelly, R.M. and Payne, G.A. (2005) Aflatoxin conducive and non‐conducive growth conditions reveal new gene associations with aflatoxin production. Fungal. Genet. Biol. 42, 506–518. [DOI] [PubMed] [Google Scholar]
- Price, M.S. , Yu, J. , Nierman, W.C. , Kim, H.S. , Pritchard, B. , Jacobus, C.A. , Bhatnagar, D. , Cleveland, T.E. and Payne, G.A. (2006) The aflatoxin pathway regulator AflR induces gene transcription inside and outside of the aflatoxin biosynthetic cluster. FEMS Microbiol. Lett. 255(2), 275–279. [DOI] [PubMed] [Google Scholar]
- Reeves, E.P. , Reiber, K. , Neville, C. , Scheibner, O. , Kavanagh, K. et al. (2006) A nonribosomal peptide synthetase (Pes1) confers protection against oxidative stress in Aspergillus fumigatus . FEBS J. 273, 3038–3053. Epub 2006 June 3036. [DOI] [PubMed] [Google Scholar]
- Reverberi, M. , Zjalic, S. , Punelli, F. , Ricelli, A. , Fabbri, A.A. and Fanelli, C. (2007) Apyap1 affects aflatoxin biosynthesis during Aspergillus parasiticus growth in maize seeds. Food Addit. Contam. 24, 1070–1075. [DOI] [PubMed] [Google Scholar]
- Reverberi, M. , Zjalic, S. , Ricelli, A. , Punelli, F. , Camera, E. , Fabbri, C. , Picardo, M. , Fanelli, C. and Fabbri, A.A. (2008) Modulation of antioxidant defence in Aspergillus parasiticus is involved in aflatoxin biosynthesis: a role for ApyapA gene. Eukaryot. Cell, 25, 25. [DOI] [PMC free article] [PubMed] [Google Scholar]
- Riley, R.T. and Showker, J.L. (1991) The mechanism of patulin's cytotoxicity and the antioxidant activity of indole tetramic acids. Toxicol. Appl. Pharmacol. 109, 108–126. [DOI] [PubMed] [Google Scholar]
- Rohlfs, M. , Albert, M. , Keller, N.P. and Kempken, F. (2007) Secondary chemicals protect mould from fungivory. Biol. Lett. 3, 523–525. [DOI] [PMC free article] [PubMed] [Google Scholar]
- Saikia, S. , Nicholson, M.J. , Young, C. , Parker, E.J. and Scott, B. (2008) The genetic basis for indole‐diterpenoid chemical diversity in filamentous fungi. Mycol. Res. 112, 184–199. [DOI] [PubMed] [Google Scholar]
- Shwab, E.K. , Bok, J.W. , Tribus, M. , Galehr, J. , Graessle, S. and Keller, N.P. (2007) Histone deacetylase activity regulates chemical diversity in Aspergillus. Eukaryot. Cell, 6, 1656–1664. Epub 2007 July 1656. [DOI] [PMC free article] [PubMed] [Google Scholar]
- Smith, C.A. , Woloshuk, C.P. , Robertson, D. and Payne, G.A. (2007) Silencing of the aflatoxin gene cluster in a diploid strain of Aspergillus flavus is suppressed by ectopic aflR expression. Genetics, 176(4), 2077–2086. [DOI] [PMC free article] [PubMed] [Google Scholar]
- Smith, C.A. , Robertson, D. , Yates, B. , Nielsen, D.M. , Brown, D. , Dean, R.A. and Payne, G.A. (2008) The effect of temperature on Natural Antisense Transcript (NAT) expression in Aspergillus flavus. Curr. Genet. 54(5), 241–269. [DOI] [PubMed] [Google Scholar]
- Stein, L.D. , Mungall, C. , Shu, S. , Caudy, M. , Mangone, M. , Day, A. , Nickerson, E. , Stajich, J.E. , Harris, T.W. , Arva, A. and Lewis, S. (2002) The generic genome browser: a building block for a model organism system database. Genome. Res. 12, 1599–1610. [DOI] [PMC free article] [PubMed] [Google Scholar]
- Sugui, J.A. , Pardo, J. , Chang, Y.C. , Mullbacher, A. , Zarember, K.A. , Galvez, E.M. , Brinster, L. , Zerfas, P. , Gallin, J.I. , Simon, M.M. and Kwon‐Chung, K.J. (2007) Role of laeA in the regulation of alb1, gliP, conidial morphology, and virulence in Aspergillus fumigatus . Eukaryot. Cell, 6, 1552–1561. Epub 2007 July 1513. [DOI] [PMC free article] [PubMed] [Google Scholar]
- Tokuoka, M. , Seshime, Y. , Fujii, I. , Kitamoto, K. , Takahashi, T. and Koyama, Y. (2008) Identification of a novel polyketide synthase‐nonribosomal peptide synthetase (PKS‐NRPS) gene required for the biosynthesis of cyclopiazonic acid in Aspergillus oryzae . Fungal. Genet. Biol. 45, 1608–1615. Epub 2008 September 1627. [DOI] [PubMed] [Google Scholar]
- Tsai, H.F. , Chang, Y.C. , Washburn, R.G. , Wheeler, M.H. and Kwon‐Chung, K.J. (1998) The developmentally regulated alb1 gene of Aspergillus fumigatus: its role in modulation of conidial morphology and virulence. J. Bacteriol. 180, 3031–3038. [DOI] [PMC free article] [PubMed] [Google Scholar]
- Tsai, H.F. , Wheeler, M.H. , Chang, Y.C. and Kwon‐Chung, K.J. (1999) A developmentally regulated gene cluster involved in conidial pigment biosynthesis in Aspergillus fumigatus . J. Bacteriol. 181, 6469–6477. [DOI] [PMC free article] [PubMed] [Google Scholar]
- Whyte, A.C. , Gloer, J.B. , Wicklow, D.T. , Dowdw, P.F. , Dowd, P.F. and Alfatafta, A.A. (1996) Sclerotiamide: a new member of the paraherquamide class with potent antiinsectan activity from the sclerotia of Aspergillus sclerotiorum Ochratoxin A: an antiinsectan metabolite from the sclerotia of Aspergillus carbonarius NRRL 369. J. Nat. Prod. 59: 1093–1095. [DOI] [PubMed] [Google Scholar]
- Wicklow, D.T. , Dowd, P.F. , Alfatafta, A.A. and Gloer, J.B. (1996) Ochratoxin A: an antiinsectan metabolite from the sclerotia of Aspergillus carbonarius NRRL 369. Can. J. Microbiol. 42, 1100–1103. [DOI] [PubMed] [Google Scholar]
- Widiastuti, R. , Maryam, R. , Blaney, B.J. and Stoltz, D.R. (1988) Cyclopiazonic acid in combination with aflatoxins, zearalenone and ochratoxin A in Indonesian corn. Mycopathologia, 104, 153–156. [DOI] [PubMed] [Google Scholar]
- Williams, R.B. , Henrikson, J.C. , Hoover, A.R. , Lee, A.E. and Cichewicz, R.H. (2008) Epigenetic remodeling of the fungal secondary metabolome. Org. Biomol. Chem. 6, 1895–1897. Epub 2008 April 1814. [DOI] [PubMed] [Google Scholar]
- Yu, J.H. and Keller, N. (2005) Regulation of secondary metabolism in filamentous fungi. Annu. Rev. Phytopathol. 43, 437–458. [DOI] [PubMed] [Google Scholar]
- Zhang, S. , Monahan, B.J. , Tkacz, J.S. and Scott, B. (2004) Indole‐diterpene gene cluster from Aspergillus flavus . Appl. Environ. Microbiol. 70, 6875–6883. [DOI] [PMC free article] [PubMed] [Google Scholar]