

Abstract
It is well established that most cancer cells take up an increased amount of glucose relative to that taken up by normal differentiated cells. The majority of this glucose carbon is secreted from the cell as lactate. The fate of the remaining glucose carbon, however, has not been well-characterized. Here we apply a novel combination of metabolomic technologies to track uniformly labeled glucose in HeLa cancer cells. We provide a list of specific intracellular metabolites that become enriched after being labeled for 48 h and quantitate the fraction of consumed glucose that ends up in proteins, peptides, sugars/glycerol, and lipids.
Most cancer cells are metabolically reprogrammed to take up and utilize an increased amount of glucose relative to normal differentiated cells.1 The majority of the glucose taken up is secreted from cancer cells in the form of lactate, even in the presence of sufficient oxygen to support oxidative phosphorylation.2 This metabolic shift is known as aerobic glycolysis, or the Warburg effect. While Warburg metabolism is seemingly wasteful in terms of the energy derived per mole of glucose, several hypotheses have been proposed to explain its role in cellular proliferation.3−5 One compelling suggestion is that Warburg metabolism supports the synthesis of precursors that are needed to produce biomass.2 A dividing cell has elevated biosynthetic demands for the replication of its DNA, RNA, proteins, and lipids for plasma membranes. There are known pathways connecting glycolytic intermediates to the synthesis of each of these macromolecular structures. Thus, glucose carbon has multiple potential fates that support the doubling of cell mass.
Although a large proportion of glucose is secreted as lactate in most cancer cells, it has been shown that this is not the sole fate of glucose carbon.6−8 The fate of the rest of the glucose carbon, however, has not been carefully characterized. In this work, we accomplished two objectives by studying HeLa cancer cells cultured in uniformly labeled [13C]glucose ([U-13C]glucose). First, we comprehensively characterized metabolites that are enriched with glucose carbon. Second, we quantitated the amount of glucose carbon that is partitioned to various biomass components such as proteins and lipids.
Our approach to studying the fate of glucose was to integrate two complementary metabolomic technologies: solid-state nuclear magnetic resonance (NMR) and liquid chromatography/mass spectrometry (LC/MS). In brief, HeLa cells were first lyophilized. The dried cells were then partitioned into two components, one for solid-state NMR (∼30 mg) and one for LC/MS (∼1 mg). For the solid-state NMR analysis, the dried cells were analyzed intact with a transmission-line probe and 12 T magnet. In contrast, for LC/MS analysis, the dried cells were extracted by using methanol, water, and acetonitrile.9 The extracted metabolites were then seperated by reversed-phase and hydrophilic liquid interaction chromatography and analyzed with a 6540 Agilent QTOF or a Thermo Q Exactive Plus mass spectrometer.10 Details describing HeLa cell cultures, solid-state NMR experiments, metabolite extraction, LC/MS parameters, and bioinformatic processing can be found in the Supporting Information.
For LC/MS analysis, we grew parallel cultures of HeLa cells in either natural-abundance glucose or [U-13C]glucose (n = 3 for each). The culture conditions were identical with the exception of the glucose label. The natural-abundance samples were cultured in 100% natural-abundance glucose, while the labeled samples were cultured in 50% [U-13C]glucose and 50% natural-abundance glucose for 48 h. In all experiments, the concentration of total glucose was 22.2 mM.
The LC/MS data from each experiment were processed by using metabolomic software called X13CMS that we recently developed.11 X13CMS, an extension of the widely used XCMS software,12 is designed to search all detected compounds for isotope labels unbiasedly. By using X13CMS, we comprehensively identified metabolites that become isotopically enriched in HeLa cells after 48 h of U–13C glucose incubation. Out of the 9,271 ions that we detected, we found that 2,505 (∼27%) were enriched by U–13C glucose. A complete list of labeled ions is provided in Supplementary Table 1.
As expected, the label was identified in glycolytic intermediates. The label was also found in all tricarboxylic acid (TCA) cycle metabolites, pentose phosphate pathway intermediates, and lipids such as fatty acids, phosphatidylcholines, phosphatidylethanolamines, phosphatidylinositols, and phosphatidylserines.
Interestingly, however, purines were only minimally labeled, presumably because HeLa cells use glycine in the medium as a precursor instead of glucose.7 Adenine is presented as a representative example in Figure 1. The labeling pattern shows that <10% of adenine incorporates 13C. The percentage of adenine incorporating multiple 13C atoms is near the detection limit. These data are consistent with the labeling patterns of adenosine and adenosine triphosphate (ATP). Adenosine and ATP are composed of an adenine ring of five carbons and a ribose sugar of five carbons. Our results indicate that the ribose sugar of adenosine and ATP is enriched from glucose. The labeling of the five remaining carbons that form the adenine ring is minimal, with a pattern that is consistent with that detected for free adenine. Further, we do not observe 13C labeling of glycine. It was previously suggested that consumed glycine supports de novo purine synthesis in rapidly dividing cancer cells.7,8 Our results are consistent with this finding. Despite taking up increased levels of glucose, rapidly dividing HeLa cells use very little glucose carbon for de novo purine synthesis.
Figure 1.
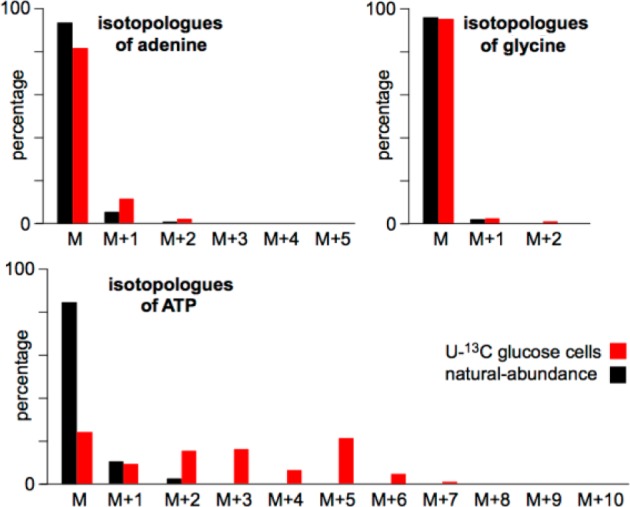
Isotopologue patterns of adenine, glycine, and ATP as determined by LC/MS. Data are from HeLa cells cultured in 50% [U-13C]glucose and 50% natural-abundance glucose for 48 h.
When the LC/MS data are processed by X13CMS as described above, we identify specific metabolites that are enriched by the [U-13C]glucose label. It is not possible with LC/MS, however, to perform total accounting for the 13C label. That is, we cannot quantify the size of each 13C-labeled metabolite pool relative to the size of the total [13C]glucose pool that was taken up by the cell because LC/MS analysis is performed on cellular extracts. The contributions of 13C from macromolecules as well as other metabolites lost during sample preparation are not measured by LC/MS. Additionally, differences in ionization efficiencies between molecules limit quantitative comparisons between 13C-labeled metabolites. Yet, determining the relative distributions of the label has important biochemical value.
To achieve total accounting of the isotope, we analyzed intact HeLa cells cultured in [U-13C]glucose by solid-state NMR (Figure 2).13 By measuring whole cells with cross-polarization magic-angle spinning 13C NMR, we quantitated all the 13C label in the sample, including that in isotopically enriched proteins and genetic material. We cultured HeLa cells in standard DMEM (unlabeled glucose at 22.2 mM) for a natural-abundance control. When natural-abundance contributions are removed from data from HeLa cells cultured in 5% [U-13C]glucose for 48 h, we obtain a spectrum that represents the fate of labeled glucose.
Figure 2.
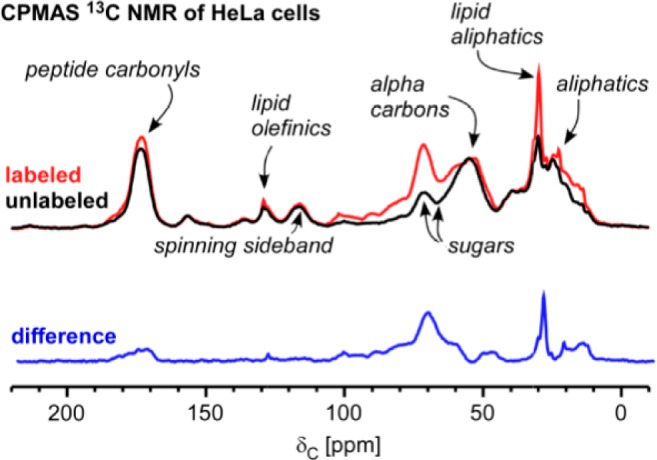
Total accounting of the label by cross-polarization magic-angle spinning (CPMAS) 13C NMR. Data colored red are from HeLa cells cultured in 5% [U-13C]glucose and 95% natural-abundance glucose for 48 h. Data colored black are from HeLa cells cultured in 100% natural-abundance glucose for 48 h. Each spectrum resulted from averaging 20K scans. The difference, colored blue, represents the fate of glucose 13C.
The relative intensity of the NMR peaks can be used to quantitatively compare the distribution of glucose fates (Figure 2). For example, we can compare the amount of labeled glucose carbon that is incorporated into proteins and peptides (174 ppm) to the amount of labeled glucose carbon that is incorporated into lipids (30 ppm). Importantly, we do not observe the incorporation of labeled glucose carbon into purines (140–160 ppm).14 These results are consistent with the LC/MS data (Figure 1). To distinguish the contributions of insoluble proteins from soluble peptides (both at 174 ppm), we extracted the cells and reanalyzed the insoluble pellet by solid-state NMR. We also performed the same type of differential solid-state NMR comparison on HeLa cell, lyophilized media before and after culturing cells for 48 h in [U-13C]glucose. By monitoring changes in the integrated intensity of the 13C3 peak of lactate (22 ppm), we determined that 76% of labeled glucose carbon is secreted as lactate. The combination of multiple NMR experiments allowed the quantitation of the fate of labeled glucose carbon in proteins, peptides, intracellular sugars and glycerol, and lipids, yielding values of 9, 2, 7, and 4%, respectively (Table 1).
Table 1. Distribution of 13C in HeLa Cells Labeled with 5% [U-13C]Glucose for 48 h.
| fate of glucose | % of glucose-derived carbon in biomass |
|---|---|
| secreted lactate | 76 |
| proteins (insoluble) | 9 |
| peptides (soluble) | 2 |
| sugars and glycerol | 7 |
| lipids | 4 |
| purines | <1 |
| other | 2 |
It is worth emphasizing that, qualitatively, the solid-state NMR results are simpler to interpret than the processed LC/MS data. While the LC/MS data provide extensive information about the labeling of specific metabolites, it is difficult to make generalizations about classes of compounds given the thousands of rows in the X13CMS table and the difficulty in identifying each. Therefore, solid-state NMR and LC/MS data sets are highly complementary. The solid-state NMR results can be used as a general guide to generate hypotheses that can then be assessed by mining the exhaustive X13CMS tables.
In summary, rapidly dividing cancer cells, such as the HeLa cells used in this study, undergo Warburg metabolism in which an increased amount of glucose is taken up and utilized compared to normal differentiated cells. Here we have comprehensively characterized the fates of glucose into various biomass components by integrating LC/MS and solid-state NMR technologies. We show that even though glucose can conceivably be routed into glycine for purine biosynthesis, this pathway is not active in HeLa cells. Only minimal 13C label from glucose is detected in glycine and the purine rings of nucleotides. With the total-accounting capabilities of solid-state NMR, we quantitated the fate of glucose carbons in various components of biomass. The incorporation of labeled carbon from glucose into proteins, lipids, and nucleotides is not equal. Future work will explore how this incorporation changes with time and how the incorporation of glucose carbon into each biomass component is biochemically regulated.
Supporting Information Available
Supporting details and Table S-1. This material is available free of charge via the Internet at http://pubs.acs.org.
This work was supported by the National Institutes of Health Grants R01 ES022181 (G.J.P.), L30 AG0 038036 (G.J.P.), and R01 EB002058 (J.S.).
The authors declare no competing financial interests.
Funding Statement
National Institutes of Health, United States
Supplementary Material
References
- Vander Heiden M. G.; Cantley L. C.; Thompson C. B. (2009) Understanding the Warburg effect: The metabolic requirements of cell proliferation. Science 324, 1029–1033. [DOI] [PMC free article] [PubMed] [Google Scholar]
- Lunt S. Y.; Vander Heiden M. G. (2011) Aerobic glycolysis: Meeting the metabolic requirements of cell proliferation. Annu. Rev. Cell Dev. Biol. 27, 441–464. [DOI] [PubMed] [Google Scholar]
- Vander Heiden M. G.; Lunt S. Y.; Dayton T. L.; Fiske B. P.; Israelsen W. J.; Mattaini K. R.; Vokes N. I.; Stephanopoulos G.; Cantley L. C.; Metallo C. M.; Locasale J. W. (2011) Metabolic pathway alterations that support cell proliferation. Cold Spring Harbor Symp. Quant. Biol. 76, 325–334. [DOI] [PubMed] [Google Scholar]
- Vazquez A.; Oltvai Z. N. (2011) Molecular crowding defines a common origin for the Warburg effect in proliferating cells and the lactate threshold in muscle physiology. PLoS One 6, e19538. [DOI] [PMC free article] [PubMed] [Google Scholar]
- Locasale J. W.; Cantley L. C. (2010) Altered metabolism in cancer. BMC Biol. 8, 88. [DOI] [PMC free article] [PubMed] [Google Scholar]
- DeBerardinis R. J.; Mancuso A.; Daikhin E.; Nissim I.; Yudkoff M.; Wehrli S.; Thompson C. B. (2007) Beyond aerobic glycolysis: Tansformed cells can engage in glutamine metabolism that exceeds the requirement for protein and nucleotide synthesis. Proc. Natl. Acad. Sci. U.S.A. 104, 19345–19350. [DOI] [PMC free article] [PubMed] [Google Scholar]
- Jain M.; Nilsson R.; Sharma S.; Madhusudhan N.; Kitami T.; Souza A. L.; Kafri R.; Kirschner M. W.; Clish C. B.; Mootha V. K. (2012) Metabolite profiling identifies a key role for glycine in rapid cancer cell proliferation. Science 336, 1040–1044. [DOI] [PMC free article] [PubMed] [Google Scholar]
- Locasale J. W.; Grassian A. R.; Melman T.; Lyssiotis C. A.; Mattaini K. R.; Bass A. J.; Heffron G.; Metallo C. M.; Muranen T.; Sharfi H.; Sasaki A. T.; Anastasiou D.; Mullarky E.; Vokes N. I.; Sasaki M.; Beroukhim R.; Stephanopoulos G.; Ligon A. H.; Meyerson M.; Richardson A. L.; Chin L.; Wagner G.; Asara J. M.; Brugge J. S.; Cantley L. C.; Vander Heiden M. G. (2011) Phosphoglycerate dehydrogenase diverts glycolytic flux and contributes to oncogenesis. Nat. Genet. 43, 869–874. [DOI] [PMC free article] [PubMed] [Google Scholar]
- Ivanisevic J.; Zhu Z.-J.; Plate L.; Tautenhahn R.; Chen S.; O’Brien P. J.; Johnson C. H.; Marletta M. A.; Patti G. J.; Siuzdak G. (2013) Toward ’omic scale metabolite profiling: A dual separation-mass spectrometry approach for coverage of lipid and central carbon metabolism. Anal. Chem. 85, 6876–6884. [DOI] [PMC free article] [PubMed] [Google Scholar]
- Zhu Z.-J.; Schultz A. W.; Wang J.; Johnson C. H.; Yannone S. M.; Patti G. J.; Siuzdak G. (2013) Liquid chromatography quadrupole time-of-flight mass spectrometry characterization of metabolites guided by the METLIN database. Nat. Protoc. 8, 451–460. [DOI] [PMC free article] [PubMed] [Google Scholar]
- Huang X.; Chen Y.-J.; Cho K.; Nikolskiy I.; Crawford P. A.; Patti G. J. (2014) X13CMS: Global tracking of isotopic labels in untargeted metabolomics. Anal. Chem. 86, 1632–1639. [DOI] [PMC free article] [PubMed] [Google Scholar]
- Smith C. A.; Want E. J.; O’Maille G.; Abagyan R.; Siuzdak G. (2006) XCMS: Processing mass spectrometry data for metabolite profiling using nonlinear peak alignment, matching, and identification. Anal. Chem. 78, 779–787. [DOI] [PubMed] [Google Scholar]
- Dirks R. C.; Singh M.; Potter G. S.; Sobotka L. G.; Schaefer J. (2012) Carbon partitioning in soybean (Glycine max) leaves by combined 11C and 13C labeling. New Phytol. 196, 1109–1121. [DOI] [PubMed] [Google Scholar]
- Jacob G. S.; Schaefer J.; Stejskal E. O.; McKay R. A. (1985) Solid-state NMR determination of glyphosate metabolism in a Pseudomonas sp. J. Biol. Chem. 260, 5899–5905. [PubMed] [Google Scholar]
Associated Data
This section collects any data citations, data availability statements, or supplementary materials included in this article.