Abstract
Children and adolescents vary widely in their perception of, or capacity to rate, sensations during exercise using the Borg scale. We sought to measure sensory-perceptual responses obtained using Dalhousie Dyspnea and Perceived Exertion Scales in 79 pediatric subjects during maximal exercise challenge and to determine the psychophysical function relationship(s). Concurrent validity was assessed by canonical plots of mean ratings on either scale, which showed showing very good correlations for perceived leg exertion vs work, and dyspnea vs ventilation. Both scales yielded similar results with respect to goodness of fit regardless of whether data was fitted to a power or quadratic function provided a delay term was included. The quadratic model fixed the exponent of the power law at 2 but, unlike a power model, allowed characterization of individual responses that increased and then plateaued. Dalhousie Dyspnea and Perceived Exertion Scales offer an alternative to Borg scale during exercise in pediatric populations.
Keywords: adolescents, children, exercise, dyspnea, perceived exertion
Introduction
Many scales have been employed to measure dyspnea but the most commonly employed is the Borg scale and modifications thereof (Borg 1962, 1982, 1998). These were developed and studied in adults to rate the distinct but related sensation of perceived exertion. The use of perceptual-sensory scales in children is more problematic. A prerequisite for use of any scale is the subject’s ability to seriate – organize objects in order – something that generally reaches an operational stage around 7 years of age (Mareschal and Shultz, 1999). There have been numerous attempts to measure perceived exertion during exercise using a variety of scales in children, reviewed by Eston and Parfitt (2007), who opined that adult-derived methods and applications may not be appropriate for use in pediatric populations. For this reason, other scales have been developed for use in pediatric populations, arguably the most widely used of which is the OMNI scale (Robertson et al. 2000; Utter, Robertson, Nieman, Kang, 2002). It’s validation as a measure of dyspnea or perceived exertion has gained traction largely by comparing OMNI ratings with those obtained using the Borg 6-20 RPE scale (Pfeiffer, Pivarnik, Womack, Reeves, Malina, 2002). The children’s OMNI scale, despite it’s appearance of showing a cyclist pedaling uphill, has been used to quantitate all perceptual ratings accompanying exertion, i.e. overall body (RPE-Overall), legs (RPE-Legs), and chest (RPE-Chest).
The Borg scale has undergone evolution since it’s original conception as the 6-20 RPE scale. Indeed, the respiratory literature and more recent work (Borg & Kaijser, 2006) has explored the psychophysical function obtained using Borg’s category ratio (CR-10) scale. This research has shown that ratings for dyspnea and leg effort in adults conform to a power law function: S=kIa where S is the magnitude of the particular sensation of interest (e.g. dyspnea), I is the intensity of stimulus (e.g. ventilation), k is constant, and a is the exponent, with exponents in adults averaging ~1.6 (Killian, Summers, Jones, & Campbell, 1992). There has been no such analysis among pediatric subjects using any Borg scale or the OMNI scale, but the convergence of developmental understanding at an age when a child can adequately perform spirometry and a maximal exercise test offers the opportunity to conduct psychophysical investigations of dyspnea and perceived exertion in this population.
We designed pictorial scales to measure dyspnea and perceived leg exertion during exercise that involves predominantly work by leg muscles. Scale design has been described (McGrath, Pianosi, Unruh, Smith, 2005) and the scales accurately tracked dyspnea during histamine-induced bronchoconstriction (Pianosi, Smith, Almudevar, & McGrath, 2006). We recently showed that ratings of perceived exertion obtained using the Borg CR-10 scale in children and adolescents conformed equally well to a quadratic function as to a power function, but goodness of fit was improved by introducing a delay term to account for the lag observed before these sensations were perceived (or reported) to exceed resting levels (Huebner, Zhang, McGrath, Therneau, & Pianosi, 2014). The aims of the present report were to demonstrate concurrent validity and describe the trajectory of dyspnea and perceived exertion ratings obtained using these pictorial scales in children and adolescents. We hypothesized that Dalhousie Dyspnea and Perceived Exertion Scales ratings would rise with increasing work in a manner or trajectory similar that seen using the Borg CR-10 scale.
Participants and Methods
Participants
Children with asthma or cystic fibrosis attending outpatient clinics at IWK Health Centre in Halifax, Canada were invited to participate. Healthy control children were recruited from friends and relatives of hospital personnel, or siblings of the patients. The study received approval from the Research Ethics Board of the IWK Health Centre, and parents or mature minors signed informed consent.
Procedures
Ventilation and gas exchange were measured breath-by-breath (CPX Plus, WE Collins, Braintree MA, USA) and averaged every 15 seconds during each stage of exercise on a cycle ergometer (Collins) test employing step increments of either, 50, 100, or 150 kpm per minute depending on size and age. Increments were chosen to achieve test duration of 6-10 minutes, until voluntary, symptom-limited, exhaustion.
Symptom Measurement
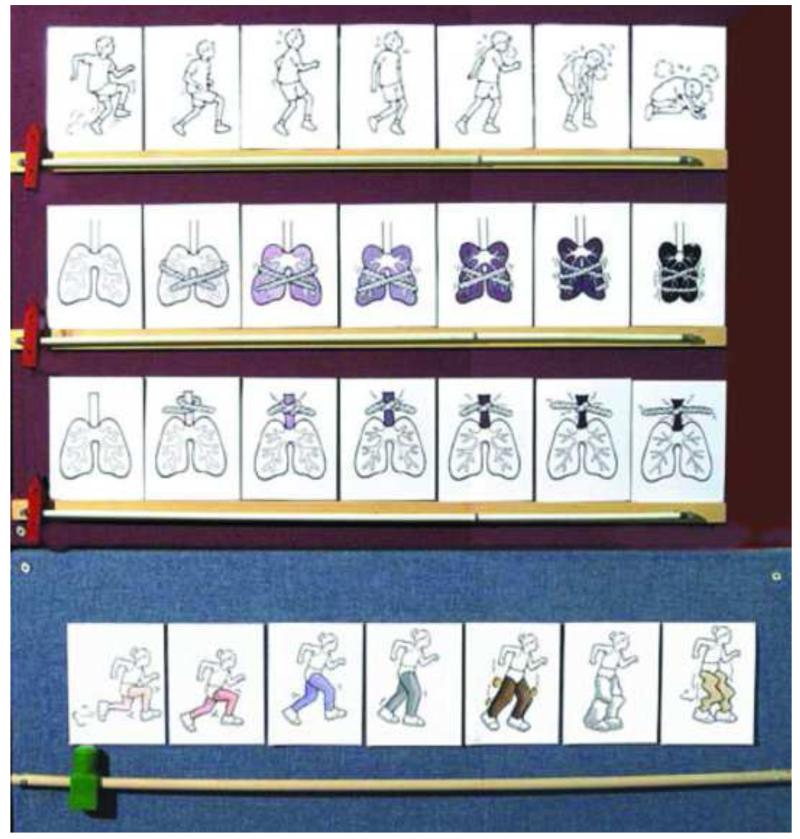
The Dalhousie Dyspnea and Perceived Exertion Scales consist of a sequence of pictures depicting three, dyspnea constructs: chest tightness, throat closure, and breathing effort; plus an additional pictorial scale to depict leg exertion/fatigue (Figure 1). The research assistant gave participants an explanation of the pictorial scales at the outset as follows:
“The purpose of this test is to see how your breathing feels and how your legs feel during exercise. There are no right or wrong answers. The pictures in front of you show how your breathing might feel, from no difficulty at all, to the most difficulty you can imagine. You might feel this difficulty breathing in your chest or in your throat. Another scale simply asks you to tell us how hard it is to breathe – from nothing at all, to the hardest breathing imaginable. With the final set of pictures, tell us how your legs feel – from nothing at all, to the hardest imaginable. We will ask you the same using this other scale (pointing to the Borg CR-10).
Figure 1.
Dalhousie Dyspnea and Perceived Exertion Scales
Ratings using the pictorial scales at rest and during exercise were prompted by the questions:
“How does your breathing feel?” or “How do your legs feel?”
While, ratings using the Borg scale were prompted by the questions:
“How hard is your breathing?” or “How tired are your legs?”
Ratings were recorded at rest and during the final 15 seconds of each workload. Pictorial scales were mounted on a large poster board in front of the participant. Sliding cursors located below each set of pictures arranged in rows, were pushed along its track from left to right by the research assistant until it pointed to the rating that best described the participant’s level of dyspnea (each of three sub-scales) or leg effort, signaled as the participant pushed a buzzer mounted on the handlebars. The cursor was replaced at the far left (0-point) after each measurement, the in preparation for the next. An identical procedure was done with the Borg CR-10 Scale mounted on a clipboard in front of the subject, only the cursor was (by scale design) was slid vertically until the subject signaled with the buzzer. Subjects were asked which scale they preferred after completion of exercise.
Analysis
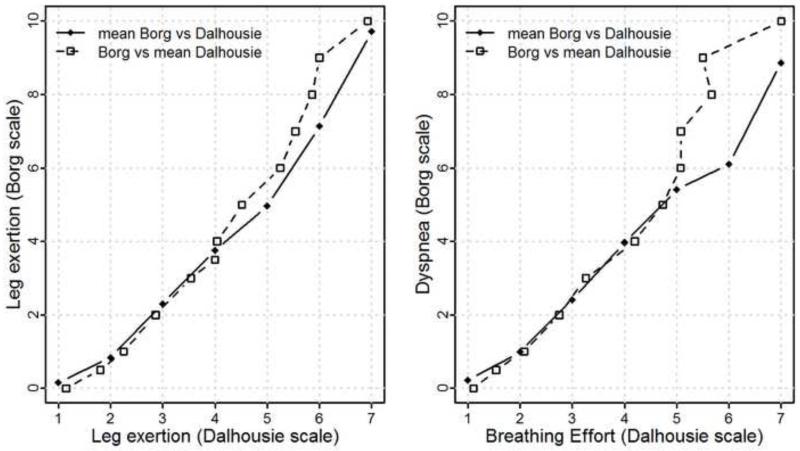
Canonical curves plot actual ratings from the Dalhousie scales vs average ratings of the Borg scale, and actual ratings from the Borg scale vs average ratings of the Dalhousie scales, at each work load relative to individual maxima. Similar curves would indicate that ratings on one scale can be mapped well to the other scale. Functional clustering algorithms were used to identify patterns, related to any of age, sex, or diagnosis (healthy or lung disease) of dyspnea or perceived exertion ratings during exercise.
For the mathematical description or modeling of the sensory-perceptual function, we began with the general form was proposed by Borg (1962):
where S describes the sensation, b is a measure constant, a the absolute threshold or the starting point of the function, d a delay before the sensation rises above this threshold, c is the exponent, and I the intensity of the stimulus, but used a simpler quadratic model with delay:
where the superscript “+” indicates the non-negative part. Both power and quadratic delay model fit equally well, but a quadratic-delay model simplifies the interpretation since it has a fixed exponent and only the coefficients of the quadratic and linear terms need to be estimated (Huebner, et al., 2014). A non-zero coefficient (b2) measures the strength of the curvature but if this coefficient is zero, then the curve is linear. The computational burden for the quadratic delay model was much smaller than for the power-delay model, using the statistical software R 2.15.3 for analyses. The root mean square error (RMSE) was calculated to assess the model fits, with lower RMSE implying better statistical fit.
Results
Anthropometric, lung function, and exercise data on study subjects is shown in Table 1. Children and adolescents preferred the Dalhousie pictorial scales to the Borg Scale for rating dyspnea as well as leg exertion (70% and 80% of participants, respectively). All 79 subjects had at least six paired ratings. Subjects generally tracked their sensation of dyspnea and perceived leg exertion similarly using the Borg and Dalhousie scales, and those reporting minimal change in dyspnea or perceived exertion did so whether rated by Borg or Dalhousie scales. Mappings from Dalhousie to Borg scale ratings and vice versa were similar, as shown in the canonical curves (Figure 2). The paired curves diverge in heavy exercise due to lower number of subjects rating dyspnea or perceived exertion in this range. Subjects also rated dyspnea similarly with each sub-scale of the Dalhousie scales (breathing effort, chest tightness, throat closure).
Table 1.
Characteristics and maximal exercise data (means±SD) of subjects. FEY1 1st second forced expiratory volume. VO2 oxygen uptake. VE ventilation.
| controls | CF | asthma | |
|---|---|---|---|
| M:F | 17:15 | 15:6 | 14:12 |
| Age (years) | 12.4±2.5 | 14.1±2.3 | 12.0±2.8 |
| Height (cm) | 155±13 | 158±11.6 | 150±14 |
| Weight (kg) | 51.9±15.9 | 48.7±11.1 | 45.8±16.4 |
| FEV1 (%predicted) | 103±17 | 75±18 | 96±16 |
| V̇O2 (ml·min−1·kg−1) | 36.0±10.1 | 28.7±8.3 | 33.4±8.7 |
| HR (min−1) | 193±9 | 185±15 | 189±1I |
| V̇E (L·min−1) | 77.8±22.3 | 77.8±18.1 | 77.6±24.0 |
Figure 2.
Canonical plots of actual ratings from one scale, vs average ratings of the alternative scale at each work load, relative to individual maxima.
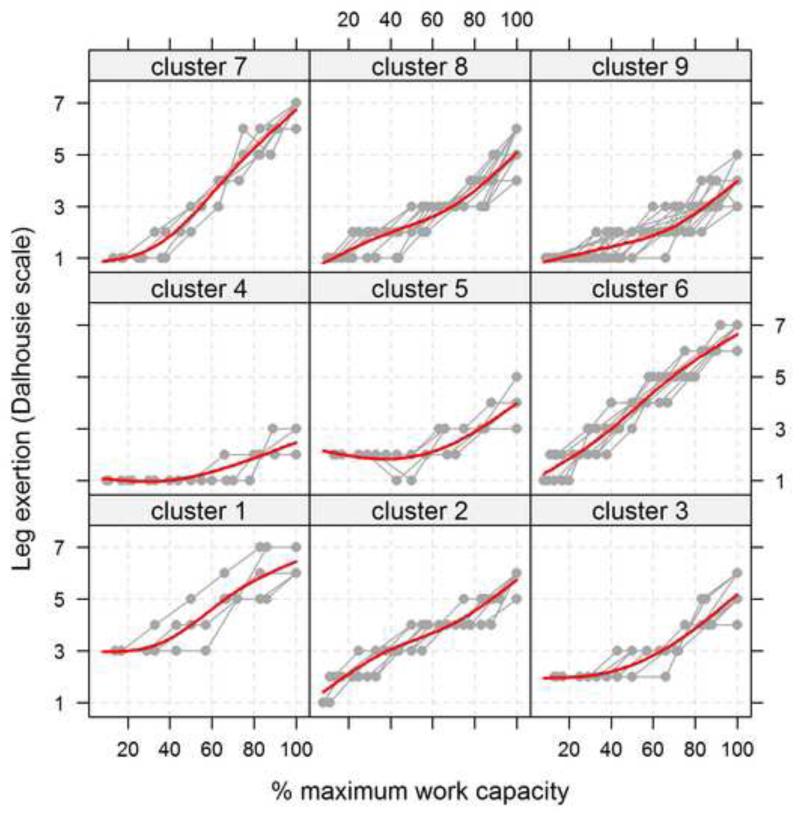
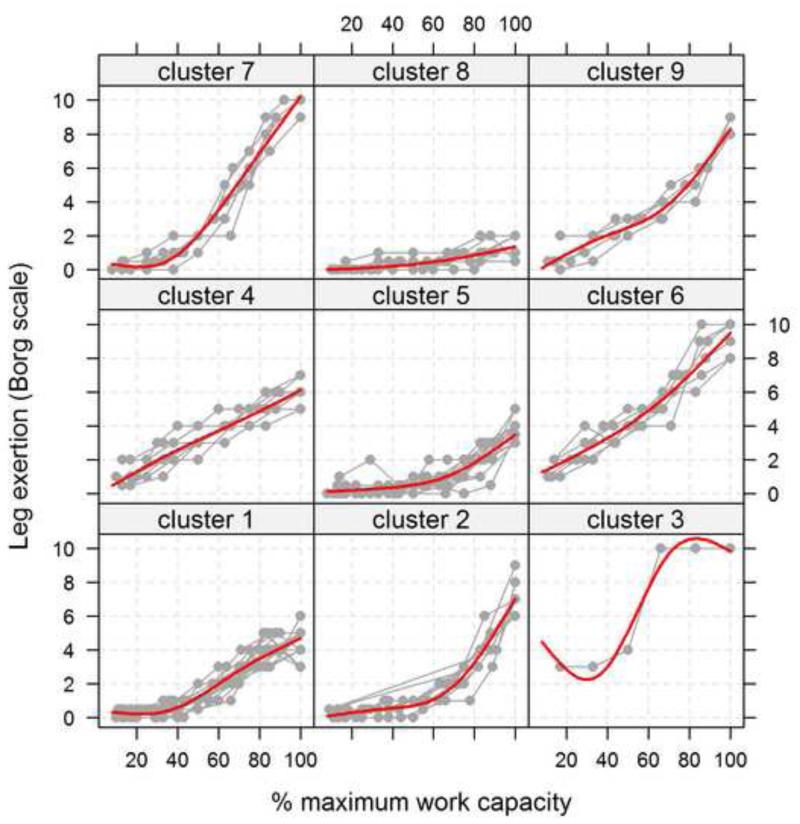
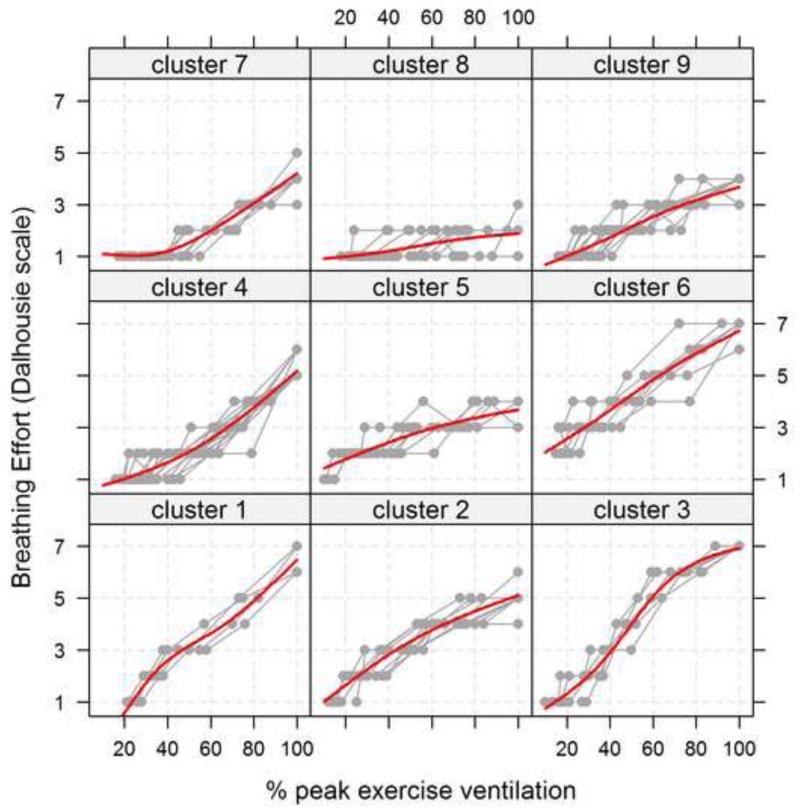
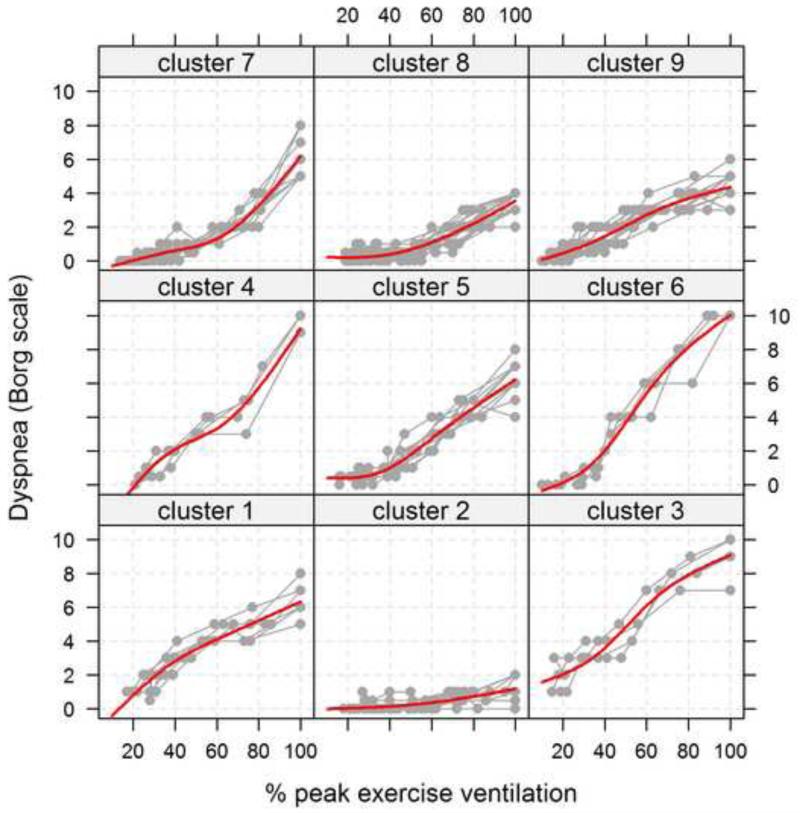
Results of modeling stimulus-response curves in, reported as medians (quartiles) of the model parameters for all scales, are shown in Table 2. In this table, one can see that the median value for the coefficient of the quadratic term was 0 for all scales except dyspnea rated with the Dalhousie pictorial scales. A median of 0 for the quadratic coefficient or a median of 1 for the exponent indicate that some curves were linear; and about as many subjects had a quadratic increase in ratings in heavy exercise as there were subjects whose ratings leveled off with increasing work. Great variability in growth pattern and trajectory is evidenced in the functional clustering diagrams (Figure 3). Regardless of what scale was used, a delay in onset of ratings of perceived exertion or dyspnea increasing above baseline values was seen in many individuals. That is to say, ratings remained relatively constant until a certain threshold – averaging ~40% maximum exercise. There was no clear distinction in the clustering of growth trajectories obtained using each scale with respect to age, gender, or diagnosis (Table 3). In-depth analysis of these data was limited due to small numbers of subjects in any particular group: e.g. 2/3 of subjects in cluster 1 of Fig. 3-2 (Borg CR-10 rating of perceived exertion) were >13 years old but the total number of subjects in that cluster was only 17. It is also evident from Figure 3 that many subjects reported well below maximal possible values for dyspnea or leg exertion at peak exercise. One can see in Table 4 that younger children (ages 8-12) had lower ratings for dyspnea and perceived exertion at maximal exercise than did adolescents (ages 13-18) on all scales except the Dalhousie breathing effort sub-scale.
Table 2.
Summary of estimated model parameters for models: median (1st quartile, 3rd quartile) ratings of perceived exertion and dyspnea, using Borg CR-10 scale or using Dalhousie scales.
| Quadratic-delay model: S = a + b1 (I-d)+ + b2 ((I-d)+)2 | ||||
|---|---|---|---|---|
| Parameters | Dalhousie-leg exertion vs %Wmax |
Borg-exertion vs %Wmax |
Dalhousie-breath effort vs %max V̇E |
Borg-dyspnea vs %max V̇E |
| Intercept (a) | 1.18 (1.0,2.0) | 0.39 (0.0, 0.6) | 1.06 (1.0, 1.6) | 0.38 (0.03, 0.6) |
| Delay (d) | 0.26 (0.2, 0.4) | 0.40 (0.3, 0.5) | 0.28 (0.2, 0.4) | 0.34 (0.24, 0.5) |
|
Coefficient of linear
term (b1) |
4.32 (2.4, 7.0) | 7.01 (3.2, 11.9) | 6.24 (4.2, 8.2) | 7.25 (3.3, 11.9) |
|
Coefficient of
quadratic term (b2) |
0.0 (−3.2, 2.9) | 0.0 (−4.3, 5.8) | -2.19 (−6.0, 0.5) | 0.0 (−6.2, 2.8) |
| RMSE | 0.23 (0.2,0.3) | 0.25 (0.2, 0.4) | 0.24 (0.2, 0.3) | 0.25 (0.2, 0.4) |
| Power-delay model: S = a + b (I-d)c | ||||
|---|---|---|---|---|
| Parameters | Dalhousie-leg exertion vs %Wmax |
Borg-exertion vs %Wmax |
Dalhousie-breath effort vs %max V̇E |
Borg-dyspnea vs%max V̇E |
| Intercept (a) | 1.20 (1.0,2.0) | 0.36 (0.0, 0.6) | 1.02 (1.0, 1.6) | 0.38 (0.06, 0.7) |
| Delay (d) | 0.25 (0.2, 0.4) | 0.30 (0.2, 0.4) | 0.30 (0.2, 0.4) | 0.34 (0.24, 0.4) |
|
Coefficient of power
term (b) |
4.89 (3.5, 6.2) | 6.99 (5.4, 10.5) | 4.22 (2.9, 6.0) | 6.81 (4.2, 9.8) |
| Exponent (c) | 0.97 (0.6, 1.5) | 1.03 (0.8, 1.8) | 0.69 (0.3, 1.0) | 0.88 (−0.6, 2.8) |
| RMSE | 0.22 (0.2,0.3) | 0.23 (0.1, 0.4) | 0.23 (0.1, 0.3) | 0.25 (0.2, 0.4) |
Figure 3.
Results of cluster analysis of individual response ratings for dyspnea and perceived exertion obtained with the Borg CR-10 scale; and those obtained with the corresponding Dalhousie scale pictures, specifically the breathing effort and leg exertion constructs.
Table 3.
Cluster analysis of psychophysical functions (Fig. 3) split according to age, sex, diagnosis.
| Scale rating cluster | N | male | <13 yr | Asthma | CF | Control |
|---|---|---|---|---|---|---|
| Dalhousie-leg exertion | ||||||
| cluster 1 | 5 | 4 | 1 | 2 | 2 | 1 |
| cluster 2 | 7 | 5 | 1 | 4 | 2 | 1 |
| cluster 3 | 7 | 3 | 4 | 4 | 1 | 2 |
| cluster 4 | 5 | 3 | 4 | 4 | 1 | 0 |
| cluster 5 | 6 | 5 | 3 | 1 | 3 | 2 |
| cluster 6 | 8 | 5 | 2 | 1 | 3 | 4 |
| cluster 7 | 5 | 2 | 3 | 1 | 2 | 2 |
| cluster 8 | 15 | 7 | 6 | 3 | 5 | 7 |
| cluster 9 | 21 | 12 | 13 | 6 | 2 | 13 |
| Borg-exertion | ||||||
| cluster 1 | 17 | 9 | 6 | 4 | 6 | 7 |
| cluster 2 | 9 | 4 | 3 | 2 | 3 | 4 |
| cluster 3 | 1 | 1 | 0 | 0 | 1 | 0 |
| cluster 4 | 8 | 5 | 4 | 5 | 1 | 2 |
| cluster 5 | 17 | 11 | 11 | 5 | 2 | 10 |
| cluster 6 | 6 | 3 | 1 | 3 | 1 | 2 |
| cluster 7 | 6 | 4 | 4 | 1 | 2 | 3 |
| cluster 8 | 10 | 6 | 8 | 5 | 1 | 4 |
| cluster 9 | 5 | 3 | 0 | 1 | 4 | 0 |
| Dalhousie-breath effort | ||||||
| cluster 1 | 4 | 2 | 2 | 2 | 0 | 2 |
| cluster 2 | 10 | 3 | 3 | 5 | 2 | 3 |
| cluster 3 | 5 | 4 | 2 | 1 | 2 | 2 |
| cluster 4 | 15 | 10 | 8 | 2 | 6 | 7 |
| cluster 5 | 7 | 4 | 1 | 2 | 1 | 4 |
| cluster 6 | 7 | 4 | 2 | 2 | 2 | 3 |
| cluster 7 | 8 | 7 | 5 | 3 | 2 | 3 |
| cluster 8 | 10 | 6 | 7 | 7 | 1 | 2 |
| cluster 9 | 13 | 6 | 7 | 2 | 5 | 6 |
| Borg-dyspnea | ||||||
| cluster 1 | 6 | 3 | 2 | 3 | 2 | 1 |
| cluster 2 | 10 | 8 | 7 | 6 | 2 | 2 |
| cluster 3 | 4 | 2 | 1 | 2 | 0 | 2 |
| cluster 4 | 4 | 3 | 3 | 1 | 0 | 3 |
| cluster 5 | 10 | 5 | 5 | 0 | 5 | 5 |
| cluster 6 | 4 | 3 | 1 | 1 | 2 | 1 |
| cluster 7 | 10 | 6 | 2 | 3 | 3 | 4 |
| cluster 8 | 18 | 10 | 13 | 6 | 2 | 10 |
| cluster 9 | 13 | 6 | 3 | 4 | 5 | 4 |
Table 4.
Maximal ratings for dyspnea and perceived exertion obtained using Borg CR-10 or Dalhousie pictorial scales.
| Scale | Age (yrs) | Median (IQR) | p-value |
|---|---|---|---|
| Dalhousie-leg exertion | 8-12 | 4 (4-6) | 0.012 |
| (maximum =7) | 13-18 | 6 (4.25-6) | 0.013 |
| Borg-exertion | 8-12 | 4 (3-6) | 0.006 |
| (maximum =10) | 13-18 | 6 (4.25-8) | 0.009 |
| Dalhousie-breath effort | 8-12 | 4 (3-6) | 0.23 |
| (maximum =7) | 13-18 | 5 (4-5.75) | 0.22 |
| Borg-dyspnea | 8-12 | 4 (3-6) | 0.019 |
| (maximum =10) | 13-18 | 5 (4-7) | 0.04 |
IQR inter-quartile range. p-values for Wilcoxon test comparing medians.
Discussion
We compared Dalhousie Dyspnea and Perceived Exertion Scale ratings with Borg CR-10 ratings of dyspnea and leg exertion from adolescents and children as young as 8 years of age during exercise – healthy or with lung disease–and found very good coupling between corresponding measurements. Ours is the first psychophysical and modeling study of Borg CR-10 scale in a pediatric population. Dalhousie Scale ratings paralleled Borg ratings, though neither scale conformed to a simple power law relationship in children. The psychophysical model fit was improved by adding a delay term to the stimulus-response function. Allowance for this delay yielded average exponent values slightly lower than previously reported in adults (Borg, 1998; Killian, et al., 1992), but similar to those estimated by Borg & Kaijser (2006). In that report, curves for adults were similar (with perhaps one exception) and thus average model parameters could be estimated for the study population. In contrast, individual curves for pediatric subjects in our study were much more variable and were not comparable to those reported in adults. Linear or exponential (quadratic) growth of the psychophysical function for dyspnea or perceived exertion posed a challenge in modeling the sensory–perceptual responses in our pediatric population. Both a power model with delay term and a quadratic-delay model can describe either linear or quadratic growth of dyspnea or perceived exertion, but only the quadratic-delay model accounted for inflection points. One can see these when ratings increase and then plateau in which case the coefficient of the quadratic term is negative (Huebner, et al., 2014). The model fits were equally good for the pictorial Dalhousie Dyspnea and Perceived Exertion Scales or the Borg scales indicated by similar RMSE. Canonical curves indicated that ratings on these different scales mapped each other well, demonstrating concurrent validity of the Dalhousie scales. We had previously demonstrated their content validity for estimation of dyspnea severity (McGrath, et al., 2005; Pianosi, et al., 2006).
Killian (1999) argued that the Borg CR-10 scale in adults adheres to principles of an absolute scale with ratio properties. Dalhousie Dyspnea and Perceived Exertion Scales function at least as interval scales and statistical modeling of a quadratic function to describe stimulus–response relationships implies they behave as ratio scales as well. They have an anchor (intercept) but the concepts of weaker vs stronger or weak–strong absolutes are embodied in the pictures themselves instead of numbers or adjectives. A particular picture replaces, or serves as the equivalent of, the descriptive adjectives tagged with numbers along the Borg CR-10 scale. These concepts were correctly identified and pictures correctly sequenced by the vast majority of pediatric subjects more than 7 years old during initial validation studies (McGrath, et al., 2005).
In our modeling analysis, we identified nine clusters of trajectories for perceived exertion vs percent maximal work capacity, or dyspnea vs percent maximal ventilation. Such patterns in ratings were distinguished by size of delay as workload increased, linear or quadratic growth patterns, and highest rating at peak exercise. Collectively, these characteristics accounted for the marked inter-individual variability in the observed sensory–perceptual responses. Therefore, an attempt to parse these characteristics might provide insights into better understanding of this variability and how cognitive ability impacts rating of sensation. Studies in adults using the Borg CR-10 scale also showed an initial period in light exercise of very gradual rise in rating (Killian, et al., 1992). Most of our pediatric subjects appeared to perceive little if any change in sensation of dyspnea or perceived exertion until they exceeded a threshold – generally ~40% of peak exercise but >60% in some – after which ratings rose with highly variable degree of steepness. Since this observation was no more prevalent in healthy subjects than in patients with lung disease, the phenomenon may be more characteristic of the pediatric population as a whole.
Median or mean maximal ratings for dyspnea and leg exertion among our pediatric subjects were only slightly greater than half the maximum possible value, a finding reported by others (Barkley & Roemmich, 2008; Bar-Or, 1977). Younger children had lower ratings than did children over 13 years of age (Huebner, et al., 2014). Sub-maximal rating was also seen in 80% of 460 adults (Killian, et al., 1992) who explained their observations as reflecting tolerance for discomfort. It is hard to imagine the degree of physiologic stress was so different at peak exercise between younger vs older children. Groslambert & Mahon (2006) argued that pre-pubertal children could distinguish up to four levels of exercise intensity during cycle ergometry. It may be that children cannot conceptualize maximum dyspnea or perceived exertion beyond the fourth-highest rank on any scale because experiential poverty impairs their ability to estimate the greatest imaginable perceived leg exertion at maximal exercise (Groslambert & Mahon, 2006).
Several other scales have been proposed to measure perceived exertion (mainly) or dyspnea (fewer) in children (reviewed in Eston & Parfitt, 2007; Schweitzer & Marchal, 2009). Among these, the OMNI scale has been studied most extensively and compared with Borg scale ratings in children and adolescents (Robertson et al. 2000; Pfeiffer, et al., 2002; Utter, et al., 2002). The Dalhousie Perceived Exertion scale shares some features of the OMNI scale, which combined pictures and verbal descriptors, recognizing the limitations of numerical and verbal descriptions. While OMNI and Dalhousie Scales are conceptually similar, OMNI employs the same scale to assess undifferentiated rating of perceived exertion (overall-RPE), as well as RPE-legs and RPE-chest. The Dalhousie Dyspnea Scales were created primarily as a tool to measure degree of dyspnea including the overall sense of breathing effort after interviewing healthy children and children with lung disease; and secondly perceived exertion with specific focus on the legs – the principal muscle groups involved in laboratory-based ergometry. As such, a child as young as 7 years of age can choose the picture most closely depicting how s/he feels in her/his chest or throat, rather than trying to represent or extrapolate a breathing sensation to caricature of a cyclist pedaling uphill. Moreover, psychophysical modeling of the stimulus–sensory perceptual response has not been performed with any of these other pictorial scale such as OMNI to the best of our knowledge. A limitation of our study is that the models were estimated from one trial. It would be useful to assess the children in a second trial to observe any changes in the functional relationship and increasing comfort with the process of rating.
The word “dyspnea” subsumes a variety of uncomfortable respiratory sensations, distilled into (at least) three separable qualities in adults: “air hunger”, “effort”, and “tightness”. Rather than presume the same sensations would be reported by children and adolescents, we developed pictorial scales that embodied sensations gleaned from focus group interviews of children with the commonest pediatric pulmonary diseases. The most articulate of these initial subjects were quite clear in differentiating chest tightness such as one might report during bronchoconstriction, from breathing effort such as one feels during or immediately following vigorous aerobic exercise. The sensation of throat constriction also came out loud and clear, despite the fact that none of the initial focus group subjects had a history of glottic disorder. The fact that we were unable to demonstrate differential responses or sub-scale choices in healthy controls vs. children with asthma or cystic fibrosis does not refute or exclude the possibility that these three pictorial scales reflect different dyspnea attributes appropriately in both healthy controls and individuals with lung diseases. We previously showed that asthmatics reported a sensation in their throat during bronchoconstriction, and our study was under-powered to find such distinctions given the large inter-individual variability in severity of dyspnea demonstrated during exercise.
In conclusion, Dalhousie Dyspnea and Perceived Exertion Scales and Borg CR-10 scales resulted in a similar model fit. Since the pictorial scales do not rely on any numbers or verbal descriptors, it may be possible to use the Dalhousie scales in children without regard to language. Further research would be warranted to examine such relationships in other populations. Still, the choice of scale may be less important than recognition of individual variability in stimulus–perception relationship.
Highlights.
Dalhousie Pictorial Scales performed as well as Borg CR10 scale for rating dyspnea and perceived exertion in exercising children and adolescents
Both scales conformed to a power law, but use of a delay term improved fit and meaningfulness of the derived psychophysical function
Choice of scale is less critical than recognition of inter-individual variability in trajectory with increasing work
Acknowledgement
Funding for this study was provided by the Lung Association of Nova Scotia, and by the Department of Pediatric and Adolescent Medicine Research Award, Mayo Clinic.
Footnotes
Publisher's Disclaimer: This is a PDF file of an unedited manuscript that has been accepted for publication. As a service to our customers we are providing this early version of the manuscript. The manuscript will undergo copyediting, typesetting, and review of the resulting proof before it is published in its final citable form. Please note that during the production process errors may be discovered which could affect the content, and all legal disclaimers that apply to the journal pertain.
References
- Barkley JE, Roemmich JN. Validity of the CALER and OMNI-bike ratings of perceived exertion. Medicine and Science in Sports and Exercise. 2008;40:760. doi: 10.1249/MSS.0b013e318161729b. [DOI] [PubMed] [Google Scholar]
- Bar-Or O. Age-related changes in exercise perception. In: Borg G, editor. Physical Work and Effort. Pergamon Press; Solna, Sweden: 1977. pp. 255–256. [Google Scholar]
- Borg E, Kaijser L. A comparison between three rating scales for perceived exertion and two different work tests. Scandinavian journal of medicine & science in sports. 2006;16:57–69. doi: 10.1111/j.1600-0838.2005.00448.x. [DOI] [PubMed] [Google Scholar]
- Borg G. A category scale with ratio properties for intermodal and interindividual comparisons. In: Geissler H-G, Petzold P, editors. Psychophysical Judgement and the Process of Perception. VEB Deutscher Verlag der Wissenschaften; Berlin: 1982. pp. 25–34. [Google Scholar]
- Borg G. Borg’s perceived exertion and pain scales. Human kinetics; Champaign, IL: 1998. [Google Scholar]
- Borg GA. Physical performance and perceived exertion. Gleerup; Lund: 1962. pp. 1–62. [Google Scholar]
- Eston RG, Parfitt G. Perceived Exertion. In: Armstrong N, editor. Pediatric Exercise Physiology, Advances in Sports Sciences Series. Churchill Livingstone; London: 2007. p. 278. [Google Scholar]
- Groslambert A, Mahon AD. Perceived Exertion. Sports Medicine. 2006;36:911–928. doi: 10.2165/00007256-200636110-00001. [DOI] [PubMed] [Google Scholar]
- Huebner M, Zhang Z, McGrath PJ, Therneau T, Pianosi PT. Determination of the psychophysical function for Borg ratings of leg exertion during maximal cycle ergometer exercise in children and adolescents. BMC Medical Research Methodology. 2014;14:4. doi: 10.1186/1471-2288-14-4. http://www.biomedcentral.com/1471-2288/14/4. [DOI] [PMC free article] [PubMed] [Google Scholar]
- Killian KJ. Measurements of dyspnea during bronchoconstriction. Eur Respir J. 1999;6:1004–1010. [PubMed] [Google Scholar]
- Killian KJ, Summers E, Jones NL, Campbell EJM. Dyspnea and Leg Effort during Incremental Cycle Ergometry. Am Rev Respir Dis. 1992;145:1339–1345. doi: 10.1164/ajrccm/145.6.1339. [DOI] [PubMed] [Google Scholar]
- Mareschal D, Shultz TR. Development of children’s seriation: A connectionist approach. Connection Science. 1999;11:149–186. [Google Scholar]
- McGrath PJ, Pianosi P, Unruh AM, Smith CP. Dalhousie Dyspnea Scales: construct and content validity of pictorial scales for measuring dyspnea. BMC Pediatrics. 2005;5:33. doi: 10.1186/1471-2431-5-33. http://www.biomedcentral.com/1471-2431/5/33. [DOI] [PMC free article] [PubMed] [Google Scholar]
- Pfeiffer KA, Pivarnik JM, Womack CJ, Reeves MJ, Malina RM. Reliability and validity of the Borg and OMNI rating of perceived exertion scales in adolescent girls. Medicine & Science in Sports & Exercise. 2002;34:2057–2061. doi: 10.1097/00005768-200212000-00029. [DOI] [PubMed] [Google Scholar]
- Pianosi P, Smith CP, Almudevar A, McGrath PJ. Dalhousie dyspnea scales: Pictorial scales to measure dyspnea during induced bronchoconstriction. Pediatric Pulmonology. 2006;41:1182–1187. doi: 10.1002/ppul.20512. [DOI] [PubMed] [Google Scholar]
- Robertson RJ, Goss FL, Boer NF, Peoples JA, Foreman AJ, Dabayebeh IM,, Millich NB, Balasekaran G, Riechman SE, Gallagher JD, Thompkins T. Children’s OMNI scale of perceived exertion: mixed gender and race validation. Medicine & Science in Sports & Exercise. 2000;32:452–458. doi: 10.1097/00005768-200002000-00029. [DOI] [PubMed] [Google Scholar]
- Schweitzer C, Marchal F. Dyspnoea in children. Does development alter the perception of breathlessness? Respiratory Physiology & Neurobiology. 2009;167:144–153. doi: 10.1016/j.resp.2008.12.001. [DOI] [PubMed] [Google Scholar]
- Utter AC, Robertson RJ, Nieman DC, Kang J. Children’s OMNI Scale of Perceived Exertion: walking/running evaluation. Medicine & Science in Sports & Exercise. 2002;34:139–144. doi: 10.1097/00005768-200201000-00021. [DOI] [PubMed] [Google Scholar]


