

Abstract
Background
Tree nut consumption has been associated with reduced diabetes risk, however, results from randomized trials on glycemic control have been inconsistent.
Objective
To provide better evidence for diabetes guidelines development, we conducted a systematic review and meta-analysis of randomized controlled trials to assess the effects of tree nuts on markers of glycemic control in individuals with diabetes.
Data Sources
MEDLINE, EMBASE, CINAHL, and Cochrane databases through 6 April 2014.
Study Selection
Randomized controlled trials ≥3 weeks conducted in individuals with diabetes that compare the effect of diets emphasizing tree nuts to isocaloric diets without tree nuts on HbA1c, fasting glucose, fasting insulin, and HOMA-IR.
Data Extraction and Synthesis
Two independent reviewer’s extracted relevant data and assessed study quality and risk of bias. Data were pooled by the generic inverse variance method and expressed as mean differences (MD) with 95% CI’s. Heterogeneity was assessed (Cochran Q-statistic) and quantified (I2).
Results
Twelve trials (n = 450) were included. Diets emphasizing tree nuts at a median dose of 56 g/d significantly lowered HbA1c (MD = −0.07% [95% CI:−0.10, −0.03%]; P = 0.0003) and fasting glucose (MD = −0.15 mmol/L [95% CI: −0.27, −0.02 mmol/L]; P = 0.03) compared with control diets. No significant treatment effects were observed for fasting insulin and HOMA-IR, however the direction of effect favoured tree nuts.
Limitations
Majority of trials were of short duration and poor quality.
Conclusions
Pooled analyses show that tree nuts improve glycemic control in individuals with type 2 diabetes, supporting their inclusion in a healthy diet. Owing to the uncertainties in our analyses there is a need for longer, higher quality trials with a focus on using nuts to displace high-glycemic index carbohydrates.
Trial Registration
ClinicalTrials.gov NCT01630980
Introduction
Tree nuts are a healthy source of vegetable protein [1], unsaturated fatty acids [1], [2], fibre [3], antioxidants [4], vitamins (i.e. folic acid, vitamin B6, niacin, tocopherols), minerals (i.e. magnesium, potassium, calcium), and phytochemicals (i.e. phytosterols) [5]. Over the last two decades, a large body of evidence regarding tree nut consumption and related health outcomes has emerged from both epidemiological and controlled trials [1]. A recent large pooled analysis of two of the Harvard cohorts, as well as a recent meta-analysis of prospective cohort studies support an all-cause mortality benefit [6], [7]. There is also strong evidence that tree nuts lower LDL-cholesterol [8], which has resulted in an FDA qualified health claim [9] and their inclusion in heart association guidelines for cardiovascular risk reduction [10], [11].
The data for diabetes related outcomes have not been as consistent. Although some cohort studies show that frequent nut consumption is associated with lower incidence of type 2 diabetes [12], [13], other cohort studies do not [14], [15]. In addition, 2 recent systematic review and meta-analysis of prospective cohort studies showed no overall significant association between nut consumption and type 2 diabetes risk [7], [16], which was consistent with a subgroup analysis of the PREDIMED trial that showed a non-significant reduction in diabetes risk for individuals consuming a Mediterranean diet supplemented with nuts in comparison to a low fat diet [17]. There has been relatively few controlled trials that have specifically investigated the effects of tree nuts on glycemic control. Despite coronary heart disease being a major cause of death in individuals with diabetes, consumption of tree nuts alone have not been included as part of the recommendations in most diabetes guidelines [18]–[20], with the exception of their recent inclusion as part of various dietary/eating patterns (DASH, Mediterranean, vegetarian and vegan, and low carbohydrate diets) in American (ADA) and Canadian (CDA) diabetes association clinical practice guidelines [19], [20].
Primary prevention and management of diabetes through diet and lifestyle modification remains the cornerstone of therapy [21], [22]. In order to provide better evidence-based guidance on the role of tree nuts on glycemic control, a systematic review and meta-analysis of randomized controlled dietary trials was performed to assess the effect of tree nuts under isocaloric conditions on the endpoints HbA1c, fasting glucose, fasting insulin, and homeostasis model assessment of insulin resistance (HOMA-IR) in individuals with diabetes. The primary outcome and measurement of this study consists of a pooled analysis for each glycemic endpoint.
Methods
The Cochrane Handbook for Systematic Reviews of Interventions was followed for the planning and conduct of this meta-analysis [23]. Reporting followed the Preferred Reporting Items for Systematic Reviews and Meta-Analyses (PRISMA) guidelines [24]. The review protocol is available at ClinicalTrials.gov (registration number: NCT01630980).
Data Sources and Searches
We searched the databases MEDLINE, EMBASE, CINAHL, and the Cochrane Central Register of Controlled Trials through 6 April 2014 using the search strategy shown in Table S1. Manual searches of references also supplemented the electronic search.
Study Selection
We included randomized controlled dietary trials that compared a diet emphasizing intake of tree nuts (almonds, Brazil nuts, cashews, hazelnuts, macadamia nuts, pecans, pine nuts, pistachios and walnuts) [25] on HbA1c, fasting glucose, fasting insulin, and HOMA-IR in comparison to diets without tree nuts matched for energy (isocaloric) for a follow-up period ≥3 weeks in people with diabetes. Trials that consisted of a non-randomized treatment allocation, <3 weeks of follow-up duration, non-isocaloric comparisons, lacked a suitable control, were not conducted in individuals with diabetes, or did not provide suitable endpoint data were excluded. No restrictions were placed on language.
Data Extraction and Quality Assessment
Two investigators (EV and SB) independently reviewed all reports that met the inclusion criteria. A standardized form was used to extract relevant information on sample size, subject characteristics (health status, gender, age, weight, etc.), study setting, study design, level of feeding control, nut dose, nut type and form (whole or meal form), comparator, macronutrient breakdown of background diet(s), energy balance, follow-up duration, and funding source. The mean ± SD values were extracted for HbA1c, fasting glucose, fasting insulin, and HOMA-IR. Trials that did not report SD’s were derived from available data (95% CI, P-values, t or F statistics, SE) using standard formulae [23].
The quality of each trial was assessed using the Heyland Methodological Quality Score (MQS) where a maximum score of 13 points could be received on the basis of the trials methods, sample, and intervention [26]. Trials receiving scores of ≥8 were considered to be of higher quality. Disagreements on Heyland MQS scores were reconciled by consensus. Study quality was not assessed for those trials reported exclusively in a published abstract.
Trials were assessed for risk of bias using the Cochrane Risk of Bias Tool [23]. Domains of bias assessed were sequence generation, allocation concealment, blinding, outcome data, and outcome reporting. Trials were marked as high risk of bias when the methodological flaw was likely to have affected the true outcome, low risk of bias if the flaw was deemed inconsequential to the true outcome, and unclear risk of bias when insufficient information was provided to permit judgment. All disagreements were resolved by consensus. Authors were contacted for additional information where necessary [27]–[30].
Data Synthesis and Analysis
Data were analyzed using Review Manager (RevMan), version 5.2 (The Nordic Cochrane Centre, The Cochrane Collaboration, Copenhagen, Denmark) for primary analyses. The difference between the intervention and control arm’s change from baseline value was derived from each trial for the endpoints HbA1c, fasting glucose, fasting insulin, and HOMA-IR. If change from baseline values were not available, end-of-treatment values were used. For trials containing multiple intervention or control arms a weighted average was applied to combine them in order to create single pair-wise comparisons and to mitigate the unit-of-analysis error. Paired analyses were conducted for all crossover trials [31]. Where necessary, a pooled correlation coefficient was derived and used for calculation of an imputed SD for the between-treatment difference for some crossover trials. Correlation coefficients between baseline and end-of-treatment values within each individual crossover trial were derived from the reported within and between treatment SD according to a published formula [31]. These correlation coefficients were transformed into z-scores ± SD, meta-analyzed using inverse-variance weighing, and back transformed to derive the pooled correlation coefficient. Where we could not derive a calculated pooled correlation coefficient for imputing missing SDs we assumed a correlation coefficient of 0.5, as it is a conservative estimate for an expected range of 0–1. A correlation coefficient of 0.5 was assumed in the primary analysis for HbA1c due to insufficient data and in the primary analyses for fasting glucose and insulin owing to considerable heterogeneity between the derived correlation coefficients (only 2 available correlation coefficients available for pooling in both analyses). The values derived from each trial were pooled and analyzed for each endpoint (HbA1c, fasting glucose, fasting insulin, and HOMA-IR) using the generic inverse variance method with random effects models, which was used even in the absence of statistically significant between-study heterogeneity, as they yield more conservative summary effect estimates in the presence of residual heterogeneity. Exceptions were made for the use of fixed-effects models where there were <5 included trials irrespective of heterogeneity or small trials being pooled with larger more precise trials in the absence of statistically significant between-study heterogeneity. Data were expressed as mean differences (MD) with 95% CI. A two-sided p-value <0.05 was set as the level of significance for comparisons of MD.
Inter-study heterogeneity was tested using the Cochran Q-statistic and quantified using the I2-statistic with a significance level set at p-value <0.10. An I2<50%, I2≥50% and I2≥75% were considered to be evidence of “moderate”, “substantial” and “considerable” heterogeneity, respectively [23]. Sources of heterogeneity were explored using sensitivity and subgroup analyses. To determine whether a single trial exerted an undue influence on the overall results, sensitivity analyses were performed in which each individual trial was removed from the meta-analysis and the effect size recalculated with the remaining trials. Sensitivity analyses were also undertaken using correlation coefficients of 0.25, 0.50 and 0.75 to determine whether the overall results were robust to the use of different derived correlation coefficients in paired analyses of crossover trials. A priori subgroup analyses (continuous and categorical) were conducted for baseline values of HbA1c, fasting glucose, fasting insulin and HOMA-IR within the intervention arm, nut type, absolute fiber and saturated fat intake within the intervention arm, difference in fiber and saturated fat intake between the intervention and control arm, change in fiber and saturated fat intake from baseline within the intervention arm, dose, design, follow-up, and study quality (MQS). Post-hoc subgroup analyses were conducted for the difference in percent carbohydrate intake between the control and intervention arm (carbohydrate displacement), sex and BMI. Meta-regression was performed to assess the significance of the subgroup effects with STATA software, version 12.0 (StataCorp, College Station, TX) with a significance level set at p-value <0.05.
Publication bias was investigated by visual inspection of funnel plots and quantitatively assessed using Egger’s and Begg’s tests, where a p-value <0.05 was considered evidence of small study effects.
Results
Search Results
Figure 1 shows the flow of the literature. The search identified a total of 1491 reports, 1447 of which were determined to be irrelevant based on review of titles and abstracts. The remaining 44 reports were retrieved and reviewed in full, of which 33 were excluded. A total of 11 reports containing 12 trials in 450 participants with diabetes [27]–[30], [32]–[38] were selected for analyses. Eight trials reported data for HbA1c (n = 274), 11 for fasting glucose (n = 413), 9 for fasting insulin (n = 286), and 3 for HOMA-IR (n = 107).
Figure 1. Flow of the literature.

Summary of search and selection process consists of the number of studies initially identified through database and manual search, excluded based on title and abstract, reviewed in full, excluded after full review, and final number of trials included in the meta-analysis.
Trial Characteristics
Table 1 shows the characteristics of the 12 included trials (n = 450). Trials were mainly conducted in outpatient settings across 5 countries: United States (6 trials), Australia (2 trials), Iran (2 trials), and 1 trial each from Canada and Taiwan. All trials were randomized and more than half (58%) used a parallel design. Participants tended to be middle aged (median age: 57 years [range: 51–66 years]) with approximately an equal number of men and women (ratio of women to men: 1.2). Median baseline HbA1c, fasting glucose, fasting insulin, and HOMA-IR were 7.0% (53 mmol/mol), 8.1 mmol/L, 108.3 pmol/L, and 5.7, respectively. All trials were conducted in individuals with type 2 diabetes, however, in one of the trials [28] it was not clear whether all participants had diabetes. Mean diabetes duration varied from at least 1 year [30], [32], [35], [37] to ∼7–8 years [33], [34]; otherwise, it was undeclared [27]–[29], [36], [38]. The majority of trials did not explicitly provide information on how diabetes was defined stating only that diabetes had to be previously diagnosed by a physician, and/or treated for at least 1 year. Participants tended to be on antihyperglycemic medications [7 trials [27], [30], [33]–[35], [38]] but not insulin [9 trials reported insulin therapy as part of their exclusion criteria [27], [30], [32], [34]–[38]]. Four trials stated participants were to keep their medication use consistent throughout the trial [30], [33], [34], [38]; otherwise, it was not explicitly stated.
Table 1. Trial Characteristics,
| Study, Year (Reference) | Participants* | Mean Age, y (SD) | Mean Body Weight or BMI (SD) † | Setting ‡ | Design | Feeding Control § | |
| Lovejoy et al, 2002-HF [27] | 30 T2D (13 M, 17 W) | 53.8 (10.4) | 33.0 (5.5) kg/m2 | OP, USA | C | Met | |
| Lovejoy et al, 2002-LF [27] | 30 T2D (13 M, 17 W) | 53.8 (10.4) | 33.0 (5.5) kg/m2 | OP, USA | C | Met | |
| Wien et al, 2003 [28] | 65 O (28 M, 37 W) | OP, USA | P | Supp | |||
| Almond | 53 (2) | 113 (5) kg | |||||
| Control | 57 (2) | 114 (5) kg | |||||
| Tapsell et al, 2004 [37] | 37 T2D (21 M, 16 W) | OP, AUS | P | Supp | |||
| Walnut | 57.7 (9.0) | 87.6 (12.8) kg | |||||
| Control | 60.5 (8.2) | 81.9 (11.2) kg | |||||
| Tapsell et al, 2009 [36] | 35 T2D (−) | 54 (8.7) | OP, AUS | P | Supp | ||
| Walnut | 94.3 (18.1) kg | ||||||
| Control | 93.9 (14.7) kg | ||||||
| Ma et al, 2010 [35] | 22 T2D (−) | 58.1 (9.2) | 89.0 (15.5) kg | OP, USA | C | Supp | |
| Walnut | |||||||
| Control | |||||||
| Cohen et al, 2011 [30] | 13 T2D (7 M, 6 W) | OP, USA | P | Supp | |||
| Almond | 66 (8.1) | 96.1 (21.8) kg | |||||
| Control | 66 (8.7) | 105.1 (29.6) kg | |||||
| Jenkins et al, 2011 [33] | 79 T2D (52 M, 27 W) | OP, CAN | P | Supp | |||
| Mixed nuts | 63 (9) | 80 (15) kg | |||||
| Control | 61 (10) | 83 (15) kg | |||||
| Li et al, 2011 [34] | 20 T2D (9 M, 11 W) | 58 (8.94) | 26.0 (3.13) kg/m2 | OP, TWN | C | Met | |
| Almond | |||||||
| Control | |||||||
| Darvish Damavandi et al, 2012 [32] | 43 T2D (9 M, 34 W) | OP, IRN | P | Supp | |||
| Cashew | 51 (7.9) | 72.1 (13.1) kg | |||||
| Control | 56 (5.7) | 71.9 (9.7) kg | |||||
| Darvish Damavandi et al, 2013 [38] | 48 T2D (15 M, 33 W) | 55.7 (7.74) | OP, IRN | P | Supp | ||
| Hazelnut | 72.13 (10.27) kg | ||||||
| Control | 71.98 (9.58) kg | ||||||
| Sauder et al, 2013 [29] ††† Pistachio Control | 28 T2D (−) | 56.1 (7.67) | 31.2 (6.02) kg/m2 | −, USA | C | Met | |
| Nut Dose, g/d (%E) || | Nut Type¶ | Comparator** | Diet†† | Energy Balance | Follow-Up | MQS ‡‡ | Funding Sources §§ |
| 57–113 (∼18.8) | Almond | High fat diet | 48∶15∶37 | Neutral | 4 wk | 5 | Agency |
| 57–113 (∼18.8) | Almond | Low fat diet | 60∶15∶25 | Neutral | 4 wk | 5 | Agency |
| 84 (∼47.7) | Almond | Self-selected complex CHO’s | Negative | 24 wk | 8 | Agency | |
| 32∶29∶39 53∶29∶18 | |||||||
| 30 (∼9.8) | Walnut | Low fat/modified fat diet | Neutral | 6 month | 6 | Agency | |
| 44∶22∶32 41∶23∶33 | |||||||
| 30 (∼9.8) | Walnut | Low fat diet | Neutral | 12 month | 7 | Agency | |
| 41∶21∶34 42∶24∶29 | |||||||
| 56 (∼20.7) | Walnut | Ad libitum diet | Neutral | 8 wk | 5 | N/A | |
| 39∶17∶45 43∶19∶38 | |||||||
| 28 (∼17.8) |||| | Almond | Cheese sticks | N/A | Neutral | 12 wk | 7 | Agency |
| 50–100 (∼25) | Mixed nuts ¶¶ | NCEP Step 2 diet+Muffin | Neutral*** | 12 wk | 8 | Agency | |
| 41∶18∶41 46∶19∶35 | |||||||
| 56 (20) | Almond | NCEP Step 2 diet | Neutral | 4 wk | 5 | Agency | |
| 47∶17∶37 57∶17∶27 | |||||||
| 30 (10) | Cashew | Regular diet | Neutral | 8 wk | 3 | N/A | |
| 53∶16∶33 57∶16∶27 | |||||||
| 29 (10) | Hazelnut | Regular diet | Neutral | 8 wk | 4 | N/A | |
| 55∶16∶31 60∶17∶25 | |||||||
| ∼71 (20) | Pistachio | Low fat diet | – | 4 wk | – | – | |
| 51∶17∶33 55∶18∶27 | |||||||
BMI = body mass index; C = crossover; CHO = carbohydrate; E = energy; HF = high fat; HOMA-IR = homeostasis model assessment of insulin resistance; IP = inpatient; LF = low fat; M = men; Met = metabolic feeding control; MQS = Heyland Methodological Quality Score; N/A = not available; NCEP = National Cholesterol Education Program; O = obese and overweight; OP = outpatient; P = parallel; SD = standard deviation; Supp = supplement feeding control; T2D = type 2 diabetes; W = women; wk = week; y = years.
*The number of participants listed for each trial in this column is the number of participants that completed the trial and therefore the number used in our analyses. The baseline characteristics reported by these trials were based on the number of participants listed here with the exception of 3 trials, Tapsell et al. [36], Ma et al. [35], and Darvish Damavandi et al. [38] where the values for mean age and/or mean body weight or BMI were derived from the number of participants present at baseline, a number that was different from the number of participants that completed the trial due to a per-protocol with drop-outs analysis. The number of participants present at baseline for these trials are as follows: Tapsell et al. [36], n = 50; Ma et al. [35], n = 24; Darvish Damavandi et al. [38], n = 50; Sauder et al. [29], n = 30.
Baseline body weight or weight (kg) while receiving the control treatment in cross over trials, and baseline body weight in each treatment group in parallel trials. Baseline BMI values (kg/m2) are only reported when no data on weight were available.
Countries are abbreviated using three letter country codes (ISO 3166-1 alpha-3 codes).
Metabolic feeding control (Met) was the provision of all meals, snacks, and study supplements (tree nuts) consumed during the study under controlled conditions. Supplement feeding control (Supp) was the provision of study supplements only.
|| Doses and % E (energy) preceded by “∼” represent values calculated on the basis of average reported energy intake of participants and average reported energy values of tree nuts from the USDA National Nutrient Database [59].
All nut types were provided in whole form with the exception of 2 trials: Lovejoy et al. [27] and Li et al. [34], which incorporated tree nuts into various entrées and snack foods (i.e. muffins, trail mixes, deserts, etc.).
**Comparators refers to 1) reference food(s) energy matched in exchange for tree nuts or 2) isocaloric control diet similar to the intervention diet but without tree nuts.
Planned energy from Carbohydrate:Protein:Fat. Measured energy end values from carbohydrate, protein, and fat are reported only if the study did not state the planned energy of prescribed diets.
Trials with a MQS score ≥8 were considered to be of higher quality.
Agency funding is that from government, university, or not-for-profit health agency sources. None of the trialists declared any conflicts of interest with the exception of Jenkins et al. [33] and Darvish Damavandi et al. [32].
|||| In this study participants randomized into the almond group were instructed to consume this dose 5 days/week.
Mixed nuts included almonds, cashews, hazelnuts, macadamia nuts, peanuts, pecans, pistachios, walnuts.
***43% of the participants were obese and wished to lose weight; although this was not a weight loss study, they were given advice on portion size and fat intake to help them meet their weight-reduction objective.
Data for this study was limited since the study’s conferences abstract and correspondence with the authors were the only sources of available data.
Laboratory measurements of glycemic endpoints across trials varied. HbA1c was measured by high-performance liquid chromatography (HPLC) in 1 trial [33], immunoassay in 3 trials [27], [30], “standard procedures” in 1 trial [35], or unspecified methods in the remaining 3 trials [29], [36], [37]. Fasting glucose was measured by enzymatic methods in 8 trials [27], [28], [30], [32]–[34], [38], “standard procedures” in 1 trial [35], or unspecified methods in the remaining 2 trials [29], [36]. Fasting insulin was measured by a radioimmunoassay in 2 trials [28], [30], an immunoassay in 4 trials [27], [32], [34], “standard procedures” in 1 trial [35], or unspecified methods in the remaining 2 trials [29], [36]. HOMA-IR was calculated according to the standard formula (insulin × glucose/22.5) in 3 trials [28], [34], [35].
Tree nut type varied among the trials: 5 trials (42%) included an intervention with almonds, 1 trial each with cashews, hazelnuts, pistachios, and mixed nuts (including almonds, cashews, hazelnuts, macadamia nuts, peanuts, pecans, pistachios, walnuts), and 3 trials (25%) with walnuts. Tree nuts were consumed as whole nuts in majority of the trials with the exception of 2 trials [27], [34] where tree nuts were provided in meal form as part of entrées and snack foods (i.e. muffins, trail mix, deserts, etc.). The median dose was ∼56 g/d (range: 28–85 g/d). The method of increasing tree nuts while maintaining isocaloric comparisons between arms differed across trial protocols: 3 trials replaced or emphasized reduction in carbohydrate foods [28], [29], [33], 1 replaced sources of dairy (cheese) [30], 1 exchanged tree nuts for protein-rich foods and oils/spreads [37], 1 reduced portions of meats and amount of visible fats (i.e. oils, margarines, and butter) [38], and 6 either did not specify, did not provide specific instructions on food replacement, or information was unavailable [27], [32], [34]–[36] The background diets consisted of 32–60% energy (E) from carbohydrate, 15–29% E protein, and 18–45% E fat with a median fiber and saturated fat intake of 24.6 g/d (range: 11.4–32 g/d) and 7.4% E (range: 3–12.5%E), respectively, in the comparator diets, and 27.6 g/d (range: 16.5–35.6g/d) and 6.9% E (range: 3–10.9%E), respectively, in the tree nut enriched diets. One trial was a weight reduction intervention [28] and 1 trial provided the option of weight reduction during the study period in those who wished to lose weight [33]. In terms of feeding control, 4 trials (33%) were metabolically controlled (i.e. all foods were provided) and 8 trials (67%) provided test food supplements. The median follow-up duration was 8 weeks (range: 4–48 weeks).
The majority of trials (75%) were considered to be of poor quality (MQS<8). Absence of double-blinding and high dropout rates contributed to lower scores (Table S2). Trials were judged as having a ‘low’ or ‘unclear risk bias’ for majority of the domains measured by the Cochrane Risk of Bias Tool. A few trials were considered ‘high risk of bias’ due to incomplete outcome data (Figure S1). Majority of the trials were funded by agency alone (73%); 3 trials did not declare their source of funding [32], [35], [38] and for 1 trial information was unavailable [29].
Hemoglobin A1c (HbA1c)
Figure 2 shows a forest plot of the pooled effect of tree nuts on HbA1c in individuals with type 2 diabetes. Diets emphasizing tree nuts significantly lowered HbA1c in comparison to control diets (MD = −0.07% [95% CI: −0.10, −0.03%]; P = 0.0003) with no significant evidence of inter-study heterogeneity (I2 = 37%; P = 0.13). Systematic removal of individual trials did not alter the results. Sensitivity analyses using different correlation coefficients in paired analyses of crossover trials (0.25 and 0.75) did not alter the significance of the pooled effect size.
Figure 2. Forest plot of randomized controlled trials investigating the effect of diets supplemented with tree nuts on HbA1c in individuals with type 2 diabetes.

Pooled effect estimate (diamond) for HbA1c (%). Data are expressed as weighted mean differences (MD) with 95% CIs, using the generic inverse-variance fixed effects model. Paired analyses were applied to all crossover trials. Inter-study heterogeneity was tested by the Cochran Q-statistic and quantified by I2 at a significance level of P<0.10. n = number of participants in each treatment group.
Table S3 and Figure S2 shows the results of continuous and categorical subgroup analyses for the effect of tree nuts on HbA1c. Meta-regression analyses did not reveal any statistically significant subgroup effects.
Fasting glucose
Figure 3 shows a forest plot of the pooled effect of tree nuts on fasting glucose in individuals with type 2 diabetes. Diets emphasizing tree nuts significantly lowered fasting glucose in comparison to control diets (MD = −0.15 mmol/L [95% CI: −0.27, −0.02 mmol/L]; P = 0.03) with no significant evidence of inter-study heterogeneity (I2 = 35%; P = 0.12). Sensitivity analyses showed that individual removal of any of the following 3 trials changed the pooled effect size from significant to non-significant: Jenkins et al. [33] (MD = −0.14 mmol/L [95% CI: −0.28, −0.00 mmol/L]; P = 0.05] with moderate inter-study heterogeneity (I2 = 41%; P = 0.08); Li et al. [34] (MD = −0.08 mmol/L [95% CI: −0.23, 0.07 mmol/L]; P = 0.31) with no significant evidence of inter-study heterogeneity (I2 = 31%; P = 0.16) and Darvish Damavandi et al. [38] (MD = −0.13 mmol/L [95% CI: −0.26, −0.00 mmol/L]; P = 0.05) with no significant evidence of inter-study heterogeneity (I2 = 31%; P = 0.16). Sensitivity analyses using different correlation coefficients in paired analyses of crossover trials showed that a correlation coefficient of 0.25 did not alter the significance of the pooled effect size, but a correlation coefficient of 0.75 changed the pooled effect size from significant to non-significant (MD = −0.14 mmol/L [95% CI: −0.36, 0.08 mmol/L]; P = 0.20) and resulted in moderate inter-study heterogeneity (I2 = 48%; P = 0.04).
Figure 3. Forest plot of randomized controlled trials investigating the effect of diets supplemented with tree nuts on fasting glucose in individuals with type 2 diabetes.

Pooled effect estimate (diamond) for fasting glucose (mmol/L). Data are expressed as weighted mean differences (MD) with 95% CIs, using the generic inverse-variance fixed effects model. Paired analyses were applied to all crossover trials. Inter-study heterogeneity was tested by the Cochran Q-statistic and quantified by I2 at a significance level of P<0.10. n = number of participants in each treatment group.
Table S4 and Figure S3 shows the results of continuous and categorical subgroup analyses for the effect of tree nuts on fasting glucose. Meta-regression analyses did not reveal any statistically significant subgroup effects.
Fasting insulin
Figure 4 shows a forest plot of the pooled effect of tree nuts on fasting insulin in individuals with type 2 diabetes. Diets emphasizing tree nuts had no significant overall effect on fasting insulin in comparison to control diets (MD = −3.42 pmol/L [95% CI: −10.06, 3.21 pmol/L]; P = 0.31) with substantial evidence of inter-study heterogeneity (I2 = 72%; P = 0.0004). Systematic removal of individual trials did not alter the results. Sensitivity analyses using different correlation coefficients in paired analyses of crossover trials (0.25 and 0.75) did not alter the significance of the pooled effect size.
Figure 4. Forest plot of randomized controlled trials investigating the effect of diets supplemented with tree nuts on fasting insulin in individuals with type 2 diabetes.

Pooled effect estimate (diamond) for fasting insulin (pmol/L). Data are expressed as weighted mean differences (MD) with 95% CIs, using the generic inverse-variance random-effects model. Paired analyses were applied to all crossover trials. Inter-study heterogeneity was tested by the Cochran Q-statistic and quantified by I2 at a significance level of P<0.10. n = number of participants in each treatment group.
Table S5 and Figure S4 shows the results of continuous and categorical subgroup analyses for the effect of tree nuts on fasting insulin. Meta-regression analyses did not reveal any statistically significant subgroup effects.
Homeostasis model assessment of insulin resistance (HOMA-IR)
Figure 5 shows a forest plot of the pooled effect of tree nuts on HOMA-IR in individuals with type 2 diabetes. Diets emphasizing tree nuts had no significant effect on HOMA-IR in comparison to control diets (MD = −0.24 [95% CI: −0.51, 0.04]; P = 0.10) with considerable evidence of inter-study heterogeneity (I2 = 87%; P = 0.0005). Sensitivity analyses showed that removal of the trial Ma et al. (27) changed the pooled effect size from non-significant to significant (MD = −0.63 [95% CI: −0.98, −0.27]; P = 0.0005) with substantial evidence of inter-study heterogeneity (I2 = 65%; P = 0.09).
Figure 5. Forest plots of randomized controlled trials investigating the effect of diets supplemented with tree nuts on HOMA-IR in individuals with type 2 diabetes.
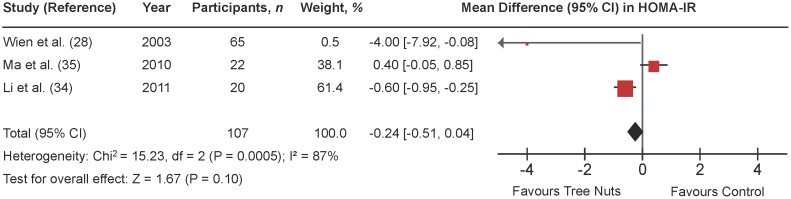
Pooled effect estimate (diamond) for homeostasis model assessment of insulin resistance (HOMA-IR). Data are expressed as weighted mean differences (MD) with 95% CIs, using the generic inverse-variance fixed-effects model. Paired analyses were applied to all crossover trials. Inter-study heterogeneity was tested by the Cochran Q-statistic and quantified by I2 at a significance level of P<0.10. n = number of participants in each treatment group.
Table S6 and Figure S5 shows the results of continuous and categorical subgroup analyses for the effect of tree nuts on HOMA-IR. Meta-regression analyses did not reveal any statistically significant subgroup effects.
Publication bias
Figure 6 (A–D) shows the funnel plots for each glycemic endpoint. Visual inspection of funnel plots revealed asymmetry for fasting insulin, suggesting study effects favouring the tree nut intervention. Egger’s and Begg’s tests did not reveal significant evidence of publication bias for any of the primary analyses. With one exception, these tests should be interpreted with caution, as they were based on <10 trials.
Figure 6. Publication bias funnel plots.

Publication bias funnel plots for HbA1c (A), fasting glucose (B), fasting insulin (C), and HOMA-IR (D). The solid line represents the pooled effect estimate expressed as the weighted mean difference for each analysis. The dashed lines represent pseudo-95% confidence limits. P-values displayed in the top right corner of each funnel plot are derived from quantitative assessment of publication bias by Egger’s and Begg’s tests.
Discussion
To our knowledge this is the first systematic review and meta-analysis of randomized controlled trials to assess the effect of tree nut consumption on HbA1c, fasting glucose, fasting insulin, and/or HOMA-IR in individuals with type 2 diabetes. We included 12 randomized controlled dietary trials looking at the effect of tree nuts on these 4 endpoints in 450 predominantly middle-aged adults. Pooled analyses showed an overall significant lowering of HbA1c of −0.07% and fasting glucose of −0.15 mmol/L at a median dose of 56 g/d over a median duration of ∼8 weeks. Although significant advantages for fasting insulin and HOMA-IR were not seen, the direction of effect favoured the tree nut intervention.
There is limited existing research looking at the ability of nuts to improve glycemic control over the long term. Previous studies looking at dietary patterns including nuts, such as the Mediterranean and the Dietary Approaches to Stop Hypertension (DASH) dietary pattern, are consistent with our findings. In a systematic review of 5 randomized controlled trials [39], as well as several individual randomized controlled trials [40]–[43] including people with type 2 diabetes, a Mediterranean dietary pattern emphasizing nuts showed decreases in HbA1c (from −0.1% to −0.6% absolute reduction), fasting glucose, and the need for antihyperglycemic drugs over a 4 year period [40], [44] in comparison to a conventional dietary pattern. Improvements in other markers related to glycemic control, such as the adiponectin/leptin ratio, have also been reported [45]. Similar findings were found regarding the DASH dietary pattern emphasizing nuts, where a randomized controlled trial conducted in people with type 2 diabetes showed that compared with a control diet (matched for a moderate sodium intake), the DASH dietary pattern was able to improve HbA1c (an absolute reduction of −1.2%) and fasting glucose (−0.92 mmol/L) over an 8 week period [46].
The ability of tree nuts to improve glycemic control may relate to a carbohydrate displacement mechanism by which tree nuts reduce the glycemic load of the diet by displacing high glycemic-index carbohydrates. Of the 3 trials that showed a significant lowering in HbA1c, the two trials contributing the greatest amount of weight to the analysis (>80% collectively) [29], [33] investigated the effect of tree nuts as a means of displacing carbohydrate by ≥5% of energy [33]. The addition of similar trials in future meta-analyses would be expected to strengthen our results, however, it is not clear whether this lowering would reach a clinically meaningful threshold of ≥0.3% [10]. Other proposed factors relate to the micro- and macronutrient profile of nuts, such as magnesium and monounsaturated fat (MUFA) content. Magnesium content of tree nuts can range from 121–376 mg and MUFA from 9–59 g per 100 g [1], providing approximately between 30% to 94% and 14% and 91% of the Daily Value (DV) for magnesium and total fat, respectively [47]. Meta-analyses of prospective cohort studies and randomized double-blind controlled trials looking at magnesium intake in individuals with type 2 diabetes support decreases in diabetes risk [48], [49], as well as benefits for glycemic control [50]. Magnesium is thought to play a key role in insulin-mediated glucose uptake [51], [52], where animal studies have shown poor intracellular magnesium concentrations to result in defective tyrosine-kinase activity at the insulin-receptor level and therefore impairing insulin action [52], [53]. Similarly, in a meta-analysis of randomized controlled trials looking at the effects of MUFA on glycemic control in individuals with abnormal glucose metabolism, diets high in MUFA were shown to significantly reduce HbA1c [54]. Human trials and animal studies suggest that MUFA may also be involved in the insulin-signaling pathway by playing a role in membrane translocation of glucose transporters in skeletal muscle, as well as by buffering β-cell hyperactivity and insulin resistance [54]–[56]. Although our results do not show significant improvements in insulin resistance by HOMA or fasting insulin levels, there were a limited number of trials and a significant amount of heterogeneity present in the primary analyses. In addition, neither endpoint is a good marker of peripheral insulin sensitivity [57]. Overall, these proposed mechanisms suggest that carbohydrate displacement, magnesium and MUFA content of nuts may be contributing factors in facilitating the effect seen on glycemic control.
Heterogeneity was not explained by majority of the subgroup analyses, where only two subgroups, follow-up and study design in the categorical subgroup analyses for HbA1c, approached significance. Trials of ≥12 weeks showed a greater lowering-effect of tree nuts on HbA1c than trials of <12 weeks. These results suggest that tree nut consumption over a longer period (from 12 weeks to 24 months among available trials) may lead to greater improvements in glycemic control. Similarly, trials using a parallel design showed a greater lowering-effect of tree nuts on HbA1c than those using a crossover design. The smaller effect of tree nuts in crossover designs may be attributed to carry-over effects [23]. In our meta-analysis, all 5 trials with a crossover design contained a washout period ranging from 1–8 weeks. Since HbA1c reflects mean glycemia for the previous 3 months [58], it is not certain whether this is long enough to diminish any potential carry-over effects.
Several limitations exist in the present meta-analysis that complicates the interpretation of our results. First, it is uncertain whether the length of the follow-up period in these trials is enough time for tree nuts to significantly alter glycemic control. HbA1c levels reflect blood glucose levels in the preceding 3 months (∼90 days or 12 weeks) [58], whereas more than half of the trials (54%) were less than 12 weeks in duration. Second, there was evidence of substantial and considerable between study heterogeneity in the overall primary analyses for fasting insulin and HOMA-IR, respectively, which was not explained by any of the a priori and post-hoc subgroup analyses. In addition, majority of subgroup analyses were underpowered and it was not possible to assess the effect of other factors that may influence glycemic control (i.e. growing conditions of tree nuts) due to unavailability of data. Third, the majority of the trials (81%) were of poor study quality (MQS<8), however, no effect modification by study quality was found in the subgroup analyses. Fourth, a portion of the trials (27%) did not focus on glycemic control endpoints as their primary outcome.
In conclusion, the present systematic review and meta-analysis of randomized controlled trials shows that a daily median intake of 56 g (∼2 ounces or ∼½ cup) of tree nuts over a median duration of 8 weeks significantly reduces HbA1c and fasting glucose in individuals with type 2 diabetes. Although significant advantages were not seen for fasting insulin and HOMA-IR, the direction of effect favoured tree nuts. The greatest advantages appear to be seen in trials using tree nuts to displace high-glycemic index carbohydrate to affect a low-glycemic load diet. To address the sources of uncertainty in our analyses, there is a need for large, longer, higher quality trials using tree nuts to lower the glycemic load of the diet by displacing high-glycemic index carbohydrates with a specific focus on glycemic endpoints as a primary outcome. The inclusion of such trials in future meta-analyses will help guide the development of nutrition recommendations and health claims, as well as the planning of future trials. Overall, our data support the inclusion of tree nuts as part of a healthy diet for the management of glycemia in individuals with type 2 diabetes.
Supporting Information
Cochrane Risk of Bias Graph. Risk of bias graph: review authors’ judgments about each risk of bias item presented as percentages across all included studies (with the exception of Sauder et al. [29]).
(TIFF)
Categorical a priori and post-hoc subgroup analyses for HbA1c. CHO = carbohydrate; N = number of subjects; MQS = Heyland Methodological Quality Score; SFA = saturated fatty acid. Point estimates for each subgroup level (diamonds) are the pooled effect estimates. The dashed line represents the pooled estimate for the overall (total) analysis. The residual I2 value indicates heterogeneity unexplained by the subgroup. Pairwise between-subgroup mean differences (95%CIs) for nut type were as follows: 0.15 [−0.20, 0.49] (1 vs. 4); 0.18 [−0.18, 0.55] (1 vs. 5); 0.04 [−0.33, 0.40] (1 vs. 6); −0.03 [−0.23, 0.16] (4 vs. 5); 0.11 [−0.09, 0.31] (4 vs. 6); 0.14 [−0.09, 0.37] (5 vs. 6). Absolute intakes represent intakes within the treatment arm. Between arm differences represent the difference between the treatment (T) and control (C) arm (T–C). Within arm differences represent the difference between end (E) and baseline (B) values within the treatment arm (E–B). *Statistically significant between subgroups (P<0.05).
(PDF)
Categorical a priori and post-hoc subgroup analyses for fasting glucose. CHO = carbohydrate; N = number of subjects; MQS = Heyland Methodological Quality Score; SFA = saturated fatty acid. Point estimates for each subgroup level (diamonds) are the pooled effect estimates. The dashed line represents the pooled estimate for the overall (total) analysis. The residual I2 value indicates heterogeneity unexplained by the subgroup. Pairwise between-subgroup mean differences (95%CIs) for nut type were as follows: −0.81 [−2.41, 0.79] (1 vs. 2); −0.65 [−2.03, 0.73] (1 vs. 3); 0.23 [−0.15, 0.61] (1 vs. 4); 0.73 [−0.14, 1.60] (1 vs. 5); 0.09 [−0.46, 0.64] (1 vs. 6); −0.16 [−2.23, 1.91] (2 vs. 3); −1.04 [−2.64, 0.56] (2 vs. 4); −1.54 [−3.32, 0.23] (2 vs. 5); −0.90 [−2.55, 0.75] (2 vs. 6); −0.88 [−2.25, 0.49] (3 vs. 4); −1.38 [−2.97, 0.20] (3 vs. 5); −0.74 [−2.17, 0.69] (3 vs. 6); −0.50 [−1.37, 0.36] (4 vs. 5); 0.14 [−0.40, 0.68] (4 vs. 6); 0.64 [−0.31, 1.59] (5 vs. 6). Absolute intakes represent intakes within the treatment arm. Between arm differences represent the difference between the treatment (T) and control (C) arm (T–C). Within arm differences represent the difference between end (E) and baseline (B) values within the treatment arm (E–B). *Statistically significant between subgroups (P<0.05).
(PDF)
Categorical a priori and post-hoc subgroup analyses for fasting insulin. CHO = carbohydrate; N = number of subjects; MQS = Heyland Methodological Quality Score; SFA = saturated fatty acid. Point estimates for each subgroup level (diamonds) are the pooled effect estimates. The dashed line represents the pooled estimate for the overall (total) analysis. The residual I2 value indicates heterogeneity unexplained by the subgroup. Pairwise between-subgroup mean differences (95%CIs) for nut type were as follows: −13.00 [−65.37, 39.37] (1 vs. 2); 6.45 [−38.57, 51.47] (1 vs. 4); 20.81 [−19.98, 61.59] (1 vs. 5); −19.45 [−79.26, 40.36] (2 vs. 4); −31.81 [−90.50, 22.88] (2 vs. 5); −14.36 [−64.34, 35.63] (4 vs. 5). Absolute intakes represent intakes within the treatment arm. Between arm differences represent the difference between the treatment (T) and control (C) arm (T–C). Within arm differences represent the difference between end (E) and baseline (B) values within the treatment arm (E–B). * Statistically significant between subgroups (P<0.05).
(PDF)
Categorical a priori and post-hoc subgroup analyses for HOMA-IR. CHO = carbohydrate; N = number of subjects; MQS = Heyland Methodological Quality Score; SFA = saturated fatty acid. Point estimates for each subgroup level (diamonds) are the pooled effect estimates. The dashed line represents the pooled estimate for the overall (total) analysis. The residual I2 value indicates heterogeneity unexplained by the subgroup. Absolute intakes represent intakes within the treatment arm. Between arm differences represent the difference between the treatment (T) and control (C) arm (T–C). Within arm differences represent the difference between end (E) and baseline (B) values within the treatment arm (E–B). * Statistically significant between subgroups (P<0.05).
(PDF)
Search strategy. For all databases, the original search was 23 May 2012; updated searches were performed 14 May 2013 and 6 April 2014.
(DOCX)
Study Quality Assessment using the Heyland MQS*. HF = high fat diet; LF = low fat diet; MQS = Methodological Quality Score. * The Heyland MQS assigns a score of 0 or 1 or from 0 to 2 over 9 categories of quality related to study design, sampling procedures, and interventions for a total of 13 points. Trials that scored ≥8 were considered to be of higher quality [25]. † Randomization was scored 2 points for being randomized with the methods described, 1 point for being randomized without the methods described, or 0 points for being neither randomized nor having the methods described. Blinding was scored 1 point for being double-blind or 0 points for “other.” Analysis was scored 2 points for being intention-to-treat; all other types of analyses scored 0 points. ‡ Sample selection was scored 1 point for being consecutive eligible or 0 points for being preselected or indeterminate. Sample comparability was scored 1 point for being comparable or 0 points for not being comparable at baseline. Follow-up was scored 1 point for being 100% or 0 points for <100%. § Treatment protocol was scored 1 point for being reproducibly described or 0 points for being poorly described. Co-interventions were scored 2 points for being described and equal, 1 point for being described but unequal or indeterminate, or 0 points for not being described. Treatment crossovers (where participants were switched from the control treatment to the experimental treatment) were scored 2 points for being <10%, 1 point for being >10%, and 0 points for not being described. || Study quality for this study was not assessed since data for this study was limited (the study’s conferences abstract and correspondence with the authors were the only sources of available data).
(DOCX)
Continuous a priori and post-hoc subgroup analyses for HbA1c. BMI = body mass index; CHO = carbohydrate; E = energy; M = males; N = number of subjects; No. = number; SFA = saturated fatty acid. β is the slope derived from subgroup analyses on meta-regression analyses and represents the treatment effect of tree nuts for each subgroup. The residual I2 value indicates heterogeneity unexplained by the subgroup. Absolute intakes represent intakes within the treatment arm. Between arm differences represent the difference between the treatment (T) and control (C) arm (T–C). Within arm differences represent the difference between end (E) and baseline (B) values within the treatment arm (E–B). *Statistically significant between subgroups (P<0.05).
(DOCX)
Continuous a priori and post-hoc subgroup analyses for fasting glucose. BMI = body mass index; CHO = carbohydrate; E = energy; M = males; N = number of subjects; No. = number; SFA = saturated fatty acid. β is the slope derived from subgroup analyses on meta-regression analyses and represents the treatment effect of tree nuts for each subgroup. The residual I2 value indicates heterogeneity unexplained by the subgroup. Absolute intakes represent intakes within the treatment arm. Between arm differences represent the difference between the treatment (T) and control (C) arm (T–C). Within arm differences represent the difference between end (E) and baseline (B) values within the treatment arm (E–B). * Statistically significant between subgroups (P<0.05).
(DOCX)
Continuous a priori and post-hoc subgroup analyses for fasting insulin. BMI = body mass index; CHO = carbohydrate; E = energy; M = males; N = number of subjects; No. = number; SFA = saturated fatty acid. β is the slope derived from subgroup analyses on meta-regression analyses and represents the treatment effect of tree nuts for each subgroup. The residual I2 value indicates heterogeneity unexplained by the subgroup. Absolute intakes represent intakes within the treatment arm. Between arm differences represent the difference between the treatment (T) and control (C) arm (T–C). Within arm differences represent the difference between end (E) and baseline (B) values within the treatment arm (E–B). * Statistically significant between subgroups (P<0.05).
(DOCX)
Continuous a priori and post-hoc subgroup analyses for HOMA-IR. BMI = body mass index; CHO = carbohydrate; E = energy; N = number of subjects; No. = number; SFA = saturated fatty acid. β is the slope derived from subgroup analyses on meta-regression analyses and represents the treatment effect of tree nuts for each subgroup. The residual I2 value indicates heterogeneity unexplained by the subgroup. Absolute intakes represent intakes within the treatment arm. Between arm differences represent the difference between the treatment (T) and control (C) arm (T–C). Within arm differences represent the difference between end (E) and baseline(B) values within the treatment arm (E–B). * Statistically significant between subgroups (P<0.05).
(DOCX)
CONSORT checklist.
(DOC)
Trial protocol.
(PDF)
Acknowledgments
We wish to thank Teruko Kishibe of Li Ka Shing’s International Healthcare Education Centre at St. Michael Hospital for her help in the development of the search strategy.
Funding Statement
This work was supported by the International Tree Nut Council Nutrition Research & Education Foundation and (Davis, California) and the Canadian Institutes of Health Research (funding reference number, 129920) through the Canada-wide Human Nutrition Trialists’ Network (NTN). The Diet, Digestive tract, and Disease (3-D) Centre, funded through the Canada Foundation for Innovation (CFI) and the Ministry of Research and Innovation’s Ontario Research Fund (ORF), provided the infrastructure for the conduct of this project. VH and AC were funded by Province of Ontario Graduate Scholarships. AC was also funded by a Canadian Institutes of Health Research (CIHR)-Fredrick Banting and Charles Best Canada Graduate Scholarship and Banting and Best Diabetes Centre (BBDC)-Novo Nordisk Studentship. RJdS was funded by a CIHR Postdoctoral Fellowship Award. DJAJ was funded by the Government of Canada through the Canada Research Chair Endowment. None of the sponsors had a role in any aspect of the present study, including design and conduct of the study; collection, management, analysis, and interpretation of the data; and preparation, review, approval of the manuscript or decision to publish.
References
- 1. Ros E (2010) Health benefits of nut consumption. Nutrients 2(7): 652–682. [DOI] [PMC free article] [PubMed] [Google Scholar]
- 2. Kris-Etherton PM, Hu FB, Ros E, Sabaté J (2008) The role of tree nuts and peanuts in the prevention of coronary heart disease: multiple potential mechanisms. J Nutr 138(9): 1746S–1751S. [DOI] [PubMed] [Google Scholar]
- 3. Salas-Salvadó J, Bulló M, Perez-Heras A, Ros E (2006) Dietary fibre, nuts and cardiovascular diseases. Br J Nutr 96 Suppl 2S46–51. [DOI] [PubMed] [Google Scholar]
- 4. Bulló M, Lamuela-Raventós R, Salas-Salvadó J (2011) Mediterranean diet and oxidation: nuts and olive oil as important sources of fat and antioxidants. Curr Top Med Chem 11(14): 1797–1810. [DOI] [PubMed] [Google Scholar]
- 5. Segura R, Javierre C, Lizarraga MA, Ros E (2006) Other relevant components of nuts: phytosterols, folate and minerals. Br J Nutr 96 Suppl 2S36–44. [DOI] [PubMed] [Google Scholar]
- 6. Bao Y, Han J, Hu FB, Giovannucci EL, Stampfer MJ, et al. (2013) Association of nut consumption with total and cause-specific mortality. N Engl J Med 369(21): 2001–2011. [DOI] [PMC free article] [PubMed] [Google Scholar]
- 7.Luo C, Zhang Y, Ding Y, Shan Z, Chen S, et al.. (2014) Nut consumption and risk of type 2 diabetes, cardiovascular disease, and all-cause mortality: a systematic review and meta-analysis. Am J Clin Nutr. [Epub ahead of print] [DOI] [PubMed]
- 8. Sabaté J, Oda K, Ros E (2010) Nut consumption and blood lipid levels: a pooled analysis of 25 intervention trials. Arch Intern Med 170(9): 821–827. [DOI] [PubMed] [Google Scholar]
- 9.US Food and Drug Administration (FDA). Qualified health claims: Letter of enforcement discretion-nuts and coronary heart disease (Docket No 02P-0505) [accessed June 4 2014]. Available from: http://www.fda.gov/food/ingredientspackaginglabeling/labelingnutrition/ucm072926.htm.
- 10. Lichtenstein AH, Appel LJ, Brands M, Carnethon M, Daniels S, et al. (2006) Diet and lifestyle recommendations revision 2006: a scientific statement from the American Heart Association Nutrition Committee. Circulation 114(1): 82–96. [DOI] [PubMed] [Google Scholar]
- 11. National Cholesterol Education Program (NCEP) Expert Panel on Detection, Evaluation, and Treatment of High Blood Cholesterol in Adults (Adult Treatment Panel III) (2002) Third Report of the National Cholesterol Education Program (NCEP) Expert Panel on Detection, Evaluation, and Treatment of High Blood Cholesterol in Adults (Adult Treatment Panel III) final report. Circulation 106(25): 3143–3421. [PubMed] [Google Scholar]
- 12. Pan A SQ MJ, Willett WC, Hu FB (2013) Walnut consumption is associated with lower risk of type 2 diabetes in women. The Journal of Nutrition 143(4): 512–518. [DOI] [PMC free article] [PubMed] [Google Scholar]
- 13. Jiang R, Manson JE, Stampfer MJ, Liu S, Willett WC, et al. (2002) Nut and peanut butter consumption and risk of type 2 diabetes in women. JAMA 288(20): 2554–2560. [DOI] [PubMed] [Google Scholar]
- 14. Kochar J, Gaziano JM, Djousse L (2010) Nut consumption and risk of type II diabetes in the Physicians' Health Study. Eur J Clin Nutr 64(1): 75–79. [DOI] [PMC free article] [PubMed] [Google Scholar]
- 15.Parker ED, Harnack LJ, Folsom AR (2003) Nut consumption and risk of type 2 diabetes. JAMA 290(1): 38–39; author reply 39–40. [DOI] [PubMed]
- 16.Zhou D YH, He F, Reilly KH, Zhang J, Li S, Zhang T, Wang B, Ding Y, Xi B (2014) Nut consumption in relation to cardiovascular risk and type 2 diabetes: a systematic review and meta-analysis of prospective studies. Am J Clin Nutr. [Epub ahead of print]. [DOI] [PubMed]
- 17. Salas-Salvado J, Bullo M, Estruch R, Ros E, Covas MI, et al. (2014) Prevention of Diabetes With Mediterranean Diets A Subgroup Analysis of a Randomized Trial. Ann Intern Med 160(1): 1–10. [DOI] [PubMed] [Google Scholar]
- 18. Mann JI, De Leeuw I, Hermansen K, Karamanos B, Karlstrom B, et al. (2004) Evidence-based nutritional approaches to the treatment and prevention of diabetes mellitus. Nutr Metab Cardiovasc Dis 14(6): 373–394. [DOI] [PubMed] [Google Scholar]
- 19. Evert AB, Boucher JL, Cypress M, Dunbar SA, Franz MJ, et al. (2013) Nutrition therapy recommendations for the management of adults with diabetes. Diabetes Care 36(11): 3821–3842. [DOI] [PMC free article] [PubMed] [Google Scholar]
- 20.Canadian Diabetes Association Clinical Practice Guidelines Expert Committee (2013) Canadian Diabetes Association 2013 Clinical Practice Guidelines for the Prevention and Management of Diabetes in Canada. Can J Diabetes (suppl 1): S1–S212. [DOI] [PubMed]
- 21. Kendall CW, Josse AR, Esfahani A, Jenkins DJ (2010) Nuts, metabolic syndrome and diabetes. Br J Nutr 104(4): 465–473. [DOI] [PubMed] [Google Scholar]
- 22. Salas-Salvadó J, Martinez-González MÁ, Bulló M, Ros E (2011) The role of diet in the prevention of type 2 diabetes. Nutr Metab Cardiovasc Dis 21 Suppl 2B32–48. [DOI] [PubMed] [Google Scholar]
- 23.Higgins JPT Green S (editors) (2011) Cochrane Handbook for Systematic Reviews of Interventions Version 5.1.0 [updated March 2011]. The Cochrane Collaboration. Available from: www.cochrane-handbook.org.
- 24. Moher D, Liberati A, Tetzlaff J, Altman DG (2009) Preferred reporting items for systematic reviews and meta-analyses: the PRISMA statement. PLoS Med 6(7): e1000097. [DOI] [PMC free article] [PubMed] [Google Scholar]
- 25.Alasalvar C, Shahidi F (2009) Tree nuts : composition, phytochemicals, and health effects. Boca Raton: CRC Press.
- 26. Heyland DK NF, Drover JW, Jain M, Su X, Suchner U (2001) Should immunonutrition become routine in critically ill patients? A systematic review of the evidence. JAMA 286(8): 944–953. [DOI] [PubMed] [Google Scholar]
- 27. Lovejoy JC, Most MM, Lefevre M, Greenway FL, Rood JC (2002) Effect of diets enriched in almonds on insulin action and serum lipids in adults with normal glucose tolerance or type 2 diabetes. Am J Clin Nutr 76(5): 1000–1006. [DOI] [PubMed] [Google Scholar]
- 28. Wien MA, Sabate JM, Ikle DN, Cole SE, Kandeel FR (2003) Almonds vs complex carbohydrates in a weight reduction program. Int J Obes Relat Metab Disord 27(11): 1365–1372. [DOI] [PubMed] [Google Scholar]
- 29. Sauder KA, McCrea CE, Kris-Etherton PM, Ulbrecht JS, West SG (2013) Effect of pistachios on lipids, lipoproteins, glucose metabolism, and insulin sensitivity in type 2 diabetes. FASEB Journal 2013 27: 368.4. [Google Scholar]
- 30. Cohen AE, Johnston CS (2011) Almond ingestion at mealtime reduces postprandial glycemia and chronic ingestion reduces hemoglobin A(1c) in individuals with well-controlled type 2 diabetes mellitus. Metabolism-Clinical and Experimental 60(9): 1312–1317. [DOI] [PubMed] [Google Scholar]
- 31. Elbourne DR, Altman DG, Higgins JP, Curtin F, Worthington HV, et al. (2002) Meta-analyses involving cross-over trials: methodological issues. Int J Epidemiol 31(1): 140–149. [DOI] [PubMed] [Google Scholar]
- 32. Darvish Damavandi R SF, Rajab A, Mohammadi V, Hosseini Sh (2012) The effects cashew consumption on serum glucose, insulin and lipoprotein in type 2 diabetic patients. Iranian Journal of Endocrinology and Metabolism 14(4): 325–334. [Google Scholar]
- 33. Jenkins DJA, Kendall CWC, Banach MS, Srichaikul K, Vidgen E, et al. (2011) Nuts as a Replacement for Carbohydrates in the Diabetic Diet. Diabetes Care 34(8): 1706–1711. [DOI] [PMC free article] [PubMed] [Google Scholar] [Retracted]
- 34. Li SC, Liu YH, Liu JF, Chang WH, Chen CM, et al. (2011) Almond consumption improved glycemic control and lipid profiles in patients with type 2 diabetes mellitus. Metabolism-Clinical and Experimental 60(4): 474–479. [DOI] [PubMed] [Google Scholar]
- 35. Ma Y, Njike VY, Millet J, Dutta S, Doughty K, et al. (2010) Effects of walnut consumption on endothelial function in type 2 diabetic subjects: a randomized controlled crossover trial. Diabetes Care 33(2): 227–232. [DOI] [PMC free article] [PubMed] [Google Scholar]
- 36. Tapsell LC, Batterham MJ, Teuss G, Tan SY, Dalton S, et al. (2009) Long-term effects of increased dietary polyunsaturated fat from walnuts on metabolic parameters in type II diabetes. Eur J Clin Nutr 63(8): 1008–1015. [DOI] [PubMed] [Google Scholar]
- 37. Tapsell LC, Gillen LJ, Patch CS, Batterham M, Owen A, et al. (2004) Including walnuts in a low-fat/modified-fat diet improves HDL cholesterol-to-total cholesterol ratios in patients with type 2 diabetes. Diabetes Care 27(12): 2777–2783. [DOI] [PubMed] [Google Scholar]
- 38. Damavandi RD ES, Shidfar F, Heydari I, Foroushani AR (2013) Effects of hazelnuts consumption on fasting blood sugar and lipoproteins in patients with type 2 diabetes. J Res Med Sci 18(4): 314–321. [PMC free article] [PubMed] [Google Scholar]
- 39. Esposito K, Maiorino MI, Ceriello A, Giugliano D (2010) Prevention and control of type 2 diabetes by Mediterranean diet: a systematic review. Diabetes Res Clin Pract 89(2): 97–102. [DOI] [PubMed] [Google Scholar]
- 40. Esposito K, Maiorino MI, Ciotola M, Di Palo C, Scognamiglio P, et al. (2009) Effects of a Mediterranean-style diet on the need for antihyperglycemic drug therapy in patients with newly diagnosed type 2 diabetes: a randomized trial. Ann Intern Med 151(5): 306–314. [DOI] [PubMed] [Google Scholar]
- 41. Shai I, Schwarzfuchs D, Henkin Y, Shahar DR, Witkow S, et al. (2008) Weight loss with a low-carbohydrate, Mediterranean, or low-fat diet. N Engl J Med 359(3): 229–241. [DOI] [PubMed] [Google Scholar]
- 42. Elhayany A, Lustman A, Abel R, Attal-Singer J, Vinker S (2010) A low carbohydrate Mediterranean diet improves cardiovascular risk factors and diabetes control among overweight patients with type 2 diabetes mellitus: a 1-year prospective randomized intervention study. Diabetes Obes Metab 12(3): 204–209. [DOI] [PubMed] [Google Scholar]
- 43. Singh RB, Dubnov G, Niaz MA, Ghosh S, Singh R, et al. (2002) Effect of an Indo-Mediterranean diet on progression of coronary artery disease in high risk patients (Indo-Mediterranean Diet Heart Study): a randomised single-blind trial. Lancet 360(9344): 1455–1461. [DOI] [PubMed] [Google Scholar]
- 44. Sievenpiper JL, Dworatzek PD (2013) Food and dietary pattern-based recommendations: an emerging approach to clinical practice guidelines for nutrition therapy in diabetes. Can J Diabetes 37(1): 51–57. [DOI] [PubMed] [Google Scholar]
- 45.Lasa A, Miranda J, Bulló M, Casas R, Salas-Salvadó J, et al.. (2014) Comparative effect of two Mediterranean diets versus a low-fat diet on glycaemic control in individuals with type 2 diabetes. Eur J Clin Nutr. [Epub ahead of print]. [DOI] [PubMed]
- 46. Azadbakht L FN, Karimi M, Baghaei MH, Surkan PJ, Rahimi M, Esmaillzadeh A, Willett WC (2011) Effects of the Dietary Approaches to Stop Hypertension (DASH) eating plan on cardiovascular risks among type 2 diabetic patients: a randomized crossover clinical trial. Diabetes Care 34(1): 55–57. [DOI] [PMC free article] [PubMed] [Google Scholar]
- 47.US Food and Drug Administration (FDA) (2009) Guidance for Industry: A Food Labeling Guide [accessed June 4 2014]. Available from: http://www.fda.gov/food/guidanceregulation/guidancedocumentsregulatoryinformation/labelingnutrition/ucm2006828.htm
- 48. Dong JY, Xun P, He K, Qin LQ (2011) Magnesium intake and risk of type 2 diabetes: meta-analysis of prospective cohort studies. Diabetes Care 34(9): 2116–2122. [DOI] [PMC free article] [PubMed] [Google Scholar]
- 49. Larsson SC, Wolk A (2007) Magnesium intake and risk of type 2 diabetes: a meta-analysis. J Intern Med 262(2): 208–214. [DOI] [PubMed] [Google Scholar]
- 50. Song Y, He K, Levitan EB, Manson JE, Liu S (2006) Effects of oral magnesium supplementation on glycaemic control in Type 2 diabetes: a meta-analysis of randomized double-blind controlled trials. Diabet Med 23(10): 1050–1056. [DOI] [PubMed] [Google Scholar]
- 51. Casas-Agustench P, Bulló M, Salas-Salvadó J (2010) Nuts, inflammation and insulin resistance. Asia Pac J Clin Nutr 19(1): 124–130. [PubMed] [Google Scholar]
- 52. Barbagallo M, Dominguez LJ, Galioto A, Ferlisi A, Cani C, et al. (2003) Role of magnesium in insulin action, diabetes and cardio-metabolic syndrome X. Mol Aspects Med. 24(1–3): 39–52. [DOI] [PubMed] [Google Scholar]
- 53. Suárez A PN, Casla A, Casanova B, Arrieta FJ, Rovira A (1995) Impaired tyrosine-kinase activity of muscle insulin receptors form hypomagnesaemia rats. Diabetologia 38(11): 1262–1270. [DOI] [PubMed] [Google Scholar]
- 54. Schwingshackl L, Strasser B, Hoffmann G (2011) Effects of monounsaturated fatty acids on glycaemic control in patients with abnormal glucose metabolism: a systematic review and meta-analysis. Ann Nutr Metab 58(4): 290–296. [DOI] [PubMed] [Google Scholar]
- 55. Lopez S, Bermudez B, Ortega A, Varela LM, Pacheco YM, Villar J, Abia R, Muriana FJ (2011) Effects of meals rich in either monounsaturated or saturated fat on lipid concentrations and on insulin secretion and action in subjects with high fasting triglyceride concentrations. Am J Clin Nutr 93(3): 494–499. [DOI] [PubMed] [Google Scholar]
- 56. Moon JH, Lee JY, Kang SB, Park JS, Lee BW, Kang ES, Ahn CW, Lee HC, Cha BS (2010) Dietary monounsaturated fatty acids but not saturated fatty acids preserve the insulin signaling pathway via IRS-1/PI3K in rat skeletal muscle. Lipids 45(12): 1109–1116. [DOI] [PubMed] [Google Scholar]
- 57. Matsuda M, DeFronzo RA (1999) Insulin sensitivity indices obtained from oral glucose tolerance testing: comparison with the euglycemic insulin clamp. Diabetes Care 22(9): 1462–1470. [DOI] [PubMed] [Google Scholar]
- 58. Saudek CD, Kalyani RR, Derr RL (2005) Assessment of glycemia in diabetes mellitus: hemoglobin A1c. J Assoc Physicians India 53: 299–305. [PubMed] [Google Scholar]
- 59.U.S. Department of Agriculture, Agricultural Research Service (2013) USDA National Nutrient Database for Standard Reference, Release 14. Nutrient Data Laboratory Home Page, http://www.ars.usda.gov/ba/bhnrc/ndl
Associated Data
This section collects any data citations, data availability statements, or supplementary materials included in this article.
Supplementary Materials
Cochrane Risk of Bias Graph. Risk of bias graph: review authors’ judgments about each risk of bias item presented as percentages across all included studies (with the exception of Sauder et al. [29]).
(TIFF)
Categorical a priori and post-hoc subgroup analyses for HbA1c. CHO = carbohydrate; N = number of subjects; MQS = Heyland Methodological Quality Score; SFA = saturated fatty acid. Point estimates for each subgroup level (diamonds) are the pooled effect estimates. The dashed line represents the pooled estimate for the overall (total) analysis. The residual I2 value indicates heterogeneity unexplained by the subgroup. Pairwise between-subgroup mean differences (95%CIs) for nut type were as follows: 0.15 [−0.20, 0.49] (1 vs. 4); 0.18 [−0.18, 0.55] (1 vs. 5); 0.04 [−0.33, 0.40] (1 vs. 6); −0.03 [−0.23, 0.16] (4 vs. 5); 0.11 [−0.09, 0.31] (4 vs. 6); 0.14 [−0.09, 0.37] (5 vs. 6). Absolute intakes represent intakes within the treatment arm. Between arm differences represent the difference between the treatment (T) and control (C) arm (T–C). Within arm differences represent the difference between end (E) and baseline (B) values within the treatment arm (E–B). *Statistically significant between subgroups (P<0.05).
(PDF)
Categorical a priori and post-hoc subgroup analyses for fasting glucose. CHO = carbohydrate; N = number of subjects; MQS = Heyland Methodological Quality Score; SFA = saturated fatty acid. Point estimates for each subgroup level (diamonds) are the pooled effect estimates. The dashed line represents the pooled estimate for the overall (total) analysis. The residual I2 value indicates heterogeneity unexplained by the subgroup. Pairwise between-subgroup mean differences (95%CIs) for nut type were as follows: −0.81 [−2.41, 0.79] (1 vs. 2); −0.65 [−2.03, 0.73] (1 vs. 3); 0.23 [−0.15, 0.61] (1 vs. 4); 0.73 [−0.14, 1.60] (1 vs. 5); 0.09 [−0.46, 0.64] (1 vs. 6); −0.16 [−2.23, 1.91] (2 vs. 3); −1.04 [−2.64, 0.56] (2 vs. 4); −1.54 [−3.32, 0.23] (2 vs. 5); −0.90 [−2.55, 0.75] (2 vs. 6); −0.88 [−2.25, 0.49] (3 vs. 4); −1.38 [−2.97, 0.20] (3 vs. 5); −0.74 [−2.17, 0.69] (3 vs. 6); −0.50 [−1.37, 0.36] (4 vs. 5); 0.14 [−0.40, 0.68] (4 vs. 6); 0.64 [−0.31, 1.59] (5 vs. 6). Absolute intakes represent intakes within the treatment arm. Between arm differences represent the difference between the treatment (T) and control (C) arm (T–C). Within arm differences represent the difference between end (E) and baseline (B) values within the treatment arm (E–B). *Statistically significant between subgroups (P<0.05).
(PDF)
Categorical a priori and post-hoc subgroup analyses for fasting insulin. CHO = carbohydrate; N = number of subjects; MQS = Heyland Methodological Quality Score; SFA = saturated fatty acid. Point estimates for each subgroup level (diamonds) are the pooled effect estimates. The dashed line represents the pooled estimate for the overall (total) analysis. The residual I2 value indicates heterogeneity unexplained by the subgroup. Pairwise between-subgroup mean differences (95%CIs) for nut type were as follows: −13.00 [−65.37, 39.37] (1 vs. 2); 6.45 [−38.57, 51.47] (1 vs. 4); 20.81 [−19.98, 61.59] (1 vs. 5); −19.45 [−79.26, 40.36] (2 vs. 4); −31.81 [−90.50, 22.88] (2 vs. 5); −14.36 [−64.34, 35.63] (4 vs. 5). Absolute intakes represent intakes within the treatment arm. Between arm differences represent the difference between the treatment (T) and control (C) arm (T–C). Within arm differences represent the difference between end (E) and baseline (B) values within the treatment arm (E–B). * Statistically significant between subgroups (P<0.05).
(PDF)
Categorical a priori and post-hoc subgroup analyses for HOMA-IR. CHO = carbohydrate; N = number of subjects; MQS = Heyland Methodological Quality Score; SFA = saturated fatty acid. Point estimates for each subgroup level (diamonds) are the pooled effect estimates. The dashed line represents the pooled estimate for the overall (total) analysis. The residual I2 value indicates heterogeneity unexplained by the subgroup. Absolute intakes represent intakes within the treatment arm. Between arm differences represent the difference between the treatment (T) and control (C) arm (T–C). Within arm differences represent the difference between end (E) and baseline (B) values within the treatment arm (E–B). * Statistically significant between subgroups (P<0.05).
(PDF)
Search strategy. For all databases, the original search was 23 May 2012; updated searches were performed 14 May 2013 and 6 April 2014.
(DOCX)
Study Quality Assessment using the Heyland MQS*. HF = high fat diet; LF = low fat diet; MQS = Methodological Quality Score. * The Heyland MQS assigns a score of 0 or 1 or from 0 to 2 over 9 categories of quality related to study design, sampling procedures, and interventions for a total of 13 points. Trials that scored ≥8 were considered to be of higher quality [25]. † Randomization was scored 2 points for being randomized with the methods described, 1 point for being randomized without the methods described, or 0 points for being neither randomized nor having the methods described. Blinding was scored 1 point for being double-blind or 0 points for “other.” Analysis was scored 2 points for being intention-to-treat; all other types of analyses scored 0 points. ‡ Sample selection was scored 1 point for being consecutive eligible or 0 points for being preselected or indeterminate. Sample comparability was scored 1 point for being comparable or 0 points for not being comparable at baseline. Follow-up was scored 1 point for being 100% or 0 points for <100%. § Treatment protocol was scored 1 point for being reproducibly described or 0 points for being poorly described. Co-interventions were scored 2 points for being described and equal, 1 point for being described but unequal or indeterminate, or 0 points for not being described. Treatment crossovers (where participants were switched from the control treatment to the experimental treatment) were scored 2 points for being <10%, 1 point for being >10%, and 0 points for not being described. || Study quality for this study was not assessed since data for this study was limited (the study’s conferences abstract and correspondence with the authors were the only sources of available data).
(DOCX)
Continuous a priori and post-hoc subgroup analyses for HbA1c. BMI = body mass index; CHO = carbohydrate; E = energy; M = males; N = number of subjects; No. = number; SFA = saturated fatty acid. β is the slope derived from subgroup analyses on meta-regression analyses and represents the treatment effect of tree nuts for each subgroup. The residual I2 value indicates heterogeneity unexplained by the subgroup. Absolute intakes represent intakes within the treatment arm. Between arm differences represent the difference between the treatment (T) and control (C) arm (T–C). Within arm differences represent the difference between end (E) and baseline (B) values within the treatment arm (E–B). *Statistically significant between subgroups (P<0.05).
(DOCX)
Continuous a priori and post-hoc subgroup analyses for fasting glucose. BMI = body mass index; CHO = carbohydrate; E = energy; M = males; N = number of subjects; No. = number; SFA = saturated fatty acid. β is the slope derived from subgroup analyses on meta-regression analyses and represents the treatment effect of tree nuts for each subgroup. The residual I2 value indicates heterogeneity unexplained by the subgroup. Absolute intakes represent intakes within the treatment arm. Between arm differences represent the difference between the treatment (T) and control (C) arm (T–C). Within arm differences represent the difference between end (E) and baseline (B) values within the treatment arm (E–B). * Statistically significant between subgroups (P<0.05).
(DOCX)
Continuous a priori and post-hoc subgroup analyses for fasting insulin. BMI = body mass index; CHO = carbohydrate; E = energy; M = males; N = number of subjects; No. = number; SFA = saturated fatty acid. β is the slope derived from subgroup analyses on meta-regression analyses and represents the treatment effect of tree nuts for each subgroup. The residual I2 value indicates heterogeneity unexplained by the subgroup. Absolute intakes represent intakes within the treatment arm. Between arm differences represent the difference between the treatment (T) and control (C) arm (T–C). Within arm differences represent the difference between end (E) and baseline (B) values within the treatment arm (E–B). * Statistically significant between subgroups (P<0.05).
(DOCX)
Continuous a priori and post-hoc subgroup analyses for HOMA-IR. BMI = body mass index; CHO = carbohydrate; E = energy; N = number of subjects; No. = number; SFA = saturated fatty acid. β is the slope derived from subgroup analyses on meta-regression analyses and represents the treatment effect of tree nuts for each subgroup. The residual I2 value indicates heterogeneity unexplained by the subgroup. Absolute intakes represent intakes within the treatment arm. Between arm differences represent the difference between the treatment (T) and control (C) arm (T–C). Within arm differences represent the difference between end (E) and baseline(B) values within the treatment arm (E–B). * Statistically significant between subgroups (P<0.05).
(DOCX)
CONSORT checklist.
(DOC)
Trial protocol.
(PDF)