Abstract
Flavin-containing monooxygenase (FMO) oxygenates drugs/xenobiotics containing a soft nucleophile through a C4a hydroperoxy-FAD intermediate. Human FMOs 1, 2 and 3, expressed in Sf9 insect microsomes, released 30–50% of O2 consumed as H2O2 upon addition of NADPH. Addition of substrate had little effect on H2O2 production. Two common FMO2 (the major isoform in the lung) genetic polymorphisms, S195L and N413K, were examined for generation of H2O2. FMO2 S195L exhibited higher “leakage”, producing much greater amounts of H2O2, than ancestral FMO2 (FMO2.1) or the N413K variant. S195L was distinct in that H2O2 generation was much higher in the absence of substrate. Addition of superoxide dismutase did not impact H2O2 release. Catalase did not reduce levels of H2O2 with either FMO2.1 or FMO3 but inhibited H2O2 generated by FMO2 allelic variants N413K and S195L. These data are consistent with FMO molecular models. S195L resides in the GxGxSG/A NADP+ binding motif, in which serine is highly conserved (76/89 known FMOs). We hypothesize that FMO, especially allelic variants such as FMO2 S195L, may enhance the toxicity of xenobiotics such as thioureas/thiocarbamides both by generation of sulfenic and sulfinic acid metabolites and enhanced release of reactive oxygen species (ROS) in the form of H2O2.
Keywords: flavin-containing monooxygenase, hydrogen peroxide, pulmonary FMO2, oxidative stress, genetic polymorphism
1. Introduction
Mammalian microsomal flavin-containing monooxygenase (FMO) is a superfamily of xenobiotic metabolizing enzymes with a single member in each family. Humans express five forms of FMO in a developmental- and tissue-specific manner (reviewed in [1,2]). FMO1 is the major form in fetal liver as well as adult kidney and intestine [3,4]. FMO2 is found primarily in the lung of most mammals including primates but humans have an interesting genetic polymorphism in expression such that all Caucasians and Asians sequenced to date carry a C to T transition mutation (FMO2*2) which results in a premature stop codon (TAG) and synthesis of a truncated and inactive enzyme (FMO2.2) [5]. Individuals of African (up to 49%) or Hispanic (2–7%) descent possess at least one allele (FMO2*1) of the ancestral gene coding for full length active enzyme (FMO2.1) [6–10]. FMO3 is present in adult liver; parturition provides some unknown signal that suppresses FMO1 expression and switches on the synthesis of FMO3 [11]. FMO3 is the enzyme responsible for metabolism of trimethylamine to trimethylamine N-oxide [12]. The genetic disease trimethylaminuria (TMAU, colloquially termed “fish odor syndrome”) is due to a number of known mutations in the FMO3 gene [13–16]. An individual suffering from TMAU excretes large amounts of trimethylamine in urine and sweat resulting in an unpleasant body odor. TMAU patients also exhibit socio-psychological problems as well as altered metabolism of drugs [17–19]. The developmental expression of FMO3 following birth is sometimes delayed causing what is known as “transient TMAU” in infants [11].
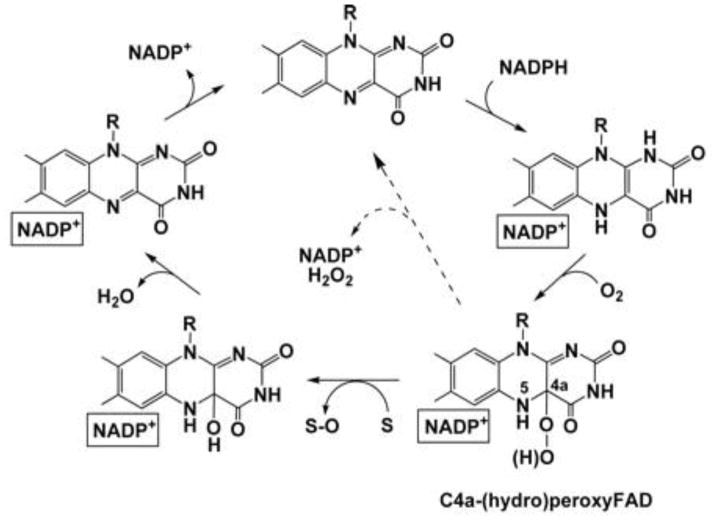
FMO utilizes NADPH in the presence of O2 to form a stable 4a-hydroperoxy-FAD (FAD-OOH) intermediate [20,21]. Any xenobiotic containing a soft-nucleophile that can gain access to this site reacts with the peroxyflavin (Figure 1). One atom of O2 is incorporated into the substrate whereas the other atom forms H2O (reviewed in 2,22,23]. Previous studies by other laboratories have observed “uncoupling” of this enzyme to yield either superoxide anion radical [24] or H2O2 [25]. Release of superoxide anion radical with purified pig liver FMO1 was a relatively minor percent of NADPH consumption [24]. Formation of H2O2 was observed with pulmonary FMO2 and reached 41% of NADPH oxidized by rabbit FMO2 upon addition of primary amines; but was not observed with hepatic FMO1 sources [25].
Figure 1. Structure of FAD during the Catalytic Cycle of Flavin-Containing Monooxygenases.
Mammalian FMO and prokaryotic analogs have a catalytic cycle which first involves a rapid reduction by NADPH followed by binding of molecular oxygen and formation of the stable C4a-hydroperoxyflavin intermediate. This activated FAD was originally likened to a “cocked gun” by the late Dr. Henry Kamin, capable of reacting with any soft nucleophile (S) gaining proximity to this site. A nucleophilic attack by the substrate yielded an oxygenated product (S-O). The second atom of oxygen is then released as H2O and the final step in the cycle is the release of NADP+. The breakdown of the hydroxy-FAD pseudo base and release of NADP+ are the slowest steps in the catalytic cycle and determine FMO turnover rate. Uncoupling (dashed line) with release of H2O2 is promoted if NADP+ binding is compromised. This figure was taken from Alfieri et al., [37] with permission.
Alfieri et al., [34] “Revealing the Moonlighting Role of NADP in the Structure of a Flavin-Containing Monooxygenase”, Proceedings of the National Academy of Sciences, U.S.A. 105(18):6572-77. Reprinted with permission.
The relatively low Kms for both NADPH and O2 and the stability of the FAD-OOH raises an interesting question. If this is the major state of the enzyme present in the cell, in the absence of substrate, does the FAD-OOH release reactive oxygen species (ROS)? We, and others, have documented that there are some endogenous substrates for FMO (e.g., TMA, cysteamine, lipoic acid and methionine, reviewed in [2]) but characterization shows the Kms (with the exception of TMA) tend to be high compared to concentrations in the cell. Our laboratory has expressed in Sf9 insect cells (baculovirus) the three major FMOs involved in drug metabolism, FMO1, FMO2.1 and FMO3 in addition to two common allelic variants of human FMO2 [26]. In order to assess the degree of ROS production by mammalian FMOs, the impact of xenobiotic substrates and potential relative differences among human isoforms, as well as some known human FMO2 allelic variants, we utilized a dual electrode system to simultaneously monitor O2 consumption and H2O2 production with FMOs expressed in Sf9 insect microsomes. In addition, H2O2 production was assessed with Amplex Red [27] and the impact of substrate, catalase and superoxide dismutase examined. As with any electron transport system, efficiency is rarely 100%. Within the cell, the mitochondrial electron transport chain is responsible for much of this ROS leakage but monooxygenases, such as cytochromes P450 (CYPs) [27] and now FMOs are known to contribute to the total ROS load within the cell. In addition to the potential toxicity from oxidative stress, the fact that H2O2 is becoming increasingly recognized as a signaling molecule, makes understanding of the cellular location and amplitude of H2O2 production important [28].
2. Materials and Methods
2.1. Chemicals
Ethylene thiourea (ETU) was from Lancaster Synthesis (Pelham, NJ). Ethionamide, methyl-p-tolyl sulfide, NADPH, NADP+, glucose-6-phosphate dehydrogenase, glucose-6-phosphate, potassium phosphate, sodium phosphate, glycerol, EDTA, cytochrome c, superoxide dismutase, and catalase were purchased from Sigma Chemical (St. Louis, MO). Protease Inhibitor Cocktail Set III was from Calbiochem (Billerica, MA). Coomassie Plus reagent was purchased from Thermo Fisher Scientific Corp. (Rockford, IL). The Amplex Red assay kit and all reagents used in expression of FMO proteins were obtained from Invitrogen Life Technologies Corp. (Grand Island, NY). Rat CYP3A2 supersomes were purchased from BD Biosciences (Franklin Lakes, NJ).
2.2. Expression of human FMO1, ancestral FMO2.1, FMO3 and FMO2 allelic variants (S195L and N413K)
A baculovirus system was utilized to express hFMO1, ancestral hFMO2.1, hFMO3 and the S195L and N413K allelic variants of hFMO2. The generation of these expressed enzymes has been described previously [26,29]. The Sf9 insect cells were harvested 96 hours post infection and microsomes isolated by ultra-centrifugation [30]. Microsomal protein was resuspended in buffer (10 mM KPO4, pH 7.25, 20% glycerol, 1 mM EDTA, 1 μl/ml protease inhibitor cocktail). Protein concentration was quantitated by the Bradford [31] based Coomassie Plus Reagent. Flavin content was determined by an HPLC assay of FAD [32]. The specific content of the expressed flavoproteins varied from 0.99 to 1.58 nmol (average=1.18 ± 0.24) FAD/mg microsomal protein, corresponding to 0.91–1.5 nmol FMO/mg microsomal protein (corrected by subtraction of constitutive FAD specific content in Sf9 microsmes).
2.3. H2O2 production and O2 consumption
An Apollo 4000 Free Radical Analyzer (World Precision Instruments, Sarasota, FL) was equipped with an ISO-HPO-2 hydrogen peroxide electrode (World Precision Instruments) and an MI-730 oxygen microelectrode (Microelectrodes, Inc., Bedford, NH) to simultaneously measure H2O2 production and O2 consumption in a closed 3 ml incubation chamber connected to a circulating water bath, to maintain 37°C. The H2O2 electrode was calibrated using fresh H2O2 standard solutions ranging from 0–32 μM while the O2 electrode was calibrated by saturating buffer with N2 gas (0% O2), air (21% O2), and O2 gas (100%) all at 37°C. The formula for conversion of %O2 to molarity was S = (a/22.414)(760-p/760)(r%/100) where S = solubility of gas in molar concentration, a denotes the absorption coefficient of gas at 37°C, p is the vapor pressure of water at 37°C, and r% represents analyzer output in percent O2. Calibrations were done immediately before and after incubations to verify electrode stability. Expressed FMO protein (100 pmol FAD) was added to 100 mM PBS, pH 7.4, 1 mM EDTA, 1 mM NADPH or a regenerating system of 1 mM NADP+, 10 U glucose-6-phosphate dehydrogenase, 2.5 mM glucose-6-phosphate) and incubated 3–5 minutes open to the atmosphere at 37°C in a 3 ml sample port connected to a recirculating water bath (World Precision Instruments). The sample port was sealed and assays were performed in the presence of known FMO substrates (50 or 100 μM ETU, 50 μM trifluoperazine, 100 μM methyl-p-tolyl sulfide or 75 μM ethionamide) or in the absence of substrate, during which time O2 consumption and H2O2 were measured for up to 60 min. Assays were performed at pH 7.4 to demonstrate biological relevance (mammalian FMOs typically have pH optima from 8.5–9.5). We have expressed the truncated FMO2 Q472X (FMO 2*2A) protein in Sf9 insect cells. FAD concentration in these microsomes average 0.14 ± 0.06 nmol/mg protein and is similar to FAD in the Sf9 expressed FMO2 d337G variant which also lacks FAD binding resulting in an estimated 0.15 ± 0.05 nmol FAD/mg protein. Thus we assumed the Q472X variant would not produce appreciable amounts of H2O2 when incubated with NADPH and/or substrates and did not include it in this study. In order to determine background H2O2 production in Sf9 microsomes, we measured FAD in control Sf9 supersomes from BD Biosciences (San Jose, CA). FAD concentrations in this product measured 0.30 nmol/mg protein. Using the control with the higher FAD concentration, control Sf9 microsomes were compared to expressed FMOs and CYP3A2 supersomes from BD Biosciences (San Jose, CA).
The Amplex Red assay [33] was used to validate H2O2 production in the microsomal incubations. Incubations contained the same reagents as previously described but were done in tissue culture tubes set in a 37°C shaking water bath protected from light for 30 minutes. Samples and standards were analyzed in triplicate in 96 well plates (50 μl/well). A working solution of 100 μM Amplex Red reagent (0.1 mM N-acetyl-3,7-dihydroxyphenoxazine, 0.2 U/ml horseradish peroxidase, 50 mM sodium phosphate pH 7.4) was added to each well, incubated 20 minutes at room temperature, and the fluorescence measured with a Spectra Max Gemini XS plate reader (Molecular Devices Corp., Sunnyvale, CA) set at 530 nm excitation, 590 nm emission, 590 cut-off. Incubations were also performed with addition of catalase (1175 U/ml incubation), superoxide dismutase (0.2 μM) or cytochrome c (100 μM). All data in this study are representative of single assays therefore statistics were not carried out.
3. Results
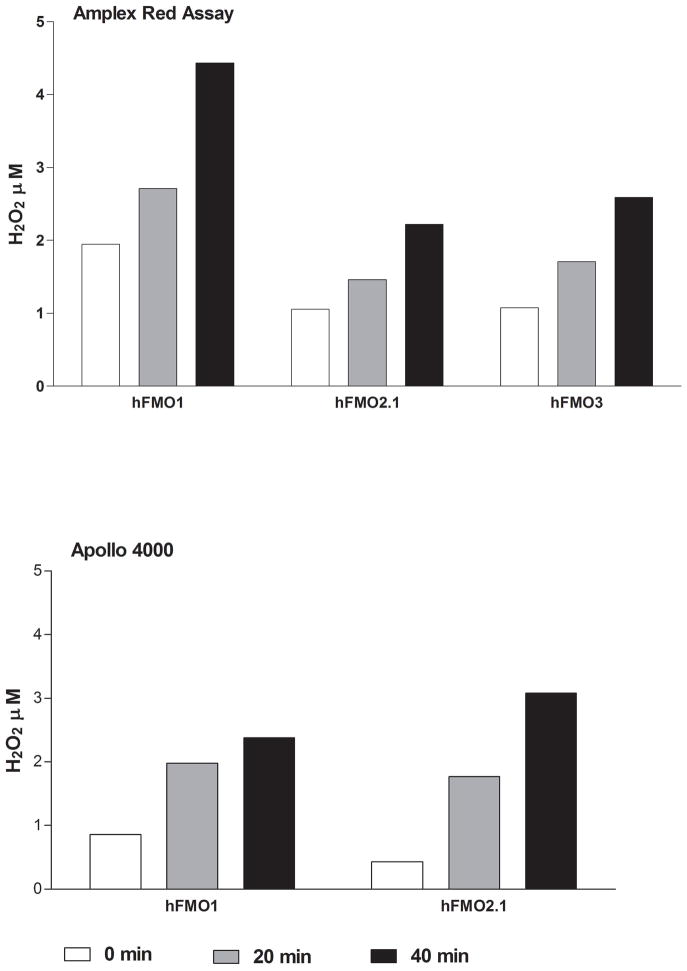
Utilization of the Apollo 4000 Radical Ion Analyzer allowed for the simultaneous determination of O2 consumption and H2O2 generation by employing dual electrodes. There was little or no O2 consumption in the absence of enzyme and no H2O2 above background (data not shown) prior to the addition of NADPH. Upon addition of NADPH, both O2 consumption and H2O2 production were observed over time. We measured and compared the H2O2 “leakage” in microsomes containing expressed human FMO1, ancestral FMO2.1 or FMO3. In the presence of ethylene thiourea (ETU, a substrate for all three FMOs) FMO1 produced the highest amounts of H2O2 whereas FMO2.1 and FMO3 were roughly equivalent (Figure 2A). With FMO2.1 the rate of H2O2 production and O2 consumption was markedly lower in the absence of substrate. This was also the case for FMO1 (data not shown). Upon addition of substrate, FMO1 produced H2O2 at a fairly constant rate (40–50% of O2 consumption, Figure 2B) over the 60 minute time course of the incubation. Following an initial spike upon addition of ETU, the percentage of O2 consumed appearing as H2O2 was relatively constant (about 30%) for FMO2.1 and FMO3 with time (Figure 2B). The time-dependent generation of H2O2 by human FMOs determined with the Apollo instrument was compared to the assay employing Amplex Red. The results are in general agreement and the generation of H2O2 is 0.5–2.5 nmol/min/nmol FMO at pH 7.4 (Figure 3).
Figure 2.

Figure 2A. H2O2 generation (closed symbols) and O2 uptake (open symbols) monitored with an Apollo 4000 Radical Ion Analyzer in Sf9 microsomes from baculovirus expressed hFMO1 (diamonds), hFMO2.1(triangles), hFMO3 (squares) with ETU substrate (50 μM), and hFMO2.1 without substrate (circles) at pH 7.4, 37°C. Substrate was added after a 5 minute pre-incubation with 1 mM NADPH.
Figure 2B. H2O2 yield as a percent of O2 consumption by human FMO1 (diamonds), FMO2.1 (triangles) and FMO3 (squares) over an incubation time of 60 minutes.
Figure 3.
A comparison of the time-dependent production of H2O2 using two methods, Amplex Red assay (top) and the Apollo dual-electrode instrument (bottom). The incubations were performed as described in Materials and Methods at pH 7.4, 37°C in the absence of substrate.
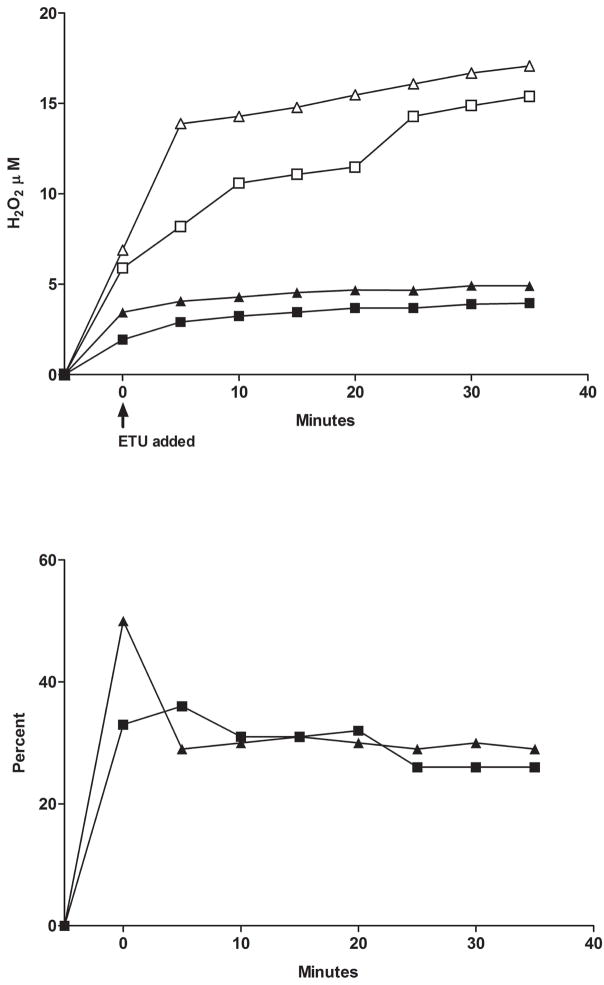
We further examined the impact of substrate on ancestral FMO2.1 and a commonly expressed variant (FMO2 N413K, rs2020865). Previous studies with expressed FMO2 N413K had shown similar physiochemical responses compared to the ancestral FMO2.1 including pH optima, thermolability and response to detergent and MgCl2 [26]. One notable distinction was that N413K exhibited higher catalytic activity toward methyl-p-tolyl sulfide (MTS) [26]. Comparison of O2 consumption and H2O2 generation in FMO2.1and N413K variant (Figure 4 top) with the Apollo electrodes demonstrated little difference in the percentage of O2 consumed appearing as H2O2 during oxygenation of ETU (Figure 4 bottom). Similar results were seen with a tertiary amine substrate, trifluoperazine (data not shown).
Figure 4.
Top panel: O2 consumption with time by FMO2.1, (open squares) and the N413K allelic variant (open triangles) and H2O2 production (closed symbols). ETU (50 μM) was added following a 5 minute pre-incubation with 1 mM NADPH and enzyme as described in Materials and Methods. Bottom panel: the percent yield of H2O2 as a function of O2 consumption over time is depicted for FMO2.1 (closed squares) and for the N413K allelic variant (closed triangles).
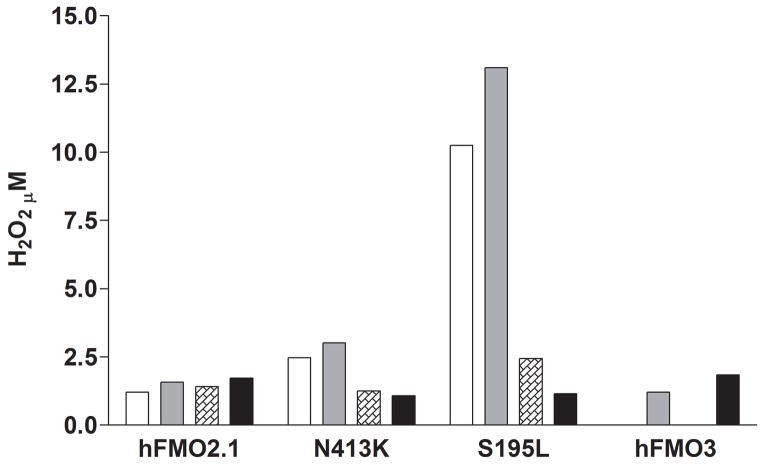
Amplex Red was used to compare H2O2 generation in the two FMO2 variants versus FMOs 1, 2.1, and 3. The anti-tuberculosis prodrug ethionamide was used as a substrate [29,34,35] and the reactions were performed with and without the addition of catalase (FMO3 was not measured without substrate). Somewhat surprisingly, the addition of catalase to incubations containing ancestral FMO2.1 or FMO3 had no impact on H2O2 detection by Amplex Red in the presence or absence of substrate (Figure 5). Catalase did markedly inhibit H2O2 production with both allelic variants (Figure 5). The results with FMO2 S195L are striking in that H2O2 production was considerably higher (up to 50 nmol/min/nmol FMO2 S195L) than with FMO2.1. In this study S-oxygenation at pH 7.4 is markedly slower with S195L than the ancestral enzyme, however our previous study demonstrated S-oxygenation rates by this variant were markedly pH- and substrate-dependent [26]. As with FMO2.1, the addition of catalase to incubations containing FMO3 did not reduce the yield of H2O2 (Figure 5).
Figure 5.
H2O2 production by human FMO2.1, the N413K and S195L FMO2 allelic variants and FMO3. Enzymes were incubated for 30 minutes at pH 7.4, 37°C, in the absence (open bars) or presence (solid gray bars) of 75 μM ethionamide. Catalase was added to enzymes in the absence (hatched bars) or presence (solid black bars) of ethionamide. The yield of H2O2 was determined by the Amplex Red assay. Note: hFMO3 was measured only in the presence of substrate ± catalase.
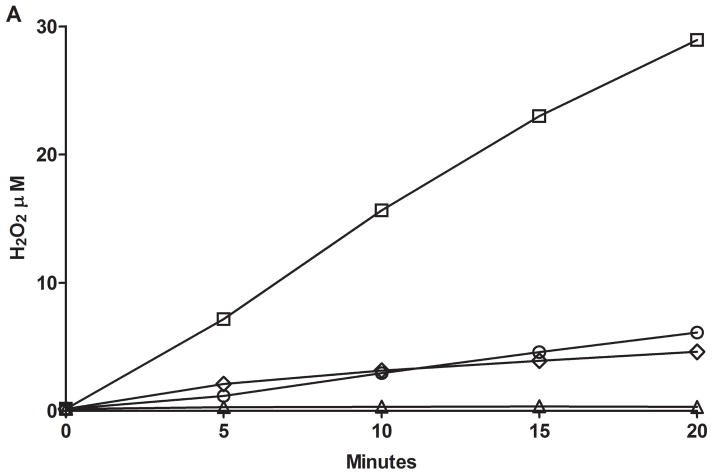
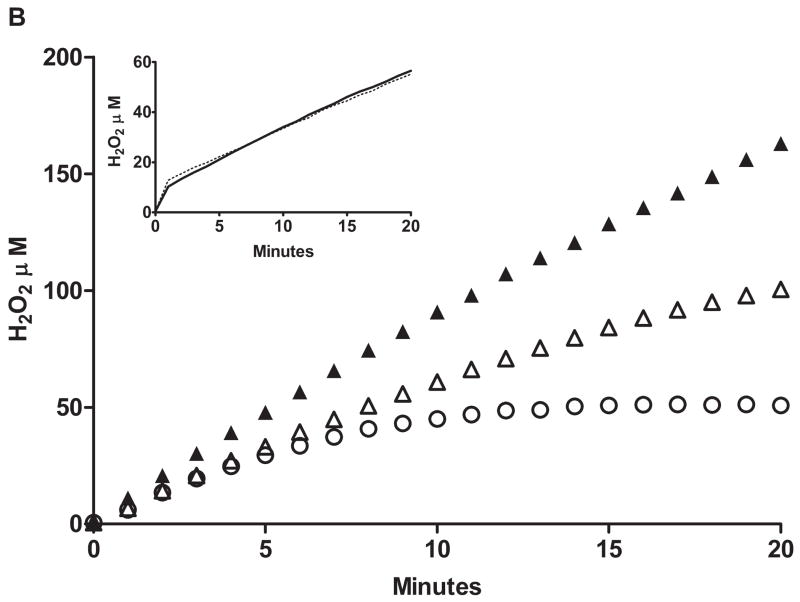
The FMO2 S195L variant also appeared to differ from the N413K variant and the ancestral enzyme in that, with ETU or MTS as substrates, H2O2 production was markedly reduced compared to the absence of substrate (Figure 6A). Note the marked difference in the rate of H2O2 production in the absence of substrate with S195L compared to FMO2.1 (wild type). The “leakage” of H2O2 in the absence of substrate by S195L was enhanced in the presence of 0.2 μM SOD (Figure 6B). This stimulation was not seen in the presence of 50 μM ETU. In the presence of 1 mM glutathione, and in the absence of substrate, the rate of formation of H2O2 was markedly suppressed and did not continue to increase after 15 minutes of incubation (Figure 6B).
Figure 6.
A. The yield of H2O2 with FMO2 S195L over a 20 minute incubation (pH 7.4, 37°C) was determined with the Apollo 4000 H2O2 electrode in the absence (squares) or presence of 100 μM ETU (circles) or 100 μM MTS (diamonds). The results were compared to H2O2 production by ancestral FMO2.1 in the absence of substrate (triangles). The assay was performed with 0.1 mM NADP+ and an NADPH-generating system as described in Materials and Methods. B. The yield of H2O2 by the FMO2 S195L allelic variant measured with an Apollo electrode over a 20 minute incubation with 1 mM NADPH (pH 7.4, 37°C and no NADPH-generating system). The greatest rate of H2O2 production was seen in the absence of substrate and with 0.2 μM SOD (filled triangles) followed by conditions with no substrate or SOD (open triangles). The addition of 1 mM glutathione in the absence of substrate (circles) markedly reduced the yield of H2O2. The yield of H2O2 over time in the presence of 50 μM ETU (inset) was equivalent in the presence (dotted line) or absence (solid line) of SOD.
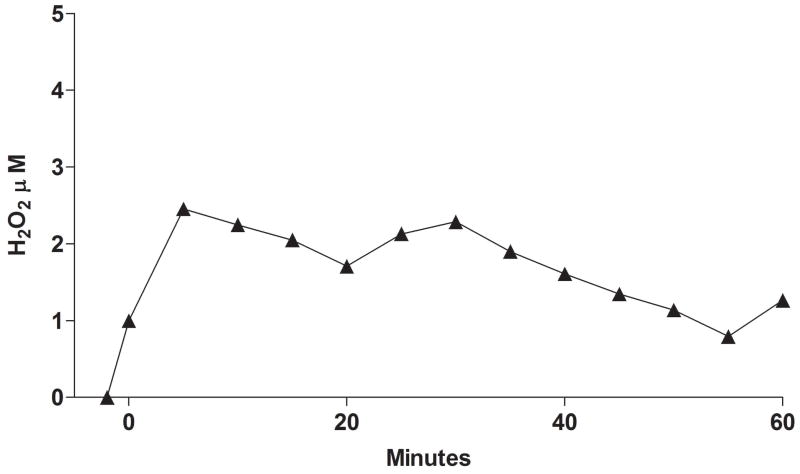
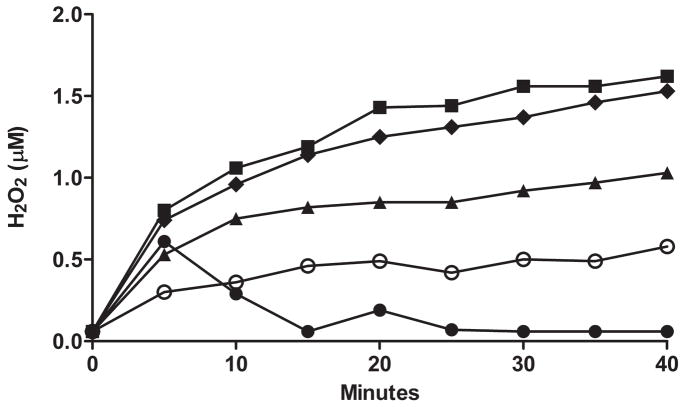
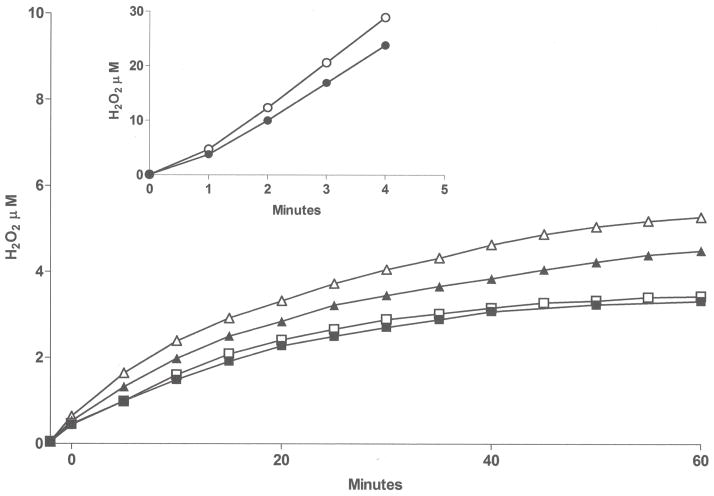
As a comparison to the other major electron transport monooxygenase system in the endoplasmic reticulum, cytochrome P450 (CYP), we incubated rat CYP3A2 with benzphetamine and saw little H2O2 production (Figure 7). Figure 8 compares the rate of H2O2 production (with no substrate) in Sf9 microsomes expressing rat CYP3A2, hFMO1, hFMO2.1 and hFMO3. Variability in expressed microsomes was checked by measuring H2O2 generated in two separate batches of FMO2.1, N413K, and S195L using the Apollo 4000 Radical Ion Analyzer (Figure 9).
Figure 7.
H2O2 production in rat CYP3A2 supersomes (0.1 nmol containing cDNA expressed rat NADPH CYP oxidoreductase (NOR) 2.8 μmol/(min × mg protein)) incubated for 60 min with benzphetamine (200 μM). Enzyme and NADPH (1 mM) were pre-incubated in 100 mM PBS, pH 7.4 at 37°C for 2 minutes, substrate added at T = 0.
Figure 8.
Baseline H2O2 generated with no substrate in control Sf9 microsomes (open circles) compared to CYP3A2 (closed circles), FMO2.1 (closed triangles), FMO1 (closed diamonds) and FMO3 (closed squares) Sf9 expressed microsomes.
Figure 9.
Comparison of H2O2 generated in two separate batches of Sf9 expressed microsomes using the Apollo 4000 Radical Ion Analyzer, FMO2.1 (squares) and N413K variant (triangles), incubated with ETU (50 μM) at pH 7.4, 37°C and S195L variant (circles) with no substrate at pH 7.4, 37°C (inset).
4. Discussion
The catalytic cycle of mammalian FMO is characterized by the formation, following reduction of FAD and reaction with O2, of a relatively stable C4a-hydroperoxide. In fact, this form of the enzyme is thought to predominant in the cell [36,37]. There is no substrate binding per se but rather a monooxygenase reaction occurs if a soft nucleophile (often a nitrogen- or sulfur-containing compound) gains sufficient proximity to this active site. Previous studies have documented that size and charge play a major role in such access and that some FMOs (e.g. FMO1) have a larger, wider substrate access channel than other FMOs (e.g. FMO2.1) [38,39].
Researchers studying the mammalian FMOs have long been interested in the potential for generation of reactive oxygen intermediates during the catalytic cycle. There are a number of classes of flavoproteins that are capable of forming the FAD peroxyflavin intermediate although it is only with the monooxygenases that the intermediate is long-lived enough to be observed by spectroscopy [40]. Early work with microsomal preparations indicated that the stoichiometry between NADPH oxidation, O2 consumption and product formation was near unity thus making it unlikely that there was a significant amount of “uncoupling” of the enzyme with production of H2O2 [41]. It was later determined using microsomes from various species that the lung FMO (FMO2), which is distinct in N-oxygenation of primary alkyl amines, forms H2O2 in significant amounts during metabolism of substrates such as n-octylamine (41% of NADPH oxidation) [25]. Rauckman et al. [24], had observed that porcine FMO1 formed a small amount of superoxide anion radical during oxidation of certain hydroxylamines.
The acquisition of human FMOs over-expressed by baculovirus in insect Sf9 microsomes allowed us to study, for the first time, the formation of H2O2 in the three major drug-metabolizing FMO families in humans (FMO1 in fetal liver, adult kidney and intestine; FMO2.1 in lung; FMO3 in adult liver) and the impact of substrates. In addition we were able to assess the impact of two common SNPs (the N413K and S195L allelic variants) in the human FMO2 gene. The use of the Apollo 4000 Radical Ion Analyzer allowed for the simultaneous measurement of O2 consumption and H2O2 production.
We had expected to observe higher rates of O2 consumption and H2O2 production in the absence of substrate. In the catalytic cycle of mammalian FMO (Figure 1), FAD is rapidly reduced by NADPH and the C4a hydroperoxide produced upon introduction of O2. This hydroperoxy-flavin intermediate is relatively stable and can be observed spectrally with the mammalian enzyme [21] and with prokaryotic flavin-containing monooxygenases such as Methylophaga sp. Strain SK1 (meFMO, [37]). If a soft-nucleophile comes within close enough proximity to this intermediate there is a nucleophilic attack and oxygenation (reviewed in [42–44]). One atom of the hydroperoxy-flavin is used in this oxygenation and the other comes off as H2O following the breakdown of the hydroxy-flavin pseudo base. The regeneration of oxidized FAD and release of NADP+ are the rate-limiting steps in the catalytic cycle (Figure 1). The rate of H2O2 generation (NADPH oxidase) with meFMO was estimated at 3.6 min−1 [37]. Our original hypothesis was that we would observe a slow rate of H2O2 uncoupling during the catalytic cycle and a more pronounced “leakage” in the absence of substrate. Instead we found that, for FMO1, FMO2 and FMO3, the yield of H2O2 was higher in the presence of substrate indicating a significant amount of uncoupling during FMO catalysis. The percentage of O2 consumed that appeared as H2O2 varied between 30–50% at a rate of about 0.5–2.5 nmol/min/nmol FMO. The data obtained with the ISO-HPO-2 H2O2 electrode and the Amplex Red assay were in good agreement.
There is an interesting genetic polymorphism affecting expression of FMO2 in humans. In most other mammals, including non-human primates, FMO2 is the major or only FMO expressed in lung (also found in appreciable amounts in nasal tissue, heart and brain) (reviewed in [2]). All Caucasians and Asians genotyped to date have a C to T transition mutation (rs6661174, FMO2*2) resulting in a truncated (Q472X) inactive enzyme (FMO2.2). Individuals of African descent (up to 49%) and Hispanics (2–7%) have at least one ancestral FMO2*1 allele coding for full-length active enzyme FMO2.1 [5,7–10]. Two other major FMO2 SNPs include N413K and S195L [26,45]. These allelic variants were also expressed with baculovirus and tested for “leakage” and substrate-dependent uncoupling of H2O2. Previous studies with expressed FMO2 N413K had shown similar physiochemical responses compared to the wild type FMO2 including pH optima, thermolability and response to detergent and MgCl2 [26]. One notable distinction was that N413K exhibited higher catalytic activity toward methyl-p-tolyl sulfide (MTS) [26]. In contrast, S195L exhibited markedly different properties compared to ancestral FMO2.1 including pH optima, thermo lability, sensitivity to detergent, and catalytic activity [26]. It was not surprising to find in this study S195L was also different, including a high rate of “leakage” of H2O2 in absence of substrate (an order of magnitude faster than FMO2.1). Serine at position 195 in FMOs is highly conserved (76/89, with 12 having the relatively conservative replacement of threonine [26,36]. The one notable exception is primate FMO1 which expresses a proline at position 195. Serine 195 is within the NADP+ binding motif (GxGxSG/A). Release of NADP+ is the rate-limiting step in the catalytic cycle and NADP+ is known to stabilize the enzyme. Analysis of the crystal structure of the prokaryotic meFMO suggests that NADP+ binding promotes stabilization of the peroxyflavin [37]. Leucine substitution is predicted to disrupt these interactions with NADP+ that, together with the loss of other critical interactions that serine has with key amino acid residues, would make C4a-hydroperoxy flavin prone to solvent attack and an increase in NADPH oxidase activity [26]. Thus disruption of NADP+ binding efficacy with replacement of a polar OH group with a hydrophobic side chain (leucine) may explain the high degree of H2O2 production seen with S195L. The FMO2 S195L (rs2020862) variant is found at a fairly high allelic frequency (30 to 55%) across a number of ethnic groups, but is only expected to be relevant among the subset of individuals with the ancestral FMO2*1 allele, or as pointed out previously [26], in individuals with the FMO2*2 allele on therapies employing stop codon read-through drugs like PTC124 (Atalauren, PTC Therapeutics, Plainfield, NJ). Phase 3 clinical trials with PTC124 are ongoing for both cystic fibrosis and Duchenne/Becker muscular dystrophy. These results could indicate that individuals expressing this SNP could have substantially higher formation of ROS in sensitive target tissues such as lung, heart and brain.
It has been estimated that uncoupling of the CYP monooxygenase electron transport chain (overexpressed CYP plus NADPH CYP oxidoreductase or NOR) produces approximately 12.7 nmol H2O2/min/nmol CYP [27]. Given the estimate of 0.5–2.5 nmol H2O2/min/nmol (pH 7.4, higher at the pH optima of 8.5–9) with FMO1, FMO2 and FMO3, the major drug metabolizing FMOs, this monooxygenase may be a secondary contributor to microsomal generation of ROS. However, given that we have demonstrated that a common allelic variant such as FMO2 S195L can generate H2O2 at rates of up to 80 nmol/min/nmol FMO (Figure 6B), the contribution of FMOs toward ROS generation cannot be discounted especially when one considers the fact that with the CYP monooxygenase system substrate binding is required for any electron transport (and thus ROS production) to occur whereas FMO does not require substrate to form the FAD hydroperoxide and generate H2O2. The overall contribution to the redox state of the cell is unknown; it is likely that, even though the mitochondrial electron transport chain is much more highly coupled (in the absence of mitochondrial poisons, aging or disease) these organelles probably represent the greatest source of ROS production in the average cell. However, ROS generation in the endoplasmic reticulum may result in toxicities not observed from mitochondrial ROS production. Finally, we would like to point out that, to our knowledge, this is the first study demonstrating a marked difference in ROS leakage from a common allelic variant of a mammalian monooxygenase.
Acknowledgments
The authors would like to acknowledge support from the Public Health Service through NIH grant HL038650.
Footnotes
Publisher's Disclaimer: This is a PDF file of an unedited manuscript that has been accepted for publication. As a service to our customers we are providing this early version of the manuscript. The manuscript will undergo copyediting, typesetting, and review of the resulting proof before it is published in its final citable form. Please note that during the production process errors may be discovered which could affect the content, and all legal disclaimers that apply to the journal pertain.
Contributor Information
Lisbeth K. Siddens, Email: siddensb@onid.oregonstate.edu.
Sharon K. Krueger, Email: sharon.krueger@oregonstate.edu.
Marilyn C. Henderson, Email: marilyn.henderson@comcast.net.
References
- 1.Cashman JR, Zhang J. Human flavin-containing monooxygenases. Annual Review of Pharmacology and Toxicology. 2006;46:65–100. doi: 10.1146/annurev.pharmtox.46.120604.141043. [DOI] [PubMed] [Google Scholar]
- 2.Krueger SK, Williams DE. Mammalian flavin-containing monooxygenases: structure/function, genetic polymorphisms and role in drug metabolism. Pharmacology and Therapeutics. 2005;106:357–387. doi: 10.1016/j.pharmthera.2005.01.001. [DOI] [PMC free article] [PubMed] [Google Scholar]
- 3.Yeung CK, Lang DH, Thummel KE, Rettie AE. Immunoquantitation of FMO1 in human liver, kidney, and intestine. Drug Metabolism and Disposition. 2000;28:1107–1111. [PubMed] [Google Scholar]
- 4.Zhang J, Cashman JR. Quantitative analysis of FMO gene mRNA levels in human tissues. Drug Metabolism and Disposition. 2006;34:19–26. doi: 10.1124/dmd.105.006171. [DOI] [PubMed] [Google Scholar]
- 5.Dolphin CT, Beckett DJ, Janmohamed A, Cullingford TE, Smith RL, Shephard EA, Phillips IR. The flavin-containing monooxygenase 2 gene (FMO2) of humans, but not other primates, encodes a truncated nonfunctional protein. The Journal of Biological Chemistry. 1998;273:30599–30607. doi: 10.1074/jbc.273.46.30599. [DOI] [PubMed] [Google Scholar]
- 6.Krueger SK, Martin SR, Yueh MF, Pereira CB, Williams DE. Identification of active flavin-containing monooxygenase isoform 2 in human lung and characterization of expressed protein. Drug Metabolism and Disposition. 2002;30:34–41. doi: 10.1124/dmd.30.1.34. [DOI] [PubMed] [Google Scholar]
- 7.Krueger SK, Siddens LK, Martin SR, Yu Z, Pereira CB, Cabacungan ET, Hines RN, Ardlie KG, Raucy JL, Williams DE. Differences in FMO2*1 allelic frequency between Hispanics of Puerto Rican and Mexican descent. Drug Metabolism and Disposition. 2004;32:1337–1340. doi: 10.1124/dmd.104.001099. [DOI] [PubMed] [Google Scholar]
- 8.Krueger SK, Siddens LK, Henderson MC, Andreasen EA, Tanguay RL, Pereira CB, Cabacungan ET, Hines RN, Ardie KG, Williams DE. Haplotype and functional analysis of four flavin-containing monooxygenase isoform 2 (FMO2) polymorphisms in Hispanics. Pharmacogenetics and Genomics. 2005;15:245–256. doi: 10.1097/01213011-200504000-00008. [DOI] [PMC free article] [PubMed] [Google Scholar]
- 9.Veeramah KR, Thomas MG, Weale ME, Zeitlyn D, Tarekegn A, Bekele E, Mendell NR, Shephard EA, Bradman N, Phillips IR. The potentially deleterious functional variant flavin-containing monooxygenase 2*1 is at high frequency throughout sub-Saharan Africa. Pharmacogenetics and Genomics. 2008;18:877–886. doi: 10.1097/FPC.0b013e3283097311. [DOI] [PMC free article] [PubMed] [Google Scholar]
- 10.Whetstine JR, Yueh MF, Hopp KA, McCarver DG, Williams DE, Park CS, Kang JH, Cha YN, Dolphin CT, Shepard EA, Phillips IR, Hines RN. Ethnic differences in human flavin-containing monooxygenase 2 (FMO2) polymorphisms: detection of expressed protein in African-Americans. Toxicology and Applied Pharmacology. 2000;168:216–224. doi: 10.1006/taap.2000.9050. [DOI] [PubMed] [Google Scholar]
- 11.Koukouritaki SB, Simpson P, Yeung CK, Rettie AE, Hines RN. Human hepatic flavin-containing monooxygenase 1 (FMO1) and 3 (FMO3) developmental expression. Pediatric Research. 2002;50:1–7. doi: 10.1203/00006450-200202000-00018. [DOI] [PubMed] [Google Scholar]
- 12.Lang DH, Yeung CK, Peter RM, Ibarra C, Gasser R, Itagaki K, Philpot RM, Rettie AE. Isoform specificity of trimethylamine N-oxygenation by human flavin-containing monooxygenase (FMO) and P450 enzymes. Biochemical Pharmacology. 1998;56:1005–1012. doi: 10.1016/s0006-2952(98)00218-4. [DOI] [PubMed] [Google Scholar]
- 13.Hernandez D, Addou S, Lee D, Orengo C, Shephard EA, Phillips IR. Trimethylaminuria and a human FMO3 mutation database. Human Mutation. 2003;22:209–213. doi: 10.1002/humu.10252. [DOI] [PubMed] [Google Scholar]
- 14.Treacy EP, Akerman BR, Chow LML, Youil R, Bibeau C, Lin J, Bruce AG, Knight M, Danks DM, Cashman JR, Forrest SM. Mutations of the flavin-containing monooxygenase gene (FMO3) cause trimethylaminuria, a defect in detoxication. Human Molecular Genetics. 1998;7:839–845. doi: 10.1093/hmg/7.5.839. [DOI] [PubMed] [Google Scholar]
- 15.Zhang J, Tran Q, Lattard V, Cashman JR. Deleterious mutations in the flavin-containing monooxygenase 3 (FMO3) gene causing trimethylaminuria. Pharmacogenetics. 2003;13:495–500. doi: 10.1097/00008571-200308000-00007. [DOI] [PubMed] [Google Scholar]
- 16.Dolphin CT, Janmohamed A, Smith RL, Shephard EA, Phillips IR. Missense mutation in flavin-containing mono-oxygenase 3 gene, FMO3, underlies fisk-odour syndrome. Nature Genetics. 1997;17:491–494. doi: 10.1038/ng1297-491. [DOI] [PubMed] [Google Scholar]
- 17.Hisamuddin IM, Yang VW. Genetic polymorphisms of human flavin-containing monooxygenase 3: implications for drug metabolism and clinical perspectives. Pharmacogenomics. 2007;8:635–643. doi: 10.2217/14622416.8.6.635. [DOI] [PMC free article] [PubMed] [Google Scholar]
- 18.Yamazaki H, Shimizu M. Survey of variants of human flavin-containing monooxygenase 3 (FMO3) and their drug oxidation activities. Biochemical Pharmacology. 2013;85:1588–1593. doi: 10.1016/j.bcp.2013.03.020. [DOI] [PubMed] [Google Scholar]
- 19.Mayatepek E, Flock B, Zschocke J. Benzydamine metabolism in vivo is impaired in patients with deficiency of flavin-monooxygenase 3. Pharmacogenetics. 2004;14:775–777. doi: 10.1097/00008571-200411000-00009. [DOI] [PubMed] [Google Scholar]
- 20.Jones KC, Ballou DP. Reactions of the 4a-hydroperoxide of liver microsomal flavin-containing monooxygenase with nucleophilic and electrophilic substrates. The Journal of Biological Chemistry. 1986;261:2553–2559. [PubMed] [Google Scholar]
- 21.Poulsen LL, Ziegler DM. Multisubstrate flavin-containing monooxygenase: application of mechanism to specificity. Chemical-Biological Interactions. 1995;96:57–73. doi: 10.1016/0009-2797(94)03583-t. [DOI] [PubMed] [Google Scholar]
- 22.Cashman JR. Structural and catalytic properties of the mammalian flavin-containing monooxygenase. Chemical Research in Toxicology. 1995;8:165–181. doi: 10.1021/tx00044a001. [DOI] [PubMed] [Google Scholar]
- 23.Zielger DM. An overview of the mechanism, substrate specificities and structure of FMOs. Drug Metabolism Reviews. 2002;34:503–511. doi: 10.1081/dmr-120005650. [DOI] [PubMed] [Google Scholar]
- 24.Rauckman EJ, Rosen GM, Kitchell BB. Superoxide radical as an intermediate in the oxidation of hydroxylamines by mixed function amine oxidase. Molecular Pharmacology. 1979;15:131–137. [PubMed] [Google Scholar]
- 25.Tynes RE, Sabourin PJ, Hodgson E, Philpot RM. Formation of hydrogen peroxide and N-hydroxylated amines catalyzed by pulmonary flavin-containing monooxygenase in the presence of primary alkylamines. Archives of Biochemistry and Biophysics. 1986;251:654–664. doi: 10.1016/0003-9861(86)90375-9. [DOI] [PubMed] [Google Scholar]
- 26.Krueger SK, Henderson MC, Siddens LK, VanDyke JE, Benninghoff AD, Karplus PA, Furnes B, Schlenk D, Williams DE. Characterization of sulfoxygenation and structural implications of human flavin-containing monooxygenase isoform 2 (FMO2.1) variants S195L and N413K. Drug Metabolism and Disposition. 2009;37:1785–1791. doi: 10.1124/dmd.109.027201. [DOI] [PMC free article] [PubMed] [Google Scholar]
- 27.Mishin V, Gray JP, Heck DE, Laskin DL, Laskin JD. Application of the Amplex red/horseradish peroxidase assay to measure hydrogen peroxide generation by recombinant microsomal enzymes. Free Radicals in Biology and Medicine. 2010;48:1485–1491. doi: 10.1016/j.freeradbiomed.2010.02.030. [DOI] [PMC free article] [PubMed] [Google Scholar]
- 28.Bienert GP, Schjoerring JK, Jahn TP. Membrane transport of hydrogen peroxide. Biochimistry Biophysica Acta. 2006;1758:994–1003. doi: 10.1016/j.bbamem.2006.02.015. [DOI] [PubMed] [Google Scholar]
- 29.Henderson MC, Siddens LS, Morré JT, Krueger SK, Williams DE. Metabolism of the anti-tuberculosis drug ethionamide by mouse and human FMO1, FMO2 and FMO3 and mouse and human lung microsomes. Toxicology and Applied Pharmacology. 2008;233:420–427. doi: 10.1016/j.taap.2008.09.017. [DOI] [PMC free article] [PubMed] [Google Scholar]
- 30.Guengerich FP. Analysis and characterization of enzymes. In: Hayes AW, editor. Principles and Methods of Toxicology. Raven Press; New York: 1989. pp. 777–814. [Google Scholar]
- 31.Bradford MM. A rapid and sensitive method for the quantitation of microgram quantities of protein utilizing the principle of protein-dye binding. Analytical Biochemistry. 1976;72:248–254. doi: 10.1006/abio.1976.9999. [DOI] [PubMed] [Google Scholar]
- 32.Henderson MC, Krueger SK, Stevens JF, Williams DE. Flavin-containing monooxygenase form 2 S-oxygenation. Sulfenic acid formation from thioureas and oxidation of glutathione. Chemical Research in Toxicology. 2004;17:633–640. doi: 10.1021/tx034253s. [DOI] [PubMed] [Google Scholar]
- 33.Zhou M, Diwu Z, Panchuk-Voloshina N, Haugland RP. A stable nonfluorescent derivative of resorufin for the fluorometric determination of trace hydrogen peroxide: applications in detecting the activity of phagocyte NADPH oxidase and other oxidases. Analytical Biochemistry. 1997;253:162–168. doi: 10.1006/abio.1997.2391. [DOI] [PubMed] [Google Scholar]
- 34.Francois AA, Nishida CR, Ortiz de Montellano PR, Phillips IR, Shephard EA. Human flavin-containing monooxygenase 2.1 catalyzes oxygenation of the antitubercular drugs thiacetazone and ethionamide. Drug Metabolism and Disposition. 2009;37:178–186. doi: 10.1124/dmd.108.024158. [DOI] [PMC free article] [PubMed] [Google Scholar]
- 35.Nishida CR, Ortiz de Montellano PR. Bioactivation of antituberculosis thioamide and thiourea prodrugs by bacterial and mammalian flavin monooxygenases. Chemical-Biological Interactions. 2011;192:21–25. doi: 10.1016/j.cbi.2010.09.015. [DOI] [PMC free article] [PubMed] [Google Scholar]
- 36.Eswaramoorthy S, Bonanno JB, Burley SK, Swaminathan S. Mechanism of action of a flavin-containing monooxygenase. Proceedings of the National Academy of Sciences (USA) 2006;103:9832–9837. doi: 10.1073/pnas.0602398103. [DOI] [PMC free article] [PubMed] [Google Scholar]
- 37.Alfieri A, Malito E, Orru R, Fraaije MW, Mattevi A. Revealing the moonlighting role of NADP in the structure of a flavin-containing monooxygenase. Proceeding of the National Academy of Sciences (USA) 2008;105:6572–6577. doi: 10.1073/pnas.0800859105. [DOI] [PMC free article] [PubMed] [Google Scholar]
- 38.Kim YM, Ziegler DM. Size limits of thiocarbamides accepted as substrates by human flavin-containing monooxygenase 1. Drug Metabolism and Disposition. 2000;28:1003–1006. [PubMed] [Google Scholar]
- 39.Nagata T, Williams DE, Ziegler DM. Substrate specificities of rabbit lung and porcine liver flavin-containing monooxygenases: differences due to substrate size. Chemical Research in Toxicology. 1990;3:372–376. doi: 10.1021/tx00016a016. [DOI] [PubMed] [Google Scholar]
- 40.Massey V. Activation of molecular oxygen by flavins and flavoproteins. The Journal of Biological Chemistry. 1994;269:22459–22462. [PubMed] [Google Scholar]
- 41.Tynes RE, Hodgson E. Catalytic activity and substrate specificity of the flavin-containing monooxygenase in microsomal systems: characterization of the hepatic, pulmonary and renal enzymes of the mouse, rabbit and rat. Archives of Biochemistry and Biophysics. 1985;240:77–93. doi: 10.1016/0003-9861(85)90010-4. [DOI] [PubMed] [Google Scholar]
- 42.Ziegler DM. Microsomal flavin-containing monooxygenase: oxygenation of nucleophilic nitrogen and sulfur compounds. In: Jakoby WB, editor. Enzymatic Basis of Detoxication. Vol. 1. Academic Press; New York, NY: 1980. pp. 201–227. [Google Scholar]
- 43.Ziegler DM. Recent studies on the structure and function of multisubstrate flavin-containing monooxygenase. Annual Review of Pharmacology and Toxicology. 1993;33:179–199. doi: 10.1146/annurev.pa.33.040193.001143. [DOI] [PubMed] [Google Scholar]
- 44.Ziegler DM, Poulsen LL. Catalytic mechanism of FMO-catalyzed N- and S-oxidations. In: Gooderham N, editor. Drug Metabolism. Towards the Next Millennium. IOS Press; Amsterdam: 1998. pp. 30–38. [Google Scholar]
- 45.Furnes B, Fent J, Sommer SS, Schlenk D. Identification of novel variants of the flavin-containing monooxygenase gene family in African Americans. Drug Metabolism and Disposition. 2003;31:187–193. doi: 10.1124/dmd.31.2.187. [DOI] [PubMed] [Google Scholar]


