

Abstract
Obesity is associated with low-grade chronic inflammation, which contributes to cellular dysfunction promoting metabolic disease. Obesity during pregnancy leads to a proinflammatory milieu in the placenta; however, the underlying causes for obesity-induced placental inflammation remain unclear. Here, we examine the mechanisms by which saturated fatty acids and inflammatory cytokines induce inflammation in placental trophoblasts. We conducted global transcriptomic profiling in BeWo cells following palmitate and/or TNFα treatment and gene/protein expression analyses of MAPK pathways and characterized downstream transcription factors directly regulating inflammatory cytokines. Microarray analysis revealed increased expression of genes regulating inflammation, stress response, and immediate early response in cytotrophoblasts in response to palmitic acid (PA), TNFα, or a combination of both (PA + TNFα). Both gene ontology and gene set enrichment analysis revealed MAPK and EGR-1 signaling to be upregulated in BeWo cells, which was confirmed via immunoblotting. Importantly, activation of JNK signaling was necessary for increased proinflammatory cytokine (IL-6, TNFα, and IL-8) and EGR1 mRNA. Consistent with the requirement of JNK signaling, ChIP analysis confirmed the recruitment of c-Jun and other MAPK-responsive immediate early factors on the EGR1 promoter. Moreover, recruitment of EGR-1 on cytokine promoters (IL-6, TNFα, and IL-8) and an impaired proinflammatory response following knockdown of EGR-1 suggested it as a central component of the mechanism facilitating inflammatory gene expression. Finally, akin to in vitro findings, term placenta from obese women also had both increased JNK and p38 signaling and greater EGR-1 protein relative to lean women. Our results demonstrate that lipotoxic insults induce inflammation in placental cells via activation of JNK/EGR-1 signaling.
Keywords: developmental programming, early growth response protein-1, fatty acids, gestational obesity, mitogen-activated protein kinase
at present, more than 60% of all pregnancies in the US are in women who are either overweight or obese at conception (45, 52). Pregravid obesity significantly increases the risk of preeclampsia, gestational diabetes, and other labor-related complications in the mother. As to the offspring, maternal obesity elevates the risk of being born large for gestational age and with birth defects (34). Moreover, early exposure to an obese intrauterine environment increases the offspring's risk for developing obesity, cardiovascular disease, and diabetes in adulthood (5, 6, 45, 71, 75). As the only fetal tissue in direct contact with the maternal environment, the placenta serves as the singular interface between mother and the developing fetus. The placenta also mediates changes in the in utero environment by altering maternal metabolism and by directly regulating the transport of nutrients to the fetus (8). Therefore, alterations in maternal diet, nutritional status, and disease are communicated to the fetus through the placenta. Hence, the placenta plays a central role in how maternal obesity influences programming of health outcomes in the offspring (72).
Maternal obesity during pregnancy has been associated with a proinflammatory milieu during embryogenesis and in the placenta during mid- to late gestation (14, 54, 80). To date, placental inflammation has been characterized by increased macrophage infiltration (7, 14, 80) and increased cytokine production within the placenta (7, 54, 80). Although inflammation of the placenta and pregravid obesity appear to be unambiguously linked, two important issues remain unresolved: 1) the nature of maternal signals associated with obesity that initiate inflammation and 2) the precise molecular mechanisms orchestrating proinflammatory responses in placenta. Increased inflammation may alter placental development and/or function (54) and in turn promote long-term changes in fetal and offspring metabolism. Furthermore, obesity is associated with numerous physiological changes (hyperinsulinemia, elevated acute-phase proteins, subclinical endotoxemia, etc.) that could potentially contribute to placental inflammation. Most notably, fatty acids and inflammatory cytokines have been shown to induce proinflammatory responses in variety of cellular contexts (11, 47, 66, 69) and are elevated in obese pregnancies (50–52, 54), suggesting lipotoxicity as a causal mechanism of placental inflammation.
Mitogen-activated kinases (MAPK) are central mediators of proinflammatory signaling. The three major MAPK cascades, extracellular signal-regulated kinase 1/2 (ERK1/2), c-Jun NH2-terminal kinases (JNK), and p38 MAPK (p38), signal independently or interdependently with overlapping substrates to regulate gene expression (30, 37). Inflammatory cytokines, saturated fatty acids, and bacterial products (such as LPS) elicit proinflammatory responses by binding to cognate cytokine or Toll-like receptors (TLR), activating JNK and p38 MAPK signaling and downstream transcription factors (30, 37, 38). Likewise in hepatocytes, adipocytes, muscle, and immune cells, saturated fatty acids signal via TLR4 to activate MAPKs (JNK and NF-κB) to regulate the transcription of inflammatory cytokines (IL-1, IL-6, IL-8, and TNFα) (3, 23, 24, 27). However, very little is known regarding the mechanisms underlying lipotoxicity-induced inflammation in placenta cells. Specifically, the role of immediate early response transcription factors associated with regulation of inflammatory cytokines remains unknown in the placenta.
In the present report, we tested the hypothesis that obesity-related factors (saturated fatty acids and/or inflammatory cytokines) would lead directly to inflammation in placental cytotrophoblasts (BeWo cells). Specifically, using microarrays, we analyzed gene expression profiles in the trophoblasts following lipotoxic challenge with palmitate and TNFα. Second, we examined the roles of MAPKs (ERK1/2, JNK, and p38) and immediate early response transcription factors in regulating cytokine gene expression. Utilizing loss-of-function approaches, we determined a role for MAPK/early growth response protein-1 (EGR-1) signaling in mediating the proinflammatory response to fatty acids. Finally, we examined the status of MAPK and EGR-1 pathways in term placenta from obese women with uncomplicated pregnancies. Our data indicate that placental trophoblasts are responsive to lipotoxicity and demonstrate a role for EGR-1 in regulation of obesity-induced placenta inflammation.
METHODS
Cell culture and experimental conditions.
BeWo cells (American Type Culture Collection, Manassas, VA) were maintained in Ham's F-12K medium (Kaighn's modification) supplemented with 15% fetal bovine serum and 1% antibiotic-antimycotic (Life Technologies, Carlsbad, CA) under standard cell culture conditions. Following overnight serum deprivation, cells were treated with either palmitic acid (PA; 500 μM), TNFα (10 ng/ml), a combination of PA and TNFα (500 μM and 10 ng/ml, respectively), or fatty acid-free BSA alone (CON) for the amount of time specified in the individual figures. A molar ratio of 3:1 (PA/BSA) was used at a pH of 7.3. In some experiments, cells were treated with one of the following specific MAPK inhibitors: 10 μM SP-600125 (JNK/SAPK1/2 inhibitor; AG Scientific, San Diego, CA), 50 μM PD-98059 (ERK1/2 inhibitor, Millipore, Billerica, MA), or 10 μM SB203580 (p38 inhibitor; Sigma-Aldrich) for 2 h prior to the treatments with PA, TNFα, or the combination.
Collection of term placental samples.
Placenta were collected at the University of Arkansas for Medical Sciences (UAMS) after informed consent was obtained from mothers at term. The protocol was approved by the Institutional Review Board at UAMS (NCT01104454). Only nonsmoking mothers without gestational diabetes, preeclampsia, or other complications were included. Both vaginal and cesarean deliveries were included. No information was collected on maternal race or ethnicity. Maternal prepregnancy weight and height were self-reported, whereas birth weight, sex, fetal heart rate, and Apgar score (1 and 5 min) of the baby were obtained from medical history. Subjects were dichotomized on the basis of BMI into lean (BMI 18–24.9 kg/m2; n = 11) and obese groups (BMI 30–45 kg/m2; n = 11). Placenta were processed within 20 min after collection. Placental weight was obtained after the umbilical cord and fetal membranes were trimmed. Samples were collected for protein analysis from six separate locations covering the entire placenta. Tissue lysates from villous samples were taken from similar locations in the placenta and prepared for immunoblotting, as described below.
EGR-1 knockdown.
Predesigned scrambled (non-specific) or EGR-1 shRNA containing vectors (cloned into pLKO.1) were purchased as glycerol stocks (Mission; Sigma-Aldrich). Lentiviral particles were generated by transfecting human embryonic kidney-293FT cells with 3 μg of short hairpin (sh)RNA containing vector, 250 ng of pMD2.G, and 750 ng of psPAX2 using FuGENE 6 reagent (Roche Applied Sciences, Indianapolis, IN). Viral supernatant was collected every 24 h for a total of 3 days. BeWo cells were incubated in the lentiviral-containing medium for 24 h, and transduced cells were selected using puromycin (5 μg/ml). Stably transduced cell lines were grown for at least three passages, after which RT-PCR was performed to confirm knockdown of EGR1.
RNA isolation and microarray analysis.
Total RNA was isolated using TRI reagent (Molecular Research Center, Cincinnati, OH) and cleaned using the RNeasy mini kit, including on-column DNase digestion (Qiagen, Valencia, CA). RNA integrity was assessed using the Experion RNA StdSens analysis kit (Bio-Rad, Hercules, CA). For gene expression profiling, two microarrays per group were used. Pools of equal amounts of RNA from three samples were used for analysis per microarray. Thus, n = 6 samples/group were represented over two microarrays. Briefly, 0.5 μg of purified RNA was used to synthesize cDNA. Biotin-labeled aRNA was synthesized from double-stranded cDNA using the GeneChip IVT labeling kit (Affymetrix, Santa Clara, CA). The probe array was scanned after hybridization, wash, and staining protocols using a GeneChip Scanner 3000 according to the manufacturer's instructions (58, 60, 67).
Microarray data normalization and analysis.
Microarray data analysis was carried out using GeneSpring version 11 software (Agilent Technologies, Santa Clara, CA) (58, 61, 62). CEL files containing the probe level intensities were processed using the robust multiarray analysis algorithm for background adjustment, normalization, and log2 transformation of perfect match values (28). Subsequently, the data were subjected to normalization by setting measurements <0.01 to 0.01 and by per-chip and per-gene normalization using GeneSpring normalization algorithms. Raw data are accessible in the National Center for Biotechnology Information GEO database (GSE43685). The normalized data were used to generate lists of differentially expressed genes between PA, TNFα, and combination treatment groups relative to CON. Genes were filtered based on minimum ±1.5-fold change (treatment vs. CON) and a P value ≤0.05 using Student's t-test. A list of transcripts that were differentially expressed as a function of treatment (PA, TNFα, and PA + TNFα) was generated, and correlation-based hierarchical clustering between treatment groups was performed. Known biological functions of genes were queried using Affymetrix NetAffx and gene ontology (GO) analyses for biological processes performed using GeneSpring (58, 67). Finally, gene set enrichment analysis (GSEA) was utilized to identify molecular functions and transcription factors enriched by PA and combination treatments. GSEA does not rely on an arbitrary cutoff (such as fold change between groups) and is a computational method that determines whether an a priori-defined set of genes shows statistically significant and concordant differences between two biological states (62, 68).
Real-time RT-PCR.
Total RNA (1 μg) was reverse transcribed using the IScript cDNA synthesis kit, and subsequent real-time PCR analysis was performed using an ABI Prism 7500 sequence detection system (Applied Biosystems, Foster City, CA). Gene-specific primers were designed using Primer Express Software (Applied Biosystems). The relative amounts of mRNA were quantified using a standard curve and normalized to the expression of cyclophilin A mRNA (60).
Immunoblotting.
Total cell and tissue lysates were prepared in RIPA buffer (25 mM Tris·HCl, 150 mM NaCl, 1.0% NP-40, 1.0% deoxycholic acid, 0.1% SDS, and 2 mM EDTA) containing 1 mM PMSF and protease inhibitor cocktail. Nuclear proteins were isolated using NE-PER reagents according to manufacturer's instructions (Thermo Fisher Scientific, Rockford, IL). Proteins were resolved by SDS-PAGE, and immunoblotting was carried out using standard procedures (59, 62). Membranes were incubated with primary antibodies against EGR-1, p-ERK1/2, ATF3 (Santa Cruz Biotechnology, Santa Cruz, CA), serum response factor (SRF), ERK1/2, p38, JNK/SAPK, p-JNK/SAPK, c-Jun (Cell Signaling Technology, Danvers, MA), p-p38 (New England BioLabs, Ipswich, MA), TATA-binding protein (Abcam, Cambridge, MA), GAPDH (Sigma-Aldrich), and α-tubulin (Active Motif, Carlsbad, CA) for 16 h at 4°C. HRP-conjugated secondary antibodies against rabbit and mouse IgG (Santa Cruz Biotechnology) were used for protein detection. Quantitation of immunoblots was performed using Quantity One software (Bio-Rad).
Chromatin immunoprecipitation.
Recruitment of transcription factors on promoters of target genes was monitored using chromatin immunoprecipitation (ChIP) assay, using previously described procedures (57). Following respective treatments, cells were cross-linked with 1% formaldehyde for 10 min, and nuclei were isolated in ChIP cell lysis buffer (5 mM PIPES, 85 mM KCl, and 0.5% NP-40). Cells from three to four separate dishes per group were pooled to create three biological replicates. Nuclei were resuspended in ChIP sonication buffer (1× PBS, 1% NP-40, 0.5% sodium deoxycholate, and 0.1% SDS), and chromatin was sheared using a Covaris S220 ultrasonicator (Covaris, Woburn, MA). Prior to immunoprecipitation (IP), a 50-μl aliquot of sheared chromatin was removed from each sample and stored at −70°C to be utilized as DNA input. Aliquots of sheared chromatin were incubated with antibody-bound magnetic protein A/G beads (Millipore). All antibodies were ChIP grade. Antibody-chromatin complexes were washed serially in low-salt, high-salt, and LiCl-containing wash buffer and eluted in elution buffer (1% SDS, 0.1 M NaHCO3). Immunoprecipitated DNA was purified using standard phenol-chloroform-IAA following overnight reverse cross-linking and treatment with RNaseA and proteinase K (Life Technologies). The yield of specific promoter target sequences was analyzed by PCR with input or IP DNA using GoTaq Green master mix (Promega, Madison, WI). Primer sequences are provided in Table 1. PCR amplicons were separated via agarose gel electrophoresis and visualized by ethidium bromide staining.
Table 1.
DNA oligonucleotides for ChIP
| Promoter | Primer |
|---|---|
| Human EGR-1 promoter | |
| AP-1 and CRE-2 sites | |
| Sense | 5′-GGGCCCTGGATGACAGCGATAGAA-3′ |
| Antisense | 5′-TCAGGCGGCTCCTAGGCGTGAACTA-3′ |
| 2 × SRE and CRE-1 sites | |
| Sense | 5′-TAGGGTGCAGGATGGAGGT−3′ |
| Antisense | 5′-TATTTGAAGGGTCTGGAACGGCAC-3′ |
| 3 × SRE site | |
| Sense | 5′-AGGGAGCAACCAGCTGCGA-3′ |
| Antisense | 5′-TCCCTCCGCCTTCTTCCCT-3′ |
| Human TNFα promoter | |
| Sense | 5′-CACAAATCAGTCAGTGGCCCAGAA-3′ |
| Antisense | 5′-CTTCCTTGGTGGAGAAACCCATGA-3′ |
| Human IL-6 promoter | |
| Sense | 5′-TGTGTCTTGCCATGCTAAAGGACG-3′ |
| Antisense | 5′-TAGAGCTTCTCTTTCGTTCCCGGT-3′ |
| Human IL-8 promoter | |
| Sense | 5′-AGTGTGATGACTCAGGTTTGCCCT-3′ |
| Antisense | 5′-AAGCTTGTGTGCTCTGCTGTCTCT-3′ |
ChIP, chromatin immunoprecipitation; EGR-1, early growth response protein-1; AP-1, activating protein-1; CRE-1 and -2, cAMP response element-1 and -2, respectively; SRE, response elements from serum response factor.
H3K4me3 ChIP-seq and data analysis.
The genome-wide localization of the activating histone mark H3K4me3 was analyzed by ChIP-seq in BeWo cells after treatment with or without PA for 24 h. ChIP was performed as described above using ChIP-validated H3K4me3 antibody (Abcam). Purified immunoprecipitated and input DNA were utilized to prepare libraries for sequencing using NEBNext reagents. Briefly, 150 ng of DNA was used for end filling, dA tailing, and ligation with Illumina's paired-end adapters according to the manufacturer's recommendations. Adapter-ligated DNA was amplified using PCR, and products ∼200–350 bp were used for cluster generation. Single-read 36-bp sequencing of libraries was performed with a Genome Analyzer IIx (Illumina, San Diego, CA). Image analysis, including base calls, was performed by Real-Time Analysis software (RTA version 2.6; Illumina), and preprocessing, including demultiplexing, was performed using scripts in the CASAVA version 1.7 pipeline (Illumina). Alignment to the human hg19 genome was carried out using Bowtie and exported into SAM format. Identification of H3K4me3 peaks was performed using MACS (79), and data were exported in .BED format. Two comparisons were made: control vs. input to localize regions of active transcription in BeWo cells and PA vs. CON to identify regions that undergo epigenomic modification following PA exposure. Subsequent data analysis, including annotation of peaks with the closest transcription start site (TSS), genomic localization, and visualization of coverage maps, was carried out using SeqMonk and PeakAnalyzer software packages (http://www.bioinformatics.bbsrc.ac.uk/projects/seqmonk/; Babraham Bioinformatics, Cambridge, UK). Enrichment of GO terms for biological processes was carried out using GoRilla, and P values were corrected using the FDR method.
Statistical analysis.
Data are expressed as means ± SE. Real-time RT-PCR data are expressed as mean fold change from control ± SE, and Western blot data are expressed as means ± SE. Statistical differences between CON and PA or CON and PA + TNFα were determined using a two-tailed Student t-test. In cases where four groups (CON, PA, TNFα, and PA + TNFα) were compared, a two-way ANOVA followed by all pairwise comparison by the Student-Neuman-Keuls method was performed. P ≤ 0.05 was considered statistically significant. Statistical analyses were performed using SigmaStat 3.3 software (Systat Software, San Jose, CA).
RESULTS
Palmitate and TNFα have distinct effects on the BeWo cell transcriptome.
Hierarchical clustering of microarray data revealed significant treatment effects on global gene expression. Compared with the control group, PA, TNFα, and the combination altered the expression of 724, 167, and 952 transcripts, respectively (±1.5 fold, P ≤ 0.05; Fig. 1A). Table 2 depicts the top 10 genes that were either up- or downregulated by each treatment. EGR1 had the greatest fold increase following both PA and combination treatments and the greatest fold decrease following TNFα treatment (Table 2). Hierarchical clustering of the union of differentially expressed genes revealed that PA and PA + TNFα clustered together, suggesting a stronger influence of PA on gene expression changes compared with TNFα (Fig. 1B). Approximately one-half of the genes altered by the combination were unique (i.e., not altered with either PA or TNFα alone; Fig. 1A), indicating an interaction between the two treatments. Analysis of biological processes revealed that genes involved in response to extracellular stimuli (organic substance, chemical stimulus, and cytokine stimulus), lipotoxicity (lipid localization and storage, apoptosis, cellular stress, and unfolded protein response), and inflammation (cytokine signaling, MAPK signaling, and immune response) were significantly altered following the combination treatment (Fig. 1C). Consistent with GO term enrichment, genes involved in the response to chemical stimulus (Fig. 1D) regulating immediate early response (FOS, JUN, and EGR1) and lipid storage (PLIN2, ANGPTL4, APOA2) were similarly increased in the PA and the PA + TNFα treatments relative to CON. Moreover, genes regulating inflammation (SAA1, TNFα, IL6, and CXCL16) were induced mainly with the combination. Similarly, GSEA of molecular functions altered by PA or the combination identified MAPK signaling (Fig. 1E), cytokine binding, and nuclear cytoplasmic transport (data not shown). Enrichment of transcription factor motifs revealed genes regulated by immediate early response transcription factors downstream of MAPKs (SRF, ATF3, and CREB/c-Jun) to be increased significantly with both PA and PA + TNFα treatment (Fig. 1F). Real-time PCR confirmed that genes involved in proinflammatory processes were increased primarily in the TNFα and the combination, whereas immediate early transcription factors and genes involved in lipid metabolism were increased following treatment with PA or PA + TNFα (Fig. 1G).
Fig. 1.
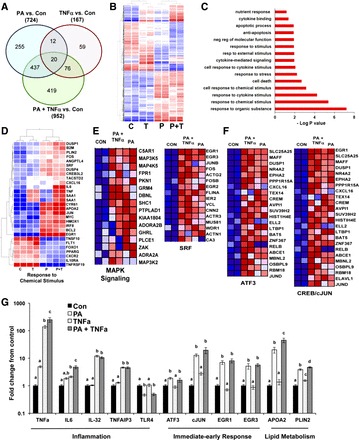
Transcriptome analysis of BeWo cells challenged with palmitic acid (PA), TNFα, or PA + TNFα. A and B: Venn diagram (A) and hierarchical clustering (B) of differentially expressed genes (±1.5-fold change, P ≤ 0.05) in BeWo cells following 24-h exposure to PA, TNFα, and PA + TNFα. C: gene ontology (GO) analysis of biological processes of genes altered by PA + TNFα treatment. D: correlation-based clustering of genes with known functions in response to chemical stimulus. E and F: gene set enrichment analysis of molecular functions showing MAPK signaling (E) and transcription factor motifs showing genes regulated by serum response factor (SRF), ATF3, and CREB/c-Jun enriched in BeWo cells treated with PA or PA + TNFα (F). Heat map colors red, white, and blue represent upregulation, no relative effect, and downregulation of transcripts, respectively. G: mRNA expression of genes involved with inflammation, immediate early response, and lipid transport assessed via real-time RT-PCR (n = 6/group). Values were normalized to cyclophillin mRNA expression and are expressed as mean fold change relative to the vehicle-treated group. Statistical significance (P ≤ 0.05) was assessed using a 2-way ANOVA, followed by all-pairwise comparison by the Student-Neuman-Keuls method. Different lowercase letters (a, b, or c) indicate significantly different values. Con, control.
Table 2.
Top gene changes with PA, TNFα, or PA + TNFα
| 500 μM PA |
10 ng/ml TNFα |
500 μM PA + 10 ng/ml TNFα |
|||
|---|---|---|---|---|---|
| Gene ID | Fold Change | Gene ID | Fold Change | Gene ID | Fold Change |
| Upregulated | |||||
| EGR1 | 9.1 | C3 | 8.4 | EGR1 | 12.8 |
| HMGCS2 | 7.6 | ITGB6 | 5.2 | DDAH1 | 7.5 |
| OLAH | 5.0 | IL32 | 4.8 | VTCN1 | 5.1 |
| DDAH1 | 5.0 | PSMB9 | 3.8 | APOA2 | 5.1 |
| APOA2 | 4.4 | OLR1 | 3.8 | CYR61 | 5.0 |
| ACSL5 | 4.0 | NPPB | 3.6 | IL32 | 4.8 |
| CYR61 | 3.5 | SERPINE1 | 3.4 | TNFAIP3 | 4.8 |
| LETM2 | 3.2 | LFNG | 3.4 | TNFRSF19 | 4.6 |
| RCAN1 | 3.1 | ASS1 | 3.3 | C3 | 4.6 |
| ALDH8A1 | 3.1 | TNFAIP3 | 3.2 | ACSL5 | 4.4 |
| Downregulated | |||||
| TNFRSF19 | −4.1 | EGR1 | −1.9 | VTCN1 | −5.1 |
| VTCN1 | −3.3 | PEG10 | −1.8 | TNFRSF19 | −4.6 |
| S100A4 | −3.1 | C13orf37 | −1.8 | S100A4 | −4.1 |
| TNFSF10 | −2.9 | AGXT | −1.7 | KRT24 | −4.0 |
| RNF145 | −2.7 | WNK2 | −1.6 | AGXT | −3.9 |
| MYCT1 | −2.5 | PTGFRN | −1.6 | AGXT | −3.7 |
| AGX | −2.4 | MYC | −1.6 | C11orf45 | −3.4 |
| PHACTR1 | −2.4 | S100A4 | −1.5 | TRIM9 | −3.3 |
| CLDN10 | −2.3 | MMP1 | −1.5 | HS6ST2 | −3.1 |
| UGCG | −2.3 | TRIM29 | −1.5 | AGXT | −3.0 |
PA, palmitic acid.
PA and PA + TNFα treatment is associated with MAPK activation.
To determine the temporal changes in MAPK with either PA or PA + TNFα, we assessed total and phosphorylated protein levels of p38, JNK, and ERK1/2 MAPKs over 24 h (Fig. 2). Levels of phosphorylated JNK increased ∼1.5-fold (P < 0.02) at 6 h following PA treatment, whereas p38 or ERK1/2 phosphorylation (relative to total protein) was not changed (Fig. 2, A and C). Similarly, JNK activation was evident at 3 h following PA + TNFα treatment (P < 0.01) and remained higher through 24 h of treatment (P < 0.01; Fig. 2, B and D). In contrast to PA alone, the combination treatment induced phosphorylation of ERK1/2 by two- (P < 0.003) and 3.5-fold (P < 0.001) at 60 min and 6 h, respectively. There was no change in p38 activation following treatment with PA + TNFα. Together, these data indicate that lipotoxic stimulus activates JNK signaling in trophoblast cells, which may promote downstream regulation of inflammatory cytokine expression.
Fig. 2.
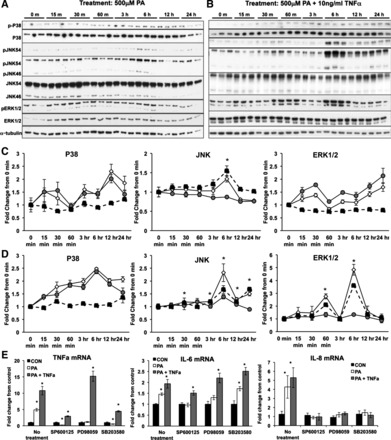
Temporal analysis of MAPK activation and cytokine gene expression in response to PA or PA + TNFα. A and B: immunoblot anlaysis for total and phosphorylated p38, JNK1/2, and ERK1/2 over a 24-h time course following treatment with PA (A) or PA + TNF-α (B). C and D: densitometric quantitation of immunoblots (normalized to α-tubulin) for phosphorylated protein (◇), total protein (gray circle), or the ratio of phosphorylated to total protein (■) for PA (C) or PA + TNF-α treated cells (D). Values are expressed as mean fold change over 0 h. *Significant difference for the ratio of phosphorylated to total protein (P ≤ 0.05) compared with 0-h time point. E: mRNA expression of cytokine genes at 24 h following exposure to PA or PA + TNFα with and without preexposure to MAPK inhibitors SP-600125 (JNK inhibitor), PD-98059 (ERK1/2 inhibitor), and SB-203580 (p38 inhibitor). Gene expression was normalized to cyclophillin mRNA (n = 6/group). Statistical differences were determined using Student's t-test. *Significance, P ≤ 0.05.
Specific MAPK inhibitors were used to further examine the importance of JNK signaling in the regulation of cytokine gene expression (Fig. 2E). Pretreatment with both JNK and ERK1/2 inhibitor was sufficient to prevent the induction TNFα, IL-6, and IL-8 by PA (Fig. 2E). p38 MAPK inhibition also blocked increases in TNFα and IL-8 mRNA following exposure to PA; however, it did not impair the induction of IL-6. All three inhibitors were unable to completely abolish the induction of inflammatory cytokines TNFα or IL-6 mRNA (Fig. 2E) by the combination treatment, suggesting that mechanisms outside of MAPK signaling, such as MAPK-independent activation of NF-κB, are likely involved in regulating cytokine production in response to PA + TNFα. However, JNK inhibition decreased the induction of TNFα and IL-6 mRNA by 75 and 25%, respectively, suggesting that JNK activation contributes significantly to the proinflammatory response. Collectively, these data support the conclusion that JNK signaling is necessary for a proinflammatory response to lipotoxicity; however, it appears that other MAPK signaling may also be important for this response.
MAPKs regulate ATF3, c-Jun, and SRF in response to PA and PA + TNFα.
BeWo cells exposed to either PA or the combination showed a twofold increase in the mRNA expression of immediate early transcription factors ATF3 and c-Jun and a 1.2-fold increase of SRF by 6 h (Fig. 3A). Moreover, ATF3, c-Jun, and SRF nuclear proteins were significantly greater by 8 h of PA (P < 0.02) and PA + TNFα (P < 0.002) treatments (Fig. 3B). These temporal changes are consistent with the activity downstream of JNK activation observed at 6 h (Fig. 2). Accordingly, inhibition of JNK signaling was sufficient to not only inhibit the induction of ATF3, c-Jun, and SRF expression in response to PA and PA + TNFα but also significantly reduce the expression of these genes below levels in CON cells (P < 0.05; Fig. 3C).
Fig. 3.
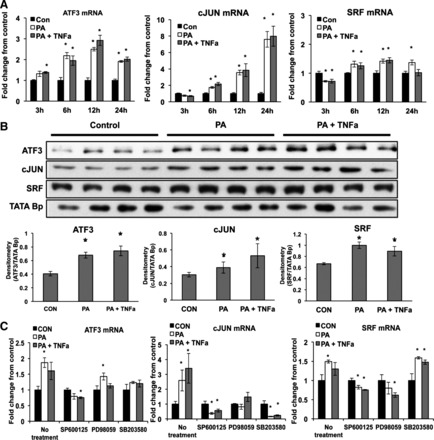
Expression of ATF3, c-Jun, and SRF following exposure to PA and PA + TNFα. A: mRNA expression of the immediate early-response genes via real-time PCR following exposure to PA or PA + TNFα over 24 h (n = 6/group). B: immunoblot analysis and densitometry quantitation of ATF3, c-Jun, and SRF nuclear protein levels 8 h following PA or PA + TNFα treatment. Densitometry values were normalized to TATA-binding protein. C: mRNA expression of immediate early-response genes at 24 h following exposure to PA or PA + TNFα with and without preexposure to MAPK inhibitors SP-600125 (JNK inhibitor), PD-98059 (ERK1/2 inhibitor), and SB-203580 (p38 inhibitor). Gene expression was normalized to cyclophillin mRNA (n = 6/group). Statistical differences were determined using Student's t-test. *Significance, P ≤ 0.05.
Immediate early response transcription factors are recruited to EGR1 promoter, in turn regulating cytokine expression.
EGR1 mRNA was maximally induced by 12 h following treatments with PA or the combination (P < 0.05; Fig. 4A). Active gene transcription is associated with the H3K4me3 (trimethyl) chromatin modification (2, 55). Using ChIP-seq, we examined genome-wide localization of H3K4me3 in control and PA-treated cells. Untreated cells showed ∼3,000 peaks (5% FDR, P < 0.00001, M-fold = 10–30), ∼90% of which were ±500 bp from TSS. PA treatment resulted in ∼800 differential H3K4me3 marks that were annotated to the closest TSS using SeqMonk. GO biological process analysis of genes that gained K4 trimethylation after PA treatment clearly showed enrichment of pathways regulating apoptosis, response to stimulus, and proliferation (Fig. 4B). Of these genes, H3K4me3 of EGR1 promoter was also increased (Fig. 4C), indicating acquisition of a permissive chromatin profile following PA treatment. The EGR1 promoter contains two CRE sites (ATF3/CREB), one activating protein-1 (AP-1) (c-Jun) site, and five SRE sites (SRF) that are central in gene regulation (Fig. 4D). ChIP analysis for ATF3, c-Jun, and SRF showed 1.7-fold greater recruitment of ATF3 to the EGR1 promoter in PA-treated cells (Fig. 4E), whereas the recruitment of c-Jun and SRF were increased 1.8- and 1.4-fold, respectively, following the combination treatment (Fig. 4E). Together, these data indicate that MAPK-responsive immediate early transcription factors regulate EGR1 mRNA expression. Consistent with the increase in EGR1 mRNA, PA and PA + TNFα treatments increased EGR-1 protein in the nucleus by 20 and 30% (P < 0.05), respectively (Fig. 5A). Furthermore, ChIP for EGR-1 showed increased recruitment of EGR-1 to the promoter regions of IL-6 (6.4- and 8.5-fold), TNFα (3.0- and 3.4-fold), and IL-8 (2.1- and 3.0-fold) after PA and combination treatment (Fig. 5B). Additionally, PA + TNFα treatment led to a 30 and 50% increase in recruitment of EGR-1 to the IL-6 and IL-8 promoters, respectively, over that of PA alone (Fig. 5B), suggesting that EGR-1 may also to contribute to the additional inflammatory response observed in combination-treated cells.
Fig. 4.
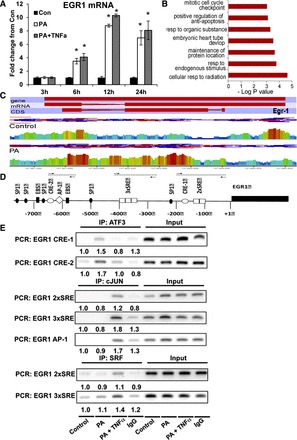
Transcriptional regulation of early growth response protein-1 (EGR-1) in response to PA or PA + TNFα. A: EGR1 mRNA expression following exposure to PA or PA + TNFα over 24 h. Values were normalized to cyclophillin mRNA (n = 6/group). B: GO term (biological processes) enrichment of genes with differential H3K4 trimethylation (me3) following PA treatment (500 μM, 24 h). Genome-wide H3K4me3 was assayed using chromatin immunoprecipitation (ChIP)-seq. C: alignment of H3K4me3 reads following ChIP-seq showing greater read density at the EGR1 gene locus following PA treatment. From top, tracks showing gene, mRNA, and coding DNA sequence (CDS) are in red, followed by control and PA groups. Read densities are shown as a heat map (red being high, blue being low) showing greater H3K4me3 in the PA group. D: a schematic of the human EGR1 promoter upstream of the transcriptional start site (+1). Response elements from SRF (SRE; white box), CREB (CRE; white oval), SP1 (black oval), Ets-1 (EBS; black box), and AP-1 (◇) are pictured in approximate location within the EGR1 promoter (not to scale). Arrows indicate PCR primer locations, and the dotted lines show areas of promoter amplification. E: ChIP was performed with ATF3, c-Jun, and SRF (or IgG as control) at 6 h following treatments with PA or PA + TNFα. PCR was performed using immunoprecipitated DNA or input DNA for various regions of the EGR1 promoter. Band intensity was quantified by densitometry and normalized to input DNA. Values are expressed relative to the control group. Statistical differences were determined using Student's t-test. *Significance, P ≤ 0.05. IP, immunoprecipitation.
Fig. 5.
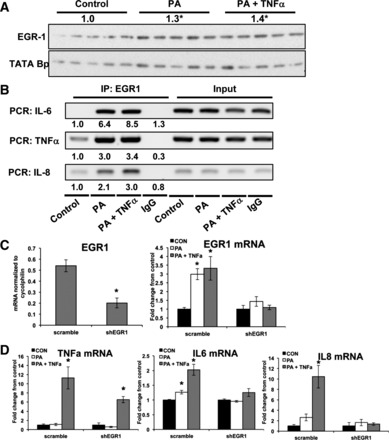
EGR1 regulation of inflammatory cytokine gene expression in response to PA or PA + TNFα. A: Western blot analysis and densitometry quantitation of EGR-1 nuclear protein levels following 24 h of PA or PA + TNFα treatment. Densitometry values were normalized to TATA-binding protein (n = 5). B: ChIP for EGR-1 (or IgG as control) was performed following 24-h treatments with PA or PA + TNFα. PCR was performed using immunoprecipitated or input DNA for regions containing the EGR-1 binding site on the IL-6, TNFα, and IL-8 promoters. Band intensity was quantified by densitometry and normalized to input DNA. Values are expressed as relative to the control group. C: EGR1 mRNA expression in BeWo cells transfected with either scrambled or EGR1 short hairpin RNAs (shRNAs) analyzed using real-time PCR. D: mRNA expression of inflammatory cytokines TNFα, IL-6, and IL-8 following 24-h exposure to PA or PA + TNFα in BeWo cells transfected with either scrambled or EGR1 shRNAs (n = 6). mRNA expression was normalized to cyclophilin mRNA and expressed as means ± SE relative to control group. *Significance, P ≤ 0.05.
To assess the role of EGR-1 in regulating cytokine expression, we generated BeWo cells transduced with shRNA targeting EGR1 (shEGR1). Quantitative RT-PCR confirmed a 62% decrease in EGR1 mRNA relative to cells expressing scrambled shRNA control (Fig. 5C). Furthermore, knockdown of EGR1 prevented the normal induction of EGR1 following treatments with PA or PA + TNFα (Fig. 5C). EGR1 knockdown also abrogated the increase in TNFα, IL-6, and IL-8 mRNA expression in response to PA treatment. Following treatment with PA + TNFα, knockdown of EGR1 completely inhibited the induction of IL-6 and IL-8 and reduced the induction of TNFα by 42% (P < 0.05; Fig. 5D). Together, these data indicate that the induction of EGR-1 is necessary for increased cytokine expression in response to PA and the combination in placental cells.
EGR-1 protein and JNK signaling is increased with pregravid obesity.
To examine the translational significance of MAPK/EGR-1 signaling in human obesity, we utilized term placental samples from lean and obese women (n = 11/group). Maternal and neonatal characteristics of the subjects are presented in Table 3. Maternal age, height, and parity were not significantly different between lean and obese groups, whereas maternal prepregnancy weight and BMI were significantly greater among the obese women (P < 0.05). In addition, birth weight and infant sex were not different between groups. Consistent with our in vitro data, obese placenta had significantly more p-JNK and p-P38 protein compared with lean controls (Fig. 6, A and B). Downstream of MAPKs, EGR-1 protein was also significantly increased by 33% (P < 0.05) in obese term placenta compared with lean controls (Fig. 6C). Although too few subjects were studied to statistically address sex differences, placenta from both male and female sexes showed comparable increases in Egr-1 and pJNK (data not presented).
Table 3.
Maternal and neonatal characteristics
| Lean (n = 11) | Obese (n = 11) | P Value | |
|---|---|---|---|
| Age, yr | 28.1 ± 2.1 | 31.1 ± 1.8 | 0.32 |
| Prepregnancy weight, lbs | 129.8 ± 3.7 | 213.7 ± 6.6 | <0.001 |
| Height, in. | 64.4 ± 0.7 | 65.1 ± 1.1 | 0.55 |
| BMI | 22.1 ± 0.4 | 35.9 ± 0.9 | <0.001 |
| Parity | 1.8 ± 0.4 | 2.5 ± 0.5 | 0.28 |
| Birth weight | 3,256.8 ± 105 | 3,312.7 ± 135 | 0.77 |
| Apgar | |||
| 1 min | 8.8 ± 0.1 | 8.6 ± 0.3 | 0.7 |
| 5 min | 8.9 ± 0.1 | 9.3 ± 0.2 | 0.06 |
| Fetal HR, beats/min | 138.9 ± 2.5 | 138.4 ± 4.0 | 0.9 |
| Sex of baby | 4 females, 7 males | 4 females, 7 males |
Values are means ± SE. HR, heart rate.
Fig. 6.
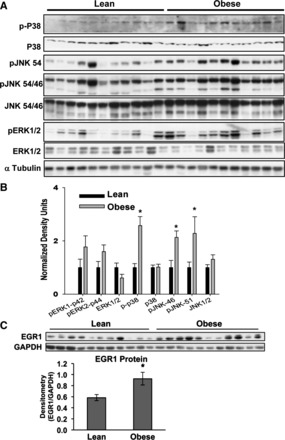
Protein expression of MAPKs and EGR-1 in term human placenta from lean and obese subjects. A and B: immunoblots (A) and densitometric quantitation (B) for total and phosphorylated p38, JNK1/2, and ERK1/2 in lean and obese placenta collected at term (n = 11). Data are normalized to α-tubulin levels and expressed relative to the lean group (means ± SE). C: immunoblot analysis and densitometric quantitation of EGR-1 protein levels in lean or obese placenta (n = 11). Densitometry values were normalized to GAPDH and expressed as means ± SE. *Significance, P ≤ 0.05.
DISCUSSION
An increasing body of both experimental and clinical evidence suggests that maternal obesity prior to and during gestation promotes a proinflammatory intrauterine environment (7, 54, 56, 62, 80). This is significant because placental and embryonic inflammation has been linked to adverse outcomes in fetal development (22, 25, 53, 78) and has been hypothesized to be a causal pathway for long-term metabolic programming in the offspring. In the present work, we utilized a widely studied placental trophoblast model to evaluate genome-wide responses to lipotoxic insults and to mechanistically identify pathways leading to inflammation. Several novel observations are evident from the present work. Exposure to lipotoxic stimuli led to 1) a distinct upregulation of proinflammatory genes, including activation of MAPKs, which are necessary mediators of placental inflammation; 2) recruitment of immediate early-response transcription factors ATF3 c-Jun and SRF downstream of JNK activation, leading to a transcriptionally permissive chromatin profile of the EGR-1 promoter; and 3) an obligatory requirement of JNK and EGR-1 for induction of inflammatory cytokine expression. Together, these results define a mechanistic pathway through which lipotoxicity induces inflammation in placenta cells. Most importantly, our findings show that JNK/EGR-1 signaling is activated in term placenta from obese women, highlighting the translational relevance of these findings.
Obesity in general, is characterized by a state of subclinical chronic inflammation (1, 10, 41), as is the maternal-fetal interface in obese pregnant women (7, 54, 56, 80). During pregnancy, maternal obesity has been associated with higher circulating inflammatory cytokines (IL-6 and CRP) (1, 7, 54), elevated IL-6 and TNFα mRNA expression in peripheral blood mononuclear cells (7, 14), and an exaggerated proinflammatory milieu of the placenta (7, 14, 54, 80). More specifically, inflammation in the obese placenta has been characterized by elevated numbers of CD68+ macrophages (7, 14, 80) as well as M1 (activated) macrophages, suggesting classical activation via proinflammatory cytokines or LPS (7, 80). Elevated numbers of proinflammatory immune cells are also associated with increased cytokine production (IL-1, IL-6, IL-8, and TNFα) in both midgestation and term placenta (7, 54, 80). Although these cytokines primarily promote the recruitment of additional immune cells, they may also stimulate signaling pathways within other placental cells (trophoblasts, endothelial cells, and stromal cells), leading to cellular stress and dysfunction. Our data clearly show that trophoblasts are responsive to extracellular TNFα and can exquisitely alter the expression of proinflammatory cytokines in response to a lipotoxic environment. Therefore, trophoblast cells are likely to contribute to excess inflammation associated with maternal obesity.
The placenta serves as the only portal for nutrients to the developing fetus and is key in regulating the in utero environment (4). Lipotoxicity and inflammation have been shown to induce cellular stress, resulting in altered tissue function (9, 16, 48, 76). Such changes in placental development and/or function may have detrimental consequences on fetal metabolism. Accordingly, alterations in both amino acid transport (14, 15) and lipid transport (40, 74, 81) have been associated with maternal obesity and increased placental inflammation. Likewise, in a nonhuman primate model of maternal obesity, increased fetal BMI and ponderal index were observed along with placental changes such as elevated proinflammatory signature, decreased system A amino acid transport, and increased placental thickness (14). Additionally, impaired system A amino acid transport has been observed in placenta from human subjects (15). Previous studies have also shown a strong association between maternal obesity-associated inflammation with augmented placental lipid (40), elevated fetal circulating lipids (81), and increased fetal adiposity (49). Specifically, in a comprehensive study of lean and obese pregnant women, Radaelli et al. (49) showed a strong positive relationship between increased maternal IL-6 and fetal adiposity. Similarly, increased neonatal adiposity was associated with elevated placental TNFα, leptin, phospholipase expression, and ω-3 polyunsaturated fatty acids (74). Activation of phopholipases PLAG2 and PLAG5 in placenta cells occurred following exposure to TNFα and leptin (74), demonstrating a potential link between maternal inflammation and altered placental lipid transport. Although the current study did not focus on the effects of lipotoxicity and trophoblast nutrient transport, exposure to palmitate and TNFα increased expression of APOA2 and PLIN2, an observation that is consistent with previous reports.
Although the precise mechanisms regulating increased cytokine production in placenta from obese women remain yet to be described, the present work suggests that JNK signaling is a central factor. These findings are consistent with a previous report (80) showing increased TLR2 and -4 mRNA and JNK and NF-κB signaling in placenta of overnourished sheep. Downstream of TLR4 activation, two main pathways exist to regulate proinflammatory cytokine gene expression. First is the NF-κB pathway, which includes activation of IKK, leading to degradation of IκB, freeing NF-κB from the cytoplasm and allowing translocation to the nucleus to regulate gene expression (19, 31, 44). Second, TLRs can activate MAPKs, p38, and JNK, which in turn activate immediate early-response transcription factors that regulate proinflammatory cytokine expression (23, 37). Specifically, heterodimetric transcription factor 1 (AP-1), consisting of transcription factor dimers from the Jun (c-Jun or JunD) transcription factor group, fos group (c-Fos), or activating transcription factors (ATFs), is fundamental to initiating a proinflammatory response (37). However, the immediate early transcription factor EGR-1 is also important for regulating the expression of inflammatory cytokines IL-6, IL-8, TNFα, and CCL2 (11, 26, 64). EGR-1, a Cys2/His2-type zinc finger transcription factor, regulates a number of cellular processes, including cellular growth, proliferation, apoptosis, and differentiation in response to an expansive range of extracellular stimuli (12, 46). Importantly, EGR-1 has also been shown to regulate both inflammation (11, 26, 64) and insulin signaling (32, 63) and provide a central link between metabolic disease and inflammation. EGR1 expression is regulated downstream of MAPKs through transactivation by other immediate early transcription factors (26). The specific upstream factors regulating EGR1 vary depending on the extracellular stimuli and the cellular context. Our data indicate that JNK-dependent activation of c-Jun and ATF3 is critical for the transactivation of EGR1 in response to a lipotoxic environment, a mechanism that is consistent with a previous report in immune cells (26). Moreover, the observed association between increased JNK signaling and EGR-1 protein in obese placenta may suggest that EGR-1 can mediate obesity-induced placental inflammation and warrants further investigation.
DNA binding sites for NF-κB, AP-1, and EGR-1 have been described in the promoters of a number of inflammatory cytokine genes including TNFα (73), IL-6 (13, 26, 35) and IL-8 (26, 33), indicating direct regulation of cytokine expression by these transcription factors. Importantly, studies have shown that combinations of transcription factor binding are required for transactivation of proinflammatory cytokine expression in an inducer-specific manner (11, 13, 21, 29, 73, 77). For example, EGR-1 is essential for IL-8 production in prostate cancer cells but works synergistically with NF-κB (42). In macrophages and monocytes, lipopolysaccharide-induced TNFα expression requires transactivation by EGR-1, NF-κB, and AP-1 (73, 77), suggesting that cooperation between transcription factors is necessary for complete induction of inflammatory cytokine expression. Our results suggest that in trophoblasts EGR-1 is important for the induction of TNFα, IL-6, and IL-8 expression in response to a lipotoxic environment. However, it is likely that other transcription factors are also necessary to form a complete activating complex. This is consistent with evidence in macrophages, where saturated fatty acid-mediated TNFα expression was associated with increased EGR1 and CREB but decreased NF-κB activation (11).
Upstream of TLRs, increased circulating fatty acids commonly observed in obesity are the probable link between obesity and placental inflammation since they induce TLR4 activation of JNK signaling (18, 39, 80). Although our clinical study was not designed to measure serum lipids, activated JNK and increased EGR-1 observed in obese placentas suggests a potential role for fatty acid signaling. Importantly, our data in BeWo cells show a direct link between elevated saturated fatty acids and increased inflammatory cytokine production, consistent with a previous study in human primary trophoblast cells (47). Interestingly, we observed a decrease in TLR2 and TLR4 mRNA expression following fatty acid and TNFα exposure, suggesting probable negative feedback regulation. ATF3 has been shown to induce a negative feedback mechanism that attenuates saturated fatty acid induction of TLR4 signaling (20, 70), consistent with the gene expression observed in our study. However, a parallel increase in cytokine expression and JNK activation suggests that TLR4-signaling cascade was activated earlier during the fatty acid exposure. These data suggest that negative feedback mechanisms are in place in trophoblast cells to help regulate fatty acid-induced inflammation and that chronic exposure to a lipotoxic environment may activate alternative pathways to inflammation.
Recent evidence has emerged from studies on the independent effects of maternal high-fat feeding that support the hypothesis that increased circulating lipids, as opposed to maternal obesity per se, are the mediator of fetal programming (36, 43, 65). Importantly, gestational exposure to high-fat diets has been associated with epigenetic changes (histone acetylation and methylation) in adipokine genes (43) and genes regulating glucose metabolism (65) in offspring tissues. Additionally, maternal high-fat diet has been associated with expression changes in genes encoding enzymes that regulate histone and DNA methylation in the placenta (17), suggesting a potential mechanism for fatty acid regulation of gene expression. Although placental inflammation has not been identified specifically as the link between high-fat feeding and fetal programming, it is likely to contribute. Accordingly, our data show a direct link between saturated fatty acid exposure and changes in chromatin structure within placenta cells that is permissive to increased gene expression of EGR1 and subsequent increases in inflammatory cytokine gene expression. Taken together, these findings suggest that a lipotoxic maternal environment is conducive to epigenetic adaptations, which may alter placental regulation of the fetal domain.
In conclusion, we present a genome-wide transcriptomic view of the response of trophoblast cells following lipotoxic challenge. Gene expression analysis revealed a distinctive role for MAPK activation, specifically JNK signaling, and subsequent immediate early transcription factors in regulation of EGR-1 levels. Furthermore, our studies identified EGR-1 as the essential mediator for lipotoxicity-induced cytokine gene expression in placenta cells. Most importantly, our findings show that analogous changes in JNK/EGR-1 signaling occur in term placenta from obese women, highlighting the translational relevance of these findings. These findings provide novel insights into the mechanisms underlying obesity-induced placental inflammation and provide further clues into the nexus between maternal obesity, inflammation, and metabolic programming in the offspring.
GRANTS
These studies were supported in part by USDA Agriculture Research Service Grant CRIS 6251-51000-007-04S and National Institute of Diabetes and Digestive and Kidney Diseases Grant R01-DK084225 (K. Shankar). Nursing support for these studies was provided in part by the UAMS Translational Research Institute funded by the National Institutes of Health Clinical and Translational Science Award program, Grants UL1-TR-000039 and KL2-TR-000063.
DISCLOSURES
The authors have nothing to disclose.
AUTHOR CONTRIBUTIONS
J.S., A.A., and K.S. contributed to the conception and design of the research; J.S., Y.Z., K.M.T., and S.J.B. performed the experiments; J.S., Y.Z., H.G.-A., K.M.T., S.J.B., and K.S. analyzed the data; J.S. interpreted the results of the experiments; J.S. prepared the figures; J.S. and K.S. drafted the manuscript; J.S., H.G.-A., K.M.T., A.A., and K.S. edited and revised the manuscript; A.A. and K.S. approved the final version of the manuscript.
ACKNOWLEDGMENTS
We gratefully acknowledge the members of the Arkansas Children's Nutrition Center-Human Studies Core for their assistance in studies using human subjects. We also thank Dr. Samantha Mckelvey and members of the nursing staff at the UAMS Labor & Delivery department for their assistance in sample collection.
REFERENCES
- 1. Basu S, Haghiac M, Surace P, Challier JC, Guerre-Millo M, Singh K, Waters T, Minium J, Presley L, Catalano PM, Hauguel-de Mouzon S. Pregravid obesity associates with increased maternal endotoxemia and metabolic inflammation. Obesity (Silver Spring) 19: 476–482, 2011 [DOI] [PMC free article] [PubMed] [Google Scholar]
- 2. Bernstein BE, Kamal M, Lindblad-Toh K, Bekiranov S, Bailey DK, Huebert DJ, McMahon S, Karlsson EK, Kulbokas EJ, 3rd, Gingeras TR, Schreiber SL, Lander ES. Genomic maps and comparative analysis of histone modifications in human and mouse. Cell 120: 169–181, 2005 [DOI] [PubMed] [Google Scholar]
- 3. Boden G. Fatty acid-induced inflammation and insulin resistance in skeletal muscle and liver. Curr Diab Rep 6: 177–181, 2006 [DOI] [PubMed] [Google Scholar]
- 4. Burton GJ, Fowden AL. Review: The placenta and developmental programming: balancing fetal nutrient demands with maternal resource allocation. Placenta 33 Suppl: S23–S27, 2012 [DOI] [PubMed] [Google Scholar]
- 5. Catalano PM. Increasing maternal obesity and weight gain during pregnancy: the obstetric problems of plentitude. Obstet Gynecol 110: 743–744, 2007 [DOI] [PubMed] [Google Scholar]
- 6. Catalano PM, Presley L, Minium J, Hauguel-de Mouzon S. Fetuses of obese mothers develop insulin resistance in utero. Diabetes Care 32: 1076–1080, 2009 [DOI] [PMC free article] [PubMed] [Google Scholar]
- 7. Challier JC, Basu S, Bintein T, Minium J, Hotmire K, Catalano PM, Hauguel-de Mouzon S. Obesity in pregnancy stimulates macrophage accumulation and inflammation in the placenta. Placenta 29: 274–281, 2008 [DOI] [PMC free article] [PubMed] [Google Scholar]
- 8. Cross JC. Placental function in development and disease. Reprod Fertil Dev 18: 71–76, 2006 [DOI] [PubMed] [Google Scholar]
- 9. Cusi K. Role of obesity and lipotoxicity in the development of nonalcoholic steatohepatitis: pathophysiology and clinical implications. Gastroenterology 142: 711–725.e6, 2012 [DOI] [PubMed] [Google Scholar]
- 10. Dandona P, Aljada A, Bandyopadhyay A. Inflammation: the link between insulin resistance, obesity and diabetes. Trends Immunol 25: 4–7, 2004 [DOI] [PubMed] [Google Scholar]
- 11. de Lima-Salgado TM, Alba-Loureiro TC, do Nascimento CS, Nunes MT, Curi R. Molecular mechanisms by which saturated fatty acids modulate TNF-alpha expression in mouse macrophage lineage. Cell Biochem Biophys 59: 89–97, 2011 [DOI] [PubMed] [Google Scholar]
- 12. DeLigio JT, Zorio DA. Early growth response 1 (EGR1): a gene with as many names as biological functions. Cancer Biol Ther 8: 1889–1892, 2009 [DOI] [PubMed] [Google Scholar]
- 13. Fan D, Li L, Wang C, Cui XB, Zhou Y, Wu LL. Adiponectin induces interleukin-6 production and its underlying mechanism in adult rat cardiac fibroblasts. J Cell Physiol 226: 1793–1802, 2011 [DOI] [PubMed] [Google Scholar]
- 14. Farley D, Tejero ME, Comuzzie AG, Higgins PB, Cox L, Werner SL, Jenkins SL, Li C, Choi J, Dick EJ, Jr, Hubbard GB, Frost P, Dudley DJ, Ballesteros B, Wu G, Nathanielsz PW, Schlabritz-Loutsevitch NE. Feto-placental adaptations to maternal obesity in the baboon. Placenta 30: 752–760, 2009 [DOI] [PMC free article] [PubMed] [Google Scholar]
- 15. Farley DM, Choi J, Dudley DJ, Li C, Jenkins SL, Myatt L, Nathanielsz PW. Placental amino acid transport and placental leptin resistance in pregnancies complicated by maternal obesity. Placenta 31: 718–724, 2010 [DOI] [PubMed] [Google Scholar]
- 16. Fujii H, Kawada N. Inflammation and fibrogenesis in steatohepatitis. J Gastroenterol 47: 215–225, 2012 [DOI] [PubMed] [Google Scholar]
- 17. Gabory A, Ferry L, Fajardy I, Jouneau L, Gothie JD, Vige A, Fleur C, Mayeur S, Gallou-Kabani C, Gross MS, Attig L, Vambergue A, Lesage J, Reusens B, Vieau D, Remacle C, Jais JP, Junien C. Maternal diets trigger sex-specific divergent trajectories of gene expression and epigenetic systems in mouse placenta. PLoS One 7: e47986, 2012 [DOI] [PMC free article] [PubMed] [Google Scholar]
- 18. Georgiadi A, Kersten S. Mechanisms of gene regulation by fatty acids. Adv Nutr 3: 127–134, 2012 [DOI] [PMC free article] [PubMed] [Google Scholar]
- 19. Ghosh CC, Ramaswami S, Juvekar A, Vu HY, Galdieri L, Davidson D, Vancurova I. Gene-specific repression of proinflammatory cytokines in stimulated human macrophages by nuclear IkappaBalpha. J Immunol 185: 3685–3693, 2010 [DOI] [PMC free article] [PubMed] [Google Scholar]
- 20. Gilchrist M, Thorsson V, Li B, Rust AG, Korb M, Roach JC, Kennedy K, Hai T, Bolouri H, Aderem A. Systems biology approaches identify ATF3 as a negative regulator of Toll-like receptor 4. Nature 441: 173–178, 2006 [DOI] [PubMed] [Google Scholar]
- 21. Gomard T, Michaud HA, Tempe D, Thiolon K, Pelegrin M, Piechaczyk M. An NF-kappaB-dependent role for JunB in the induction of proinflammatory cytokines in LPS-activated bone marrow-derived dendritic cells. PLoS One 5: e9585, 2010 [DOI] [PMC free article] [PubMed] [Google Scholar]
- 22. Greer LG, Ziadie MS, Casey BM, Rogers BB, McIntire DD, Leveno KJ. An immunologic basis for placental insufficiency in fetal growth restriction. Am J Perinatol 29: 533–538, 2012 [DOI] [PubMed] [Google Scholar]
- 23. Haversen L, Danielsson KN, Fogelstrand L, Wiklund O. Induction of proinflammatory cytokines by long-chain saturated fatty acids in human macrophages. Atherosclerosis 202: 382–393, 2009 [DOI] [PubMed] [Google Scholar]
- 24. Hirosumi J, Tuncman G, Chang L, Gorgun CZ, Uysal KT, Maeda K, Karin M, Hotamisligil GS. A central role for JNK in obesity and insulin resistance. Nature 420: 333–336, 2002 [DOI] [PubMed] [Google Scholar]
- 25. Hodyl NA, Stark MJ, Osei-Kumah A, Clifton VL. Prenatal programming of the innate immune response following in utero exposure to inflammation: a sexually dimorphic process? Expert Rev Clin Immunol 7: 579–592, 2011 [DOI] [PubMed] [Google Scholar]
- 26. Hoffmann E, Ashouri J, Wolter S, Doerrie A, Dittrich-Breiholz O, Schneider H, Wagner EF, Troppmair J, Mackman N, Kracht M. Transcriptional regulation of EGR-1 by the interleukin-1-JNK-MKK7-c-Jun pathway. J Biol Chem 283: 12120–12128, 2008 [DOI] [PubMed] [Google Scholar]
- 27. Hwang D, Rhee SH. Receptor-mediated signaling pathways: potential targets of modulation by dietary fatty acids. Am J Clin Nutr 70: 545–556, 1999 [DOI] [PubMed] [Google Scholar]
- 28. Irizarry RA, Hobbs B, Collin F, Beazer-Barclay YD, Antonellis KJ, Scherf U, Speed TP. Exploration, normalization, and summaries of high density oligonucleotide array probe level data. Biostatistics 4: 249–264, 2003 [DOI] [PubMed] [Google Scholar]
- 29. Jeong SH, Park JH, Kim JN, Park YH, Shin SY, Lee YH, Kye YC, Son SW. Up-regulation of TNF-alpha secretion by cigarette smoke is mediated by Egr-1 in HaCaT human keratinocytes. Exp Dermatol 19: e206–e212, 2010 [DOI] [PubMed] [Google Scholar]
- 30. Kaminska B. MAPK signalling pathways as molecular targets for anti-inflammatory therapy—from molecular mechanisms to therapeutic benefits. Biochim Biophys Acta 1754: 253–262, 2005 [DOI] [PubMed] [Google Scholar]
- 31. Karin M, Delhase M. The I kappa B kinase (IKK) and NF-kappa B: key elements of proinflammatory signalling. Semin Immunol 12: 85–98, 2000 [DOI] [PubMed] [Google Scholar]
- 32. Keeton AB, Bortoff KD, Bennett WL, Franklin JL, Venable DY, Messina JL. Insulin-regulated expression of Egr-1 and Krox20: dependence on ERK1/2 and interaction with p38 and PI3-kinase pathways. Endocrinology 144: 5402–5410, 2003 [DOI] [PubMed] [Google Scholar]
- 33. Khanjani S, Terzidou V, Johnson MR, Bennett PR. NFκB and AP-1 drive human myometrial IL8 expression. Mediators Inflamm 2012: 504952, 2012 [DOI] [PMC free article] [PubMed] [Google Scholar]
- 34. King JC. Maternal obesity, metabolism, and pregnancy outcomes. Annu Rev Nutr 26: 271–291, 2006 [DOI] [PubMed] [Google Scholar]
- 35. Kong HJ, Nam BH, Kim YO, Kim WJ, Cho HK, Lee CH, Lee SJ, Kim KK. Characterization of the flounder IL-6 promoter and its regulation by the p65 NF-kappaB subunit. Fish Shellfish Immunol 28: 961–964, 2010 [DOI] [PubMed] [Google Scholar]
- 36. Krasnow SM, Nguyen ML, Marks DL. Increased maternal fat consumption during pregnancy alters body composition in neonatal mice. Am J Physiol Endocrinol Metab 301: E1243–E1253, 2011 [DOI] [PMC free article] [PubMed] [Google Scholar]
- 37. Kyriakis JM, Avruch J. Mammalian MAPK signal transduction pathways activated by stress and inflammation: a 10-year update. Physiol Rev 92: 689–737, 2012 [DOI] [PubMed] [Google Scholar]
- 38. Kyriakis JM, Avruch J. Mammalian mitogen-activated protein kinase signal transduction pathways activated by stress and inflammation. Physiol Rev 81: 807–869, 2001 [DOI] [PubMed] [Google Scholar]
- 39. Lager S, Gaccioli F, Ramirez VI, Jones HN, Jansson T, Powell TL. Oleic acid stimulates system A amino acid transport in primary human trophoblast cells mediated by toll-like receptor 4. J Lipid Res 54: 725–733, 2013 [DOI] [PMC free article] [PubMed] [Google Scholar]
- 40. Lager S, Jansson N, Olsson AL, Wennergren M, Jansson T, Powell TL. Effect of IL-6 and TNF-alpha on fatty acid uptake in cultured human primary trophoblast cells. Placenta 32: 121–127, 2011 [DOI] [PubMed] [Google Scholar]
- 41. Lee YH, Pratley RE. The evolving role of inflammation in obesity and the metabolic syndrome. Curr Diab Rep 5: 70–75, 2005 [DOI] [PubMed] [Google Scholar]
- 42. Ma J, Ren Z, Ma Y, Xu L, Zhao Y, Zheng C, Fang Y, Xue T, Sun B, Xiao W. Targeted knockdown of EGR-1 inhibits IL-8 production and IL-8-mediated invasion of prostate cancer cells through suppressing EGR-1/NF-kappaB synergy. J Biol Chem 284: 34600–34606, 2009 [DOI] [PMC free article] [PubMed] [Google Scholar]
- 43. Masuyama H, Hiramatsu Y. Effects of a high-fat diet exposure in utero on the metabolic syndrome-like phenomenon in mouse offspring through epigenetic changes in adipocytokine gene expression. Endocrinology 153: 2823–2830, 2012 [DOI] [PubMed] [Google Scholar]
- 44. Medzhitov R, Preston-Hurlburt P, Janeway CA., Jr A human homologue of the Drosophila Toll protein signals activation of adaptive immunity. Nature 388: 394–397, 1997 [DOI] [PubMed] [Google Scholar]
- 45. Nelson SM, Sattar N, Freeman DJ, Walker JD, Lindsay RS. Inflammation and endothelial activation is evident at birth in offspring of mothers with type 1 diabetes. Diabetes 56: 2697–2704, 2007 [DOI] [PubMed] [Google Scholar]
- 46. Pagel JI, Deindl E. Early growth response 1—a transcription factor in the crossfire of signal transduction cascades. Indian J Biochem Biophys 48: 226–235, 2011 [PubMed] [Google Scholar]
- 47. Pathmaperuma AN, Mana P, Cheung SN, Kugathas K, Josiah A, Koina ME, Broomfield A, Delghingaro-Augusto V, Ellwood DA, Dahlstrom JE, Nolan CJ. Fatty acids alter glycerolipid metabolism and induce lipid droplet formation, syncytialisation and cytokine production in human trophoblasts with minimal glucose effect or interaction. Placenta 31: 230–239, 2010 [DOI] [PubMed] [Google Scholar]
- 48. Prieur X, Roszer T, Ricote M. Lipotoxicity in macrophages: evidence from diseases associated with the metabolic syndrome. Biochim Biophys Acta 1801: 327–337, 2010 [DOI] [PubMed] [Google Scholar]
- 49. Radaelli T, Uvena-Celebrezze J, Minium J, Huston-Presley L, Catalano P, Hauguel-de Mouzon S. Maternal interleukin-6: marker of fetal growth and adiposity. J Soc Gynecol Investig 13: 53–57, 2006 [DOI] [PubMed] [Google Scholar]
- 50. Ramsay JE, Ferrell WR, Crawford L, Wallace AM, Greer IA, Sattar N. Maternal obesity is associated with dysregulation of metabolic, vascular, and inflammatory pathways. J Clin Endocrinol Metab 87: 4231–4237, 2002 [DOI] [PubMed] [Google Scholar]
- 51. Reece EA. Obesity, diabetes, and links to congenital defects: a review of the evidence and recommendations for intervention. J Matern Fetal Neonatal Med 21: 173–180, 2008 [DOI] [PubMed] [Google Scholar]
- 52. Reece EA. Perspectives on obesity, pregnancy and birth outcomes in the United States: the scope of the problem. Am J Obstet Gynecol 198: 23–27, 2008 [DOI] [PubMed] [Google Scholar]
- 53. Rees S, Harding R, Walker D. The biological basis of injury and neuroprotection in the fetal and neonatal brain. Int J Dev Neurosci 29: 551–563, 2011 [DOI] [PMC free article] [PubMed] [Google Scholar]
- 54. Roberts KA, Riley SC, Reynolds RM, Barr S, Evans M, Statham A, Hor K, Jabbour HN, Norman JE, Denison FC. Placental structure and inflammation in pregnancies associated with obesity. Placenta 32: 247–254, 2011 [DOI] [PubMed] [Google Scholar]
- 55. Roh TY, Cuddapah S, Zhao K. Active chromatin domains are defined by acetylation islands revealed by genome-wide mapping. Genes Dev 19: 542–552, 2005 [DOI] [PMC free article] [PubMed] [Google Scholar]
- 56. Schmatz M, Madan J, Marino T, Davis J. Maternal obesity: the interplay between inflammation, mother and fetus. J Perinatol 30: 441–446, 2010 [DOI] [PubMed] [Google Scholar]
- 57. Schmidt D, Wilson MD, Spyrou C, Brown GD, Hadfield J, Odom DT. ChIP-seq: using high-throughput sequencing to discover protein-DNA interactions. Methods 48: 240–248, 2009 [DOI] [PMC free article] [PubMed] [Google Scholar]
- 58. Shankar K, Harrell A, Kang P, Singhal R, Ronis MJ, Badger TM. Carbohydrate-responsive gene expression in the adipose tissue of rats. Endocrinology 151: 153–164, 2010 [DOI] [PubMed] [Google Scholar]
- 59. Shankar K, Harrell A, Liu X, Gilchrist JM, Ronis MJ, Badger TM. Maternal obesity at conception programs obesity in the offspring. Am J Physiol Regul Integr Comp Physiol 294: R528–R538, 2008 [DOI] [PubMed] [Google Scholar]
- 60. Shankar K, Hidestrand M, Liu X, Xiao R, Skinner CM, Simmen FA, Badger TM, Ronis MJ. Physiologic and genomic analyses of nutrition-ethanol interactions during gestation: Implications for fetal ethanol toxicity. Exp Biol Med (Maywood) 231: 1379–1397, 2006 [DOI] [PubMed] [Google Scholar]
- 61. Shankar K, Kang P, Harrell A, Zhong Y, Marecki JC, Ronis MJ, Badger TM. Maternal overweight programs insulin and adiponectin signaling in the offspring. Endocrinology 151: 2577–2589, 2010 [DOI] [PMC free article] [PubMed] [Google Scholar]
- 62. Shankar K, Zhong Y, Kang P, Lau F, Blackburn ML, Chen JR, Borengasser SJ, Ronis MJ, Badger TM. Maternal obesity promotes a proinflammatory signature in rat uterus and blastocyst. Endocrinology 152: 4158–4170, 2011 [DOI] [PMC free article] [PubMed] [Google Scholar]
- 63. Shen N, Yu X, Pan FY, Gao X, Xue B, Li CJ. An early response transcription factor, Egr-1, enhances insulin resistance in type 2 diabetes with chronic hyperinsulinism. J Biol Chem 286: 14508–14515, 2011 [DOI] [PMC free article] [PubMed] [Google Scholar]
- 64. Son SW, Min BW, Lim Y, Lee YH, Shin SY. Regulatory mechanism of TNFalpha autoregulation in HaCaT cells: the role of the transcription factor EGR-1. Biochem Biophys Res Commun 374: 777–782, 2008 [DOI] [PubMed] [Google Scholar]
- 65. Strakovsky RS, Zhang X, Zhou D, Pan YX. Gestational high fat diet programs hepatic phosphoenolpyruvate carboxykinase gene expression and histone modification in neonatal offspring rats. J Physiol 589: 2707–2717, 2011 [DOI] [PMC free article] [PubMed] [Google Scholar]
- 66. Stryjecki C, Mutch DM. Fatty acid-gene interactions, adipokines and obesity. Eur J Clin Nutr 65: 285–297, 2011 [DOI] [PubMed] [Google Scholar]
- 67. Su Y, Shankar K, Simmen RC. Early soy exposure via maternal diet regulates rat mammary epithelial differentiation by paracrine signaling from stromal adipocytes. J Nutr 139: 945–951, 2009 [DOI] [PubMed] [Google Scholar]
- 68. Subramanian A, Tamayo P, Mootha VK, Mukherjee S, Ebert BL, Gillette MA, Paulovich A, Pomeroy SL, Golub TR, Lander ES, Mesirov JP. Gene set enrichment analysis: a knowledge-based approach for interpreting genome-wide expression profiles. Proc Natl Acad Sci USA 102: 15545–15550, 2005 [DOI] [PMC free article] [PubMed] [Google Scholar]
- 69. Suganami T, Nishida J, Ogawa Y. A paracrine loop between adipocytes and macrophages aggravates inflammatory changes: role of free fatty acids and tumor necrosis factor alpha. Arterioscler Thromb Vasc Biol 25: 2062–2068, 2005 [DOI] [PubMed] [Google Scholar]
- 70. Suganami T, Yuan X, Shimoda Y, Uchio-Yamada K, Nakagawa N, Shirakawa I, Usami T, Tsukahara T, Nakayama K, Miyamoto Y, Yasuda K, Matsuda J, Kamei Y, Kitajima S, Ogawa Y. Activating transcription factor 3 constitutes a negative feedback mechanism that attenuates saturated Fatty acid/toll-like receptor 4 signaling and macrophage activation in obese adipose tissue. Circ Res 105: 25–32, 2009 [DOI] [PubMed] [Google Scholar]
- 71. Tamashiro KL, Moran TH. Perinatal environment and its influences on metabolic programming of offspring. Physiol Behav 100: 560–566, 2010 [DOI] [PMC free article] [PubMed] [Google Scholar]
- 72. Thornburg KL, O'Tierney PF, Louey S. Review: The placenta is a programming agent for cardiovascular disease. Placenta 31 Suppl: S54–S59, 2010 [DOI] [PMC free article] [PubMed] [Google Scholar]
- 73. Tsai EY, Falvo JV, Tsytsykova AV, Barczak AK, Reimold AM, Glimcher LH, Fenton MJ, Gordon DC, Dunn IF, Goldfeld AE. A lipopolysaccharide-specific enhancer complex involving Ets, Elk-1, Sp1, and CREB binding protein and p300 is recruited to the tumor necrosis factor alpha promoter in vivo. Mol Cell Biol 20: 6084–6094, 2000 [DOI] [PMC free article] [PubMed] [Google Scholar]
- 74. Varastehpour A, Radaelli T, Minium J, Ortega H, Herrera E, Catalano P, Hauguel-de Mouzon S. Activation of phospholipase A2 is associated with generation of placental lipid signals and fetal obesity. J Clin Endocrinol Metab 91: 248–255, 2006 [DOI] [PubMed] [Google Scholar]
- 75. Velkoska E, Morris MJ. Mechanisms behind early life nutrition and adult disease outcome. World J Diabetes 2: 127–132, 2011 [DOI] [PMC free article] [PubMed] [Google Scholar]
- 76. Wu LL, Norman RJ, Robker RL. The impact of obesity on oocytes: evidence for lipotoxicity mechanisms. Reprod Fertil Dev 24: 29–34, 2011 [DOI] [PubMed] [Google Scholar]
- 77. Yao J, Mackman N, Edgington TS, Fan ST. Lipopolysaccharide induction of the tumor necrosis factor-alpha promoter in human monocytic cells. Regulation by Egr-1, c-Jun, and NF-kappaB transcription factors. J Biol Chem 272: 17795–17801, 1997 [DOI] [PubMed] [Google Scholar]
- 78. Zanardo V, Vedovato S, Suppiej A, Trevisanuto D, Migliore M, Di Venosa B, Chiarelli S. Histological inflammatory responses in the placenta and early neonatal brain injury. Pediatr Dev Pathol 11: 350–354, 2008 [DOI] [PubMed] [Google Scholar]
- 79. Zhang Y, Liu T, Meyer CA, Eeckhoute J, Johnson DS, Bernstein BE, Nusbaum C, Myers RM, Brown M, Li W, Liu XS. Model-based analysis of ChIP-Seq (MACS). Genome Biol 9: R137, 2008 [DOI] [PMC free article] [PubMed] [Google Scholar]
- 80. Zhu MJ, Du M, Nathanielsz PW, Ford SP. Maternal obesity up-regulates inflammatory signaling pathways and enhances cytokine expression in the mid-gestation sheep placenta. Placenta 31: 387–391, 2010 [DOI] [PubMed] [Google Scholar]
- 81. Zhu MJ, Ma Y, Long NM, Du M, Ford SP. Maternal obesity markedly increases placental fatty acid transporter expression and fetal blood triglycerides at midgestation in the ewe. Am J Physiol Regul Integr Comp Physiol 299: R1224–R1231, 2010 [DOI] [PMC free article] [PubMed] [Google Scholar]