

Abstract
We have developed a whole kidney model of the urine concentrating mechanism and renal autoregulation. The model represents the tubuloglomerular feedback (TGF) and myogenic mechanisms, which together affect the resistance of the afferent arteriole and thus glomerular filtration rate. TGF is activated by fluctuations in macula densa [Cl−] and the myogefnic mechanism by changes in hydrostatic pressure. The model was used to investigate the relative contributions of medullary blood flow autoregulation and inhibition of transport in the proximal convoluted tubule to pressure natriuresis in both diuresis and antidiuresis. The model predicts that medullary blood flow autoregulation, which only affects the interstitial solute composition in the model, has negligible influence on the rate of NaCl excretion. However, it exerts a significant effect on urine flow, particularly in the antidiuretic kidney. This suggests that interstitial washout has significant implications for the maintenance of hydration status but little direct bearing on salt excretion, and that medullary blood flow may only play a signaling role for stimulating a pressure-natriuresis response. Inhibited reabsorption in the model proximal convoluted tubule is capable of driving pressure natriuresis when the known actions of vasopressin on the collecting duct epithelium are taken into account.
Keywords: kidney, salt excretion, autoregulation, medullary blood flow, urine concentration
acute elevation of renal perfusion pressure produces large increases in NaCl excretion in volume-expanded animals (1, 16, 45, 63, 84). Antidiuretic animals exhibit a similar response but with a significantly diminished magnitude (33, 34, 82). Natriuresis can also occur without elevations in renal perfusion pressure (9, 10, 25).
A substantial body of evidence suggests that pressure natriuresis is driven, at least in part, by elevated renal interstitial hydrostatic pressure (RIHP) (22, 36, 37). Increased RIHP is linked to elevated medullary blood flow (MBF), which is in turn modulated by vasopressin (23). This may explain why the magnitude of the pressure natriuresis depends on hydration status. However, the mechanisms that cause salt excretion to be sensitive to RIHP and MBF remain insufficiently well characterized.
Renal decapsulation reduces RIHP and significantly diminishes (but does not eliminate) pressure natriuresis (34, 37, 44, 48). Experimental evidence suggests that MBF has a negligible direct effect on salt and water reabsorption in the loop of Henle and the collecting duct (CD) (21, 28, 85). Instead, it has been proposed that elevated MBF initiates signals that mediate pressure-natriuretic responses (21). This signaling cascade includes the inhibition of sodium reabsorption in the proximal convoluted tubule (PCT) (67, 79). This inhibition can be partially countered by infusion of angiotensin II (62, 66, 103). Here we restrict our consideration to the direct effects of elevated MBF on the medullary interstitium (and, therefore, on reabsorption in the loop of Henle, the vasa recta, and the CD) and of inhibited sodium reabsorption in the PCT.
Both elevated MBF and inhibited PCT sodium reabsorption can affect urine flow and NaCl concentration. It remains unclear whether the direct effects of MBF on the interstitium are entirely irrelevant to the pressure natriuresis response and whether the inhibition of NaCl reabsorption in the PCT is sufficient to elevate NaCl excretion to levels observed in volume-expanded animals. To date, there is no experimental technique that allows MBF to be controlled independently of hydration status, meaning that experimental investigations cannot easily address this question. Furthermore, a recent study of a detailed whole kidney model highlighted the importance of the pressure-sensitive inhibition of PCT sodium reabsorption for predicting whole kidney water and NaCl excretion rates but provided only a cursory treatment of the matter (68).
We present a mathematical model of water and NaCl excretion that can independently regulate MBF, glomerular filtration, and proximal tubule NaCl reabsorption. By studying how model excretion rates are affected by MBF and PCT reabsorption, we identify the key factors responsible for driving pressure natriuresis in the model. We show that the model can reproduce acute renal function curves measured in both antidiuretic and volume-expanded rats. We then evaluate whether the differences in model parameters between the antidiuretic and volume-expanded cases offer a plausible explanation for the different magnitudes of pressure natriuresis that are observed in vivo in volume-expanded and volume-depleted animals.
METHODS
The model comprises an existing medullary model of the urine concentrating mechanism that encompasses the tubular and vascular architecture of both the outer and inner medulla (55), a glomerular model that encompasses the afferent and efferent arterioles and the glomerular capillary bed, a model of the myogenic and tubuloglomerular feedback (TGF) responses that regulate afferent blood flow, a PCT segment that exhibits pressure-dependent reabsorption of the filtered load, and a cortical thick ascending limb (cTAL) segment that predicts macula densa delivery, providing the input signal for the TGF response. The model structure is shown in Fig. 1.
Fig. 1.
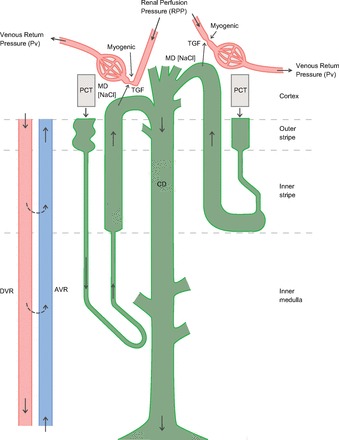
An overview of the vascular and tubular structure of the model. Only 1 short and 1 long loop of Henle are depicted, whereas the model represents one short loop and as many long loops as there are numerical grid points in the inner medulla (IM). The inner medullary collecting ducts (CDs) undergo successive coalescences. MD, macula densa; TGF, tubuloglomerular feedback; PCT, proximal convoluted tubule; DVR, descending vasa recta; AVR, ascending vasa recta.
Renal blood flow and glomerular filtration.
The glomerular model comprises the afferent and efferent arterioles and a glomerular capillary bed. The net pressure drop across the vasculature is determined by the renal perfusion pressure (PRPP) and the venous return pressure (Pv = 3.75 mmHg). Afferent arteriolar resistance (RAff) is determined by the combined activation of the TGF and myogenic responses, based on the model of Feldberg et al. (30). The activation of these responses varies along the length of the afferent arteriole, where x = 0 is the start of the arteriole and x = 1 is the entry to the glomerulus. The model represents TGF as a sigmoidal response (shown in Fig. 2) whose activation (ΨTGF) is determined by the macula densa Cl− concentration (CCl, mM) and the TGF-operating point (COp, mM):
| (1) |
This activation is assumed to decrease linearly with increasing distance from the glomerulus (x = 1), disappearing at x = 0.9:
| (2) |
Fig. 2.
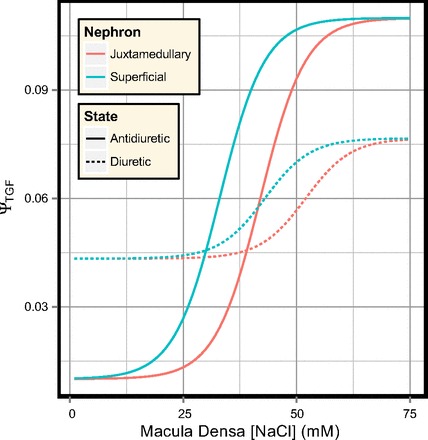
TGF response for the superficial and juxtamedullary nephrons.
Experimental data suggest that the relationship between transmural pressure (across the afferent arteriole wall) and the activation of the myogenic response is nearly linear (30). Accordingly, we assume the activation of the myogenic response (ΨMYO) is a linear function of the transmural pressure (P):
| (3) |
The values of PMIN and PMAX were derived from experimental measurements (26). The net activation of the smooth muscle is assumed to be the sum of the two responses:
| (4) |
By treating the wall of the afferent arteriole as rings of smooth muscle and applying Laplace's law (as per Feldberg et al. 30), the transmural pressure P can be written in the form:
| (5) |
where ρi and ρo are the inner and outer radii of the vessel wall when the transmural pressure P = 0, ri and ro are the inner and outer radii of the vessel wall for the transmural pressure P, and σ is the idealized stress of the vascular smooth muscle. This stress comprises passive stress (σe) due to the elastic elements of the wall and active stress (σa) due to the contraction of the vascular smooth muscle:
| (6) |
| (7) |
| (8) |
| (9) |
where C1, C2, α1, α2 are constants, estimated experimentally (20). The common strain ε represents the shortening or lengthening of the elastic and collagen fibers in the vessel wall, and εw is the working range of the overlap between the myosin and actin filaments (30).
We model the afferent arteriole as a sequence of n = 100 vascular smooth muscle segments. The resistance of each segment (Rj) was approximated using Poiseuille's law and the inner radius of the segment (ri):
| (10) |
where k is a constant that depends on blood viscosity and n is the number of segments. The transmural pressure at the mid-point of each segment was approximated by distributing the pressure drop across the afferent arteriole in proportion to each segment resistance:
| (11) |
| (12) |
| (13) |
where P0 and PG(0) are the hydrostatic pressures at the beginning and end of the arteriole. The initial hydrostatic pressure was defined on the basis that the afferent arteriole is preceded by several levels of renal vasculature. The regulatory range of the model myogenic response is 65 ≤ P0 ≤ 120 mmHg. By assuming that the renal perfusion pressure (RPP) is reduced by one-third before reaching the afferent arteriole, the myogenic response provides efficient autoregulation of renal blood flow (RBF) for 100 ≤ 180 mmHg. This autoregulatory range is consistent with experimental measurements of glomerular filtration rate (GFR) and RBF. The afferent blood flow is determined by the net afferent resistance and the pressure drop across the arteriole:
| (14) |
The single-nephron glomerular filtration rate (SNGFR) and efferent blood flow are then calculated by integrating flow and pressure equations along the glomerular capillary bed (0 ≤ x ≤ 1):
| (15) |
| (16) |
| (17) |
| (18) |
| (19) |
| (20) |
| (21) |
| (22) |
To solve these equations and determine the renal blood flow and GFR, the inner radius of each afferent arteriole segment and the initial glomerular pressure PG(0) must be determined. This is achieved with an iterative scheme. Initially, the radius of each segment is set to ρi. The resistance of each segment and of the entire arteriole are calculated Eqs. 10 and 11. PG(0) is then approximated iteratively such that solving Eqs. 14–22 satisfies:
| (23) |
The hydrostatic pressure profile along the afferent arteriole can then be calculated using (13). The myogenic activation ΨMYO(x) is then updated and the inner radius of each segment is calculated to satisfy (5). These steps are repeated until the relative change in radius per iteration is <10−8 for every segment.
Medullary model.
The medullary portion of the model is based on a model that has previously been used to investigate the role that the vascular architecture in the inner medulla (IM) plays in the process of urine concentration (55). The model incorporates recent experimental findings on the relative positions of the tubules and vasa recta, as well as their transport properties (49, 73, 104), and explicitly represents short and long loops of Henle, ascending and descending vasa recta, and a composite CD. Short loops turn at the outer medulla (OM)-IM boundary, while long loops turn at every depth of the IM. Model descending vasa recta (DVR) terminate at every depth of the entire medulla. The model encompasses three solutes: NaCl, urea, and a nonreabsorbable solute that represents all solutes that are neither reabsorbed nor secreted along the nephron tubule and CD. The model predicts fluid flow, solute concentrations, and transepithelial fluxes along each tubule and vessel at every depth of the medulla, and the interstitial solute concentrations for each region. Parameter values for the medullary model can be found in Layton et al. (55).
Cortical tubule segments and delivery to the collecting duct.
The model admits three cortical tubule segments. Reabsorption in the proximal and distal convoluted tubules is controlled by fractional delivery coefficients. The cTAL is represented as an explicit epithelium and is used to determine the macula densa NaCl concentration.
Fractional delivery of NaCl (and, therefore, water) from the PCT to the proximal straight tubule (PST) is a sigmoidal function of the renal perfusion pressure, as defined by Eqs. 24 and 25 and shown in Fig. 3. When RRPP = 100 mmHg the PCT fractional delivery is 1/3.
| (24) |
| (25) |
Fig. 3.
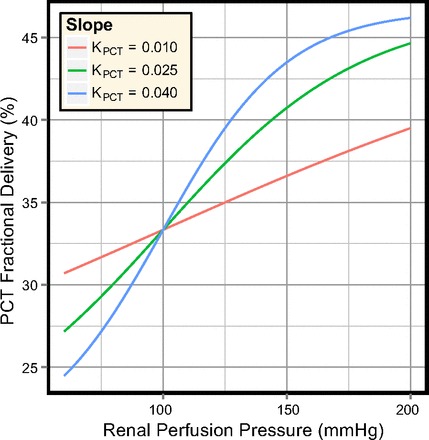
Fractional delivery in the PCT segment for several values of the slope (KPCT), shown for the range of perfusion pressures used in the model simulations.
The cortical ascending limbs are represented as explicit epithelia (parameter values are listed in Table 1), and the macula densa NaCl concentration is assumed to be that of the cTAL outflow. The epithelial properties of this segment are identical to those of the outer-medullary ascending limb. The segment is 3-mm long for superficial nephrons and 1-mm long for juxtamedullary nephrons.
Table 1.
cTAL parameters for each nephron
| Parameter | Superficial | Juxtamedullary | |
|---|---|---|---|
| LcTAL | 3 mm | 1 mm | |
| Radius | 10 μm | ||
| Pf | 0 cm/s | ||
| PNa | 1 × 10⁻⁵ cm/s | ||
| PUr | 0.5 × 10⁻⁵ cm/s | ||
| Km | 70 mM | ||
| Vmax | 12.5 nmol/cm2s | 25.9 nmol/cm2s |
cTAL, cortical thick ascending limb; see text for additional definitions.
The outer medullary collecting duct (OMCD) delivery is calculated from the outflow of the cortical thick ascending limbs (i.e., the flow at the macula densa) of each nephron (26). The fractional delivery coefficients are listed in Table 2, and the urea concentration is calculated such that the fluid entering the OMCD is isosmotic to blood plasma (307 mosmol/kgH2O). The delivery to a single OMCD is weighted by the ratio of superficial to juxtamedullary nephrons and scaled to respect the 6.1:1 ratio of nephrons to CDs (51):
| (26) |
Table 2.
Hydration-dependent parameter values
| Parameter | Antidiuretic | Diuretic |
|---|---|---|
| ΨMIN | 0.01 | 0.0433 |
| ΨMAX | 0.11 | 0.0767 |
| COp (superficial) | 33 mM | 43 mM |
| COp (juxtamedullary) | 42 mM | 52 mM |
| FDDCT(V) | 16.5% | 36.4% |
| FDDCT(Na) | 11.0% | 32.2% |
| OMCD Pf | 463 × 10−5 cm/s | 23.15 × 10⁻⁵ cm/s |
| IMCD(x) Pf | 750 × 10−4 cm/s | (6 −3.5 · x/L)−1 · 750 × 10−4 cm/s |
| IMCD PUr | 110 × 10−5 cm/s | 46 × 10−5 cm/s |
OMCD, outer medullary collecting duct; IMCD, inner medullary collecting duct; see text for additional definitions.
The DVR inflow has a reference value of 8 nl/min (as per the original boundary conditions; Ref. 55) and varies as a linear function of renal perfusion pressure:
| (27) |
Hydration status and epithelial properties.
Model parameters from Ref. 55 are used to predict water and salt excretion in antidiuresis. To simulate diuresis, we adjusted the epithelial properties of the CD and the fractional reabsorption parameters for the distal convoluted tubule (DCT) to reflect the change in hydration status. The antidiuretic hormone (ADH) concentration is assumed to decrease sufficiently that the CD water permeability and inner medullary collecting duct (IMCD) urea permeability are minimal (see Table 2).
The DCT fractional reabsorption coefficients were adjusted so that the OMCD inflow was increased from 6.5 to 15.0 nl/min (per individual OMCD), assuming the DCT tubular fluid/plasma ratio inulin ratio is ∼9 (2) and that no water reabsorption occurs along the cortical collecting duct. Water permeabilities of the OMCD, initial IMCD, and terminal IMCD were reduced by factors of 20, 6, and 2.5, respectively (89), and urea permeability of the terminal IMCD was reduced from 110 × 10−5 to 46 × 10−5 cm/s (89).
The TGF gain was also reduced by a factor of 3 in the diuretic model, and the TGF operating points for the superficial and juxtaglomerular nephrons were increased by 10 mM (Table 2). The other glomerular parameters are not hydration-dependent (see Table 3).
Table 3.
Glomerular parameters
| Parameter | Units | Value |
|---|---|---|
| ρo | μm | 13 ↘ 11.7 |
| ρi | μm | 10 ↘ 9 |
| h | — | 0.45 |
| Kf | nl·min−1·mmHg−1 | 1.6*/1.9† |
| KTGF | mM−1 | 0.2 |
| PBS | mmHg | 15 |
| PV | mmHg | 3.75 |
| REff | mmHg·min·nl−1 | 0.4 |
| RG | mmHg·min·nl−1 | 0.001 |
| K0 | — | 3/15 |
| K1 | — | 7/15 |
| KOp | mmHg | 100 |
| PMIN | mmHg | 42.3 |
| PMAX | mmHg | 86.7 |
| C1 | mmHg | 20.25 |
| α1 | — | 2.0 |
| C2 | mmHg | 1.88 |
| α2 | — | 12.0 |
| σMAX | mmHg | 750 |
| ϵMAX | — | 0.25 |
| ϵw | — | 0.9 |
| k | mmHg·min·μm | 9.406 |
| n | — | 100 |
↘, Decreases linearly. See text for other definitions.
Superficial;
juxtamedullary.
Regulation of water and salt excretion.
The parameters of interest for exploring how the model regulates water and salt excretion, with regards to renal perfusion pressure, are the slopes of the MBF autoregulatory curve and the pressure-sensitive inhibition of sodium reabsorption in the PCT (hereafter referred to as the “PCT response”):
KMBF: MBF is well-regulated in antidiuretic rats and poorly regulated in volume expanded rats. ADH presumably plays a significant role since it varies in response to hydration status and has a vasoconstrictive effect on the DVR. If KMBF = 0, MBF (see Eq. 27) is perfectly autoregulated. As KMBF increases, MBF autoregulation decreases.
KPCT: the response is amplified in volume-expanded rats and diminished in antidiuretic rats and is believed to be mediated (at least in part) by the medullary interstitial hydrostatic pressure (which may be sensitive to ADH). Angiotensin II also has an significant effect on PCT reabsorption. The value of KPCT (see Eq. 24) is the maximal slope of the response.
In particular, the interaction between these two mechanisms and the combined effect they exert on NaCl excretion are the critical determinants of the pressure-natriuresis response of the model.
RESULTS
Adult rats are consistently observed to have GFRs of around 1.0 ml·min−1·g kidney weight−1 (kwt) and whole body GFRs in the range of 2.3–3.0 ml/min (Table 4). Within the autoregulatory range, the model whole body GFR is 2.43 ml/min (assuming that a rat kidney contains 38,000 nephrons; Ref. 99), suggesting the model “single kidney weight” is 1.2 g kwt. To report solute and volume excretion rates in units consistent with experimental studies (μeq·min−1·g kwt−1 and μl·min−1·g kwt−1, respectively), the IMCD volume and solute outflow rates were scaled by 38,000/(1.2·6.1) under the assumptions that a rat kidney contains 38,000 nephrons (99), that the model represents a single kidney of 1.2 g kwt, and that the ratio of nephrons to individual CDs in the model is 6.1:1 (51, 55).
Table 4.
Comparison of the antidiuretic model to in vivo measurements of whole body GFR in the rat
| Weight, g | GFR, ml·min−1·g kwt−1 | Kidneys, g | GFR, ml/min | |
|---|---|---|---|---|
| Model (32 × 103 nephrons) (8) | ≈2.05* | 2.05 | ||
| Model (38 × 103 nephrons (99) | ≈2.43* | 2.43 | ||
| Sprague-Dawley (male) (81) | 1.0 | 2.54 | 2.54 | |
| Sprague-Dawley (male) (79) | 225–300 | 1.03 | 2.92 | 3.01 |
| Dahl (female) (83) | 235 | 1.0 | 2.30 | 2.30 |
| Sprague-Dawley (male) (38) | 150 | 1.2 | ||
| Sprague-Dawley (male) (56) | 0.9 | |||
| Sprague-Dawley (male) (58) | 1.0–1.2 | |||
| Munich-Wistar (60) | 200–250 | 1.2 | ||
| Charles River (male, hydropenic) (7) | 320–350 | 3.00 | ||
| Sprague-Dawley (male) (103) | 170–230 | 1.0–1.4 |
Evaluated within the autoregulatory range of the model, where n is the assumed number of nephrons in a single rat kidney; g kwt, kidney weight in grams. Numbers in parenthesis indicate reference numbers.
Calculated by assuming glomerular filtration rate (GFR) ≈ 1.0 ml·min−1·g kwt−1.
Volume and solute transport along portions of individual tubule segments are reported with respect to the medullary depth, where 0 mm refers to the corticomedullary boundary and 7 mm to the papillary tip. Cortical segments are reported with negative depths, from the corticomedullary boundary (0 mm) to macula densa (−1 and −3 mm for the juxtamedullary and superficial cTAL, respectively).
Base case (antidiuresis).
Water and solute flows in the longest loop of Henle, vasa recta, CD, and aggregate superficial/juxtamedullary cTAL segments are shown in Fig. 4. Solute concentrations and osmolalities are shown in Fig. 5. Urine flow and composition are summarized in Table 5. The vast majority of water reabsorption in the descending limbs occurs in the OM. Together the ascending limb segments reabsorb one-half of the NaCl load, the bulk of which is reabsorbed in the OM. Net reabsorption (5–7 mm) and net secretion (2–5 mm) of NaCl both occur along the IM ascending thin limbs.
Fig. 4.
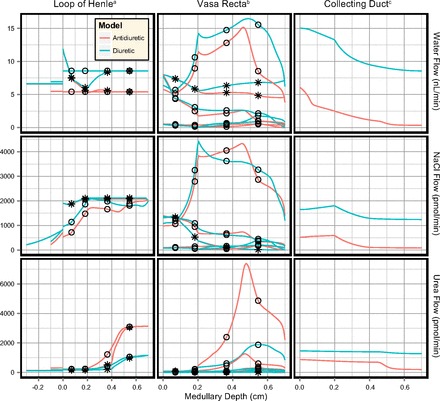
Water and solute flow in the antidiuretic and diuretic models (PRPP = 100 mmHg). Profiles are shown for the longest loop of Henle and longest vasa recta. Negative depths depict the cortical thick ascending limb (cTAL) segments of the superficial nephron (3 mm in length) and the aggregate juxtamedullary nephron population (1 mm in length). The cTAL profiles are discontinuous at x = 0 since they contain the aggregate flow of all superficial and juxtamedullary nephrons, respectively. ○Flow profiles in ascending limbs of Henle and AVR. *Flow profiles in descending limbs of Henle and DVR. aLoop of Henle flow is shown per nephron. bVasa recta flow is shown per individual DVR. cCD flow is shown per individual CD (6.1 nephrons).
Fig. 5.
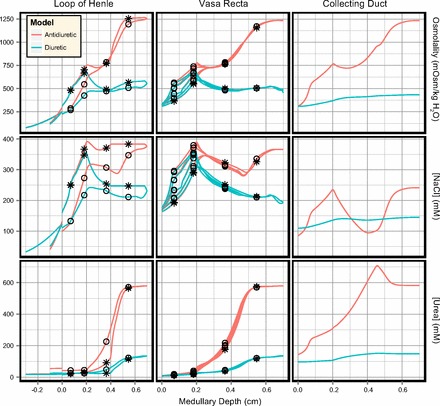
Solute concentration and osmolality profiles in the antidiuretic and diuretic models (PRPP = 100 mmHg). Profiles are shown as per Fig. 4. ○Concentration profiles in ascending limbs of Henle and AVR. *Concentration profiles in descending limbs of Henle and DVR.
Table 5.
Comparison of the model urine in antidiuretic and diuretic states when the perfusion pressure PRPP = 100 mmHg
| Quantity | Antidiuretic | Diuretic |
|---|---|---|
| Flow rate, nl·min−1·CD | 0.35 | 8.57 |
| Flow rate, ul·min−1·g kwt−1 | 1.82 | 44.49 |
| Osmolality, mosmol/kgH2O | 1233 | 434 |
| [NaCl], mM | 241 | 145 |
| [Urea], mM | 582 | 149 |
| NaCl excretion, ueq·min−1·g kwt−1 | 0.44 | 6.45 |
| Urea excretion, ueq·min−1·g kwt−1 | 1.05 | 6.62 |
CD, collecting duct.
Water is rapidly reabsorbed from the CD in the outer stripe. It is then reabsorbed at an approximately linear rate in the inner stripe and upper IM (0.4–4.5 mm). In the deep IM (5–7 mm), CD water reabsorption is enhanced due to the high IMCD urea permeability, and the bulk of the IMCD urea load is reabsorbed into the interstitium. In contrast, there is a small amount of NaCl secretion into the OMCD (where the thick limb active transport of NaCl is highest) and the bulk of the CD NaCl reabsorption occurs in the upper IMCD.
Base case (diuresis).
Key results for a diuretic kidney are shown in Figs. 4 and Fig. 5. Compared with the antidiuretic model, the descending limb of Henle and DVR inflow rates are unchanged and there is a similar degree of water reabsorption in the outer medullary descending limb segments. However, pronounced water secretion into the descending limbs in the IM increases the ascending limb water flow rates. In the IM there is significant NaCl secretion into the ascending limb of Henle, which enhances NaCl delivery to the OM and the cTAL segments. There is also significant water secretion into the DVR in the IM, resulting in papillary DVR flow rates 50% higher than in the antidiuretic model.
Volume delivery to the OMCD in the diuretic model is assumed to be elevated in the diuretic model (6.1 vs. 15.0 nl/min). This results in a much larger load on the urine concentrating mechanism. Combined with the diminished CD water permeability, CD volume reabsorption is greatly reduced. CD fractional water reabsorption decreased from 94 to 43% in the diuretic model. Increased OMCD delivery and diminished CD water reabsorption result in higher NaCl and urea flow rates along the entirety of the CD, although the profiles for both solutes are similar in shape to those observed in the antidiuretic model. Urea reabsorption in the terminal IMCD is diminished due to the lowered IMCD urea permeability, reducing the quantity of urea available for recycling in the IM. CD fractional reabsorption of both NaCl and urea are significantly decreased in the diuretic model, from 84 to 25% (NaCl) and 77 to 13% (urea), even though the absolute water and NaCl reabsorption rates are slightly higher in the diuretic model.
The increased OMCD delivery, decreased urea recycling, and decreased water reabsorption along the medullary CD produce a 25-fold increase in urine flow rate, a 65% decrease in urine osmolality, a 15-fold increase in NaCl excretion, and a 6.3-fold increase in urea excretion, relative to the antidiuretic model (summarized in Table 5).
Medullary blood flow autoregulation in antidiuresis.
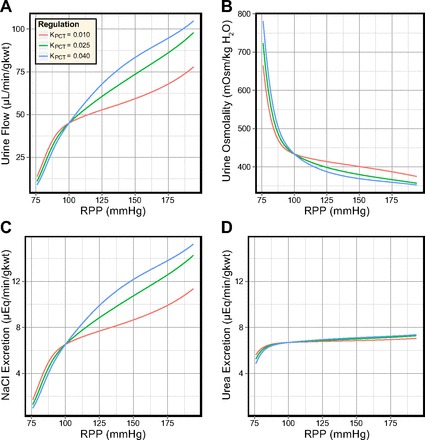
Simulations were conducted for several values of KMBF, 0, 0.005, 0.010, and 0.015 nl·min−1·mmHg−1 to determine the sensitivity of the model excretion rates to MBF. For each simulation, the PCT response was fixed (KPCT = 0.025) and renal perfusion pressure was incremented from 76 to 194 mmHg. Model SNGFR was well regulated except for PRPP ≤90 mmHg, where it was significantly diminished. Superficial SNGFR was otherwise maintained between 29 and 33 nl/min and juxtamedullary SNGFR between 35 and 39 nl/min. The urine volume, osmolality and solute concentrations produced by the model for each value of KMBF are shown in Fig. 6.
Fig. 6.
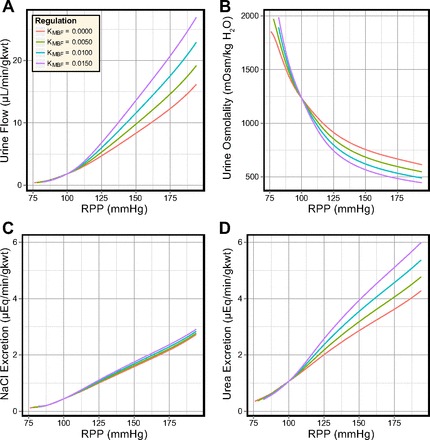
Effects of different degrees of medullary blood flow (MBF) autoregulation in the antidiuretic model. In response to elevated perfusion pressure: urine flow increases 6- to 12-fold (A); urine osmolality decreases by ∼60% (B); NaCl excretion increases 5- to 6-fold (C); and urea excretion increases 4- to 6-fold (D).
Urine flow rate and solute excretion rates increased in proportion to the slope of the MBF curve (KMBF), while urine osmolality exhibited an inverse relationship to KMBF. When renal perfusion pressure was increased from 100 to 200 mmHg, urine flow rate increased by 9–15-fold (depending on KMBF), urine osmolality decreased by 50–64%, NaCl excretion increased by 620–660%, and urea excretion increased by 400–560%. Urine flow rate, osmolality, and urea excretion rate are all sensitive to KMBF. In contrast, NaCl excretion exhibits almost complete insensitivity to KMBF and varied by only 7% at PRPP = 200 mmHg.
Two benchmark values of KMBF, 0 and 0.0125, correspond to perfect autoregulation as observed in volume-depleted rats and to weak autoregulation as observed in volume-expanded rats (33, 65). A comparison of flow and solute concentration profiles for these benchmark values (at PRPP = 140 mmHg) reveals that the increased DVR inflow (from 8 to 12 nl/min) elevated DVR flow. This increased fluid delivery to the IM washed out the IM axial solute gradient. As a result, DVR osmolality was reduced by 150 mosmol/kgH2O at the papillary tip and urine osmolality fell from 805 to 645 mosmol/kgH2O.
In the antidiuretic model, the degree of MBF autoregulation exerts significant control over urine flow rate, osmolality, and urea excretion rate, while the NaCl excretion rate is almost completely insensitive to elevated MBF.
Medullary blood flow autoregulation in diuresis.
Similar to the antidiuretic model, increased KMBF in the diuretic model elevates urine flow rate and urea excretion rate, and decreases urine osmolality (see Fig. 7). The rate of NaCl excretion remained highly insensitive to KMBF but, in contrast to the antidiuretic model, varied inversely to changes in KMBF. Comparing the urine at PRPP = 100 and 200 mmHg shows that the relative increases in excretion rates and the decrease in urine osmolality are significantly smaller in the diuretic model than in the antidiuretic model. For example, NaCl excretion varied by only 3.4% at the maximal perfusion pressure (194 mmHg).
Fig. 7.
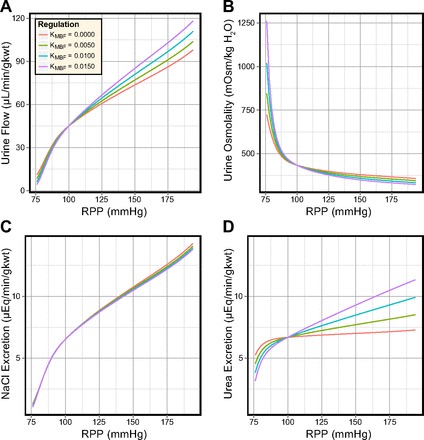
Effects of different degrees of MBF autoregulation in the diuretic model. In response to elevated perfusion pressure: urine flow increases 2-fold (A); urine osmolality decreases by around 25% (B); NaCl excretion increases 2-fold (C); and urea excretion increases by 10–70% (D).
The decrease in NaCl excretion as KMBF increases is due to the large difference in baseline urine flow rate. In the antidiuretic and diuretic models, urine NaCl concentrations are comparable. At PRPP = 140 mmHg in the antidiuretic model, increased MBF elevates urine flow by 3.9 μl·min−1·g kwt−1, a relative change of 58%. In the diuretic model, the same increase in MBF elevates urine flow by 7.5 μl·min−1·g kwt−1, a relative change of 11%.
In the diuretic model, volume expansion significantly diminishes the sensitivity of the urine flow rate, osmolality, and solute excretion rates to the degree of MBF autoregulation. The additional washout caused by the increased MBF has only a minimal effect on the model urine.
PCT response in antidiuresis.
In these simulations, DVR inflow was fixed at 8 nl/min and the slope of the PCT response (KPCT) was set to 0.010, 0.025, and 0.040. The values represent diminished, normal, and elevated PCT transport inhibition and affect the PST inflow rates at the corticomedullary boundary. Model urine volume and composition are shown in Fig. 8. Model SNGFR was well regulated and did not differ significantly from the simulations where KMBF was varied.
Fig. 8.
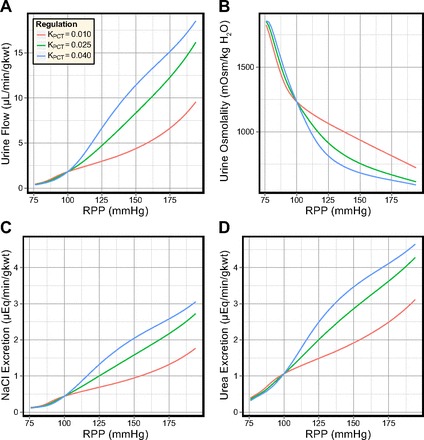
Effects of different degrees of transport inhibition in the PCT in the antidiuretic model. In response to elevated perfusion pressure: urine flow is significantly regulated by the PCT response (A); urine osmolality is significantly regulated by the PCT response (B); NaCl excretion is significantly regulated by the PCT response (C); and urea excretion is significantly regulated by the PCT response (D).
Increasing KPCT from 0.010 to 0.025 greatly increased the sensitivity of the urine flow rate, osmolality, and solute excretion rates to the renal perfusion pressure. Increasing KPCT further to 0.040 had a similar additional effect.
When PRPP was raised from 100 to 194 mmHg, urine flow rate increased 5- to 10-fold, urine osmolality decreased by 41–52%, NaCl excretion increased 4–7-fold, and urea excretion increased by 290–440%. Comparing the antidiuretic model sensitivity to changes in KMBF and KPCT, the most significant difference is that the NaCl excretion rate is much more sensitive to KPCT than to KMBF.
The increased PST delivery caused by increases in KPCT led to elevated CD volume delivery. At PRPP = 140 mmHg, CD fractional volume reabsorption was diminished from 90% (KPCT = 0.010) to 84.5% (KPCT = 0.025) and 80% (KPCT = 0.040). However, net CD volume reabsorption was increased from 6.52 to 7.11 and 7.47 nl·min−1·CD−1. The difference in urine flow rate for these values of KPCT was 4.9 μl·min−1·g kwt−1, which was smaller than the difference in OMCD delivery (9.1 μl·min−1·g kwt−1). The increased CD volume delivery also reduced the solute concentrations along the CD and reduced urine osmolality from 986 to 805 and 718 mosmol/kgH2O. Urine NaCl and urea concentrations varied by 38 and 138 mM as a result of the variations in KPCT. In contrast, varying KMBF produced near-identical changes in urine NaCl and urea concentration.
In the antidiuretic model, the slope of the PCT response exerted significant influence on urine flow rate, osmolality, and solute excretion rates. However, elevated MBF produced larger pressure-sensitive variations in urine flow rate, osmolality, and urea excretion rate (compare Fig. 6 to Fig. 8).
PCT response in diuresis.
Variations in the PCT response in the diuretic model are shown in Fig. 9, for the same range of KPCT values. Urine flow rate and NaCl excretion are significantly elevated (≈10-fold) in the diuretic model, and the urine osmolality is significantly diminished. The most significant difference between the antidiuretic and diuretic model sensitivity to KPCT is urea excretion, which is highly sensitive to KPCT in the antidiuretic model and consistently exceeds the NaCl excretion rate. In the diuretic model, the urea excretion rate exhibits almost complete insensitivity to KPCT and varies by only 4% at PRPP = 194 mmHg. Urea excretion is also consistently lower than NaCl excretion in the diuretic model.
Fig. 9.
Effects of different degrees of transport inhibition in the PCT in the diuretic model. In response to elevated perfusion pressure: urine flow is significantly regulated by the PCT response (A); urine osmolality is somewhat regulated by the PCT response (B); NaCl excretion is significantly regulated by the PCT response (C); and urea excretion is insensitive to the PCT response (D).
We now compare flow rate and solute concentration profiles for the benchmark values of KPCT (0.010, 0.025, and 0.040) at PRPP = 140 mmHg. Increased PCT reabsorption inhibition elevated volume delivery to the descending limbs, which was not negated by an increase in volume reabsorption along the descending limbs. OMCD inflow rate was elevated in proportion to KPCT, from 17.3 (KPCT = 0.010) to 19.6 (KPCT = 0.025) and 21.4 nl·min−1·CD−1 (KPCT = 0.040). Fractional CD volume reabsorption decreased when KPCT was increased (from 38 to 33 and 30%) but absolute CD volume reabsorption remained fixed at 6.55 nl·min−1·CD−1. Urine NaCl concentration varied by <1 mM in response to KPCT, while urine urea concentration decreased by 30 mM. This decrease in urine urea concentration was almost exactly countered by the increase in urine flow rate, resulting in near-constant urea excretion.
In the diuretic model, variations in the slope of the PCT response produced smaller relative changes in urine flow rate, osmolality, and solute excretion rates than those in the antidiuretic model. Urea excretion was near constant, a result of the limited urea recycling in the IM in diuresis. The absolute increases in urine flow rate and NaCl excretion rate, in response to elevated perfusion pressure, were significantly larger in the diuretic model than in the antidiuretic model. The relative increase in these excretion rates were, however, smaller than in the antidiuretic model. This is consistent with the differences between the pressure natriuresis observed in the antidiuretic and the diuretic rat (33, 34, 82).
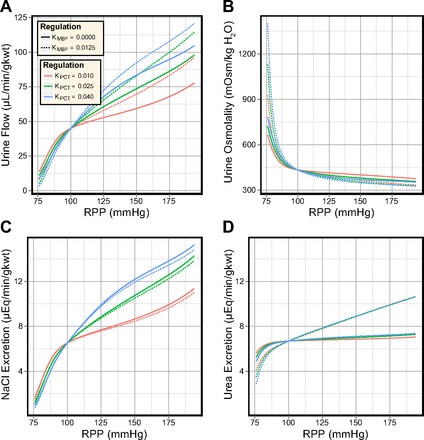
Combined regulation in antidiuresis.
The sensitivity of the model to simultaneous variations in both MBF and transport inhibition in the PCT was assessed (see Fig. 10). In the antidiuretic rat, MBF is as strongly autoregulated as the cortical blood flow (33, 65). This suggests that the curves for KMBF = 0 should be representative for the antidiuretic model. In the model, decreased MBF autoregulation elevated urine flow and urea excretion and diminished the urine osmolality, while having little effect on NaCl excretion. On the other hand, the PCT response played a dominant role in driving pressure natriuresis in the model, regardless of MBF autoregulation.
Fig. 10.
Effects of varying both the degree of MBF autoregulation and the degree of transport inhibition in the PCT in the antidiuretic model. In response to elevated perfusion pressure: urine flow is more sensitive to MBF autoregulation than to transport inhibition in the PCT (A); urine osmolality is more sensitive to MBF autoregulation than to transport inhibition in the PCT (B); NaCl excretion is more sensitive to transport inhibition in the PCT than to MBF autoregulation (C); urea excretion is more sensitive to MBF autoregulation than to transport inhibition in the PCT (D).
The increase in KMBF reduced urea secretion into the long descending limbs by 2–3%, while increasing KPCT reduced urea secretion by 13–20%. This suggests that MBF autoregulation has a lesser impact than the PCT response on urea recycling in the IM. Net volume reabsorption along the CD was significantly enhanced when MBF was strongly autoregulated, while the PCT response played a greater role in determining the OMCD inflow rate.
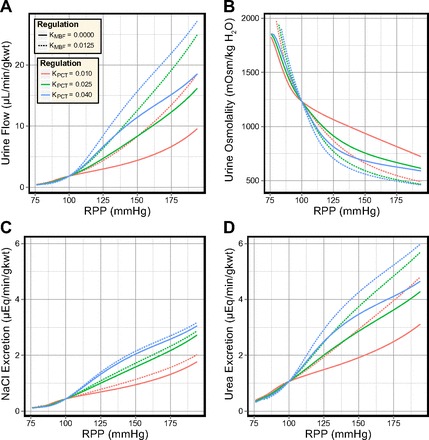
Combined regulation in diuresis.
In the diuretic model, PCT reabsorption inhibition and weak MBF autoregulation (as observed in volume-expanded rats) have synergistic effects. Urine flow rate was elevated and urine osmolality was decreased (see Fig. 11). Urea excretion exhibits no sensitivity to KPCT but was sensitive to MBF. Similar to the antidiuretic model, NaCl excretion was highly sensitive to the PCT response and showed minimal sensitivity to MBF autoregulation. In contrast to the antidiuretic model, decreased MBF autoregulation slightly diminished NaCl excretion (as remarked upon earlier).
Fig. 11.
Effects of varying both the degree of MBF autoregulation and the degree of transport inhibition in the PCT in the diuretic model. In response to elevated perfusion pressure: urine flow is more sensitive to MBF autoregulation than to transport inhibition in the PCT (A); urine osmolality is slightly more sensitive to MBF autoregulation than to transport inhibition in the PCT (B); NaCl excretion is more sensitive to transport inhibition in the PCT than to MBF autoregulation (C); urea excretion is more sensitive to MBF autoregulation than to transport inhibition in the PCT (D).
The DVR flow rate and osmolality, and the NaCl and urea concentrations in the loops of Henle, showed much less sensitivity to both the PCT response and MBF autoregulation than observed in the antidiuretic model. The interstitial washout that accompanies volume expansion limited the effects of these mechanisms. Decreased CD water permeability meant that KMBF and KPCT could produce only minimal differences in volume reabsorption along the CD, contrary to the antidiuretic model. Decreased IMCD urea permeability in the diuretic model permitted only minimal urea recycling, regardless of the IMCD urea flow rate. Urea excretion was two to three times higher in the diuretic model than in the antidiuretic model and urine osmolality did not exceed 430 mosmol/kgH2O when PRPP ≥ 100 mmHg.
Acute in vivo pressure natriuresis.
The rates of water and NaCl excretion in the antidiuretic and diuretic models were then compared with experimental measurements of acute renal function in the rat (see Fig. 12, A and B). The majority of experimental studies observed strong autoregulation of RBF and GFR over wide ranges of perfusion pressure (from 90 to 200 mmHg) (33, 34, 38, 41, 56, 58, 60, 62, 74, 83), while other studies measured significant increases in RBF and/or GFR (57, 64, 66, 101, 103). There does not appear to be a factor in the chosen cohorts or experimental methods that determines whether RBF and GFR are strongly or weakly regulated. Both RBF and whole kidney GFR were also observed to decrease below control levels at low perfusion pressures (PRPP ≤90 mmHg) in the antidiuretic kidney.
Fig. 12.
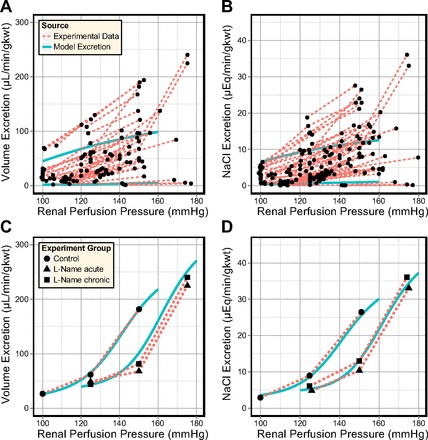
Regulation of water (A) and salt (B) excretion in the antidiuretic model (KMBF = 0, KPCT = 0.010, lower curve) and diuretic model (KMBF = 0.0125, KPCT = 0.040, upper curve), compared with acute renal function data obtained from studies in the rat (33, 34, 38, 41, 56–58, 60, 62, 64, 66, 74, 83, 101). PCT responses were then fitted (C and D) to a single study of acute pressure-natriuresis in which nitric oxide synthase was inhibited (38).
The rates of water and NaCl excretion in the antidiuretic model compared well to the minimal rates observed across the range of surveyed studies. In contrast, the agreement between the diuretic model and experimental data was less ideal. This is likely attributable to the PCT response and/or the CD epithelial parameters. Thus, in subsequent simulations, we attempted to fit the diuretic model excretion rates to whole kidney excretion data. This was achieved by adjusting the PCT response and by altering the model CD transport parameters.
From the experimental studies shown in Fig. 12, A and B, a single study was chosen and used to fit the model excretion curves. Guarasci and Kline (38) investigated acute pressure natriuresis in the rat following both acute and chronic inhibition of nitric oxide synthase (NOS), which inhibits the regulatory effects of nitric oxide (NO) in the renal medulla. This study was selected on the basis that the animals exhibited strong pressure-natriuresis responses and that the absence of NO from the model formulation matches the experimental conditions. PCT responses were fitted to the two groups of rats: “Control” and “l-NAME.” For each group, model excretion curves were fitted under two assumptions: that there is active NaCl transport along the model CD (as in the antidiuretic model) and that this active transport is inhibited in diuresis (as suggested by some studies; Refs. 50, 52, 70, 94, 96, 98).
In each case, the parameters in Eq. 24 that govern PCT fractional reabsorption (K0, K1, and KOp) were adjusted so that the model NaCl excretion rate resembled the measurements of Guarasci and Kline (38). The resulting PCT response curves are shown in Fig. 13. The agreement between the model urine flow and experimental data was also much improved (compare Fig. 12, A and C).
Fig. 13.
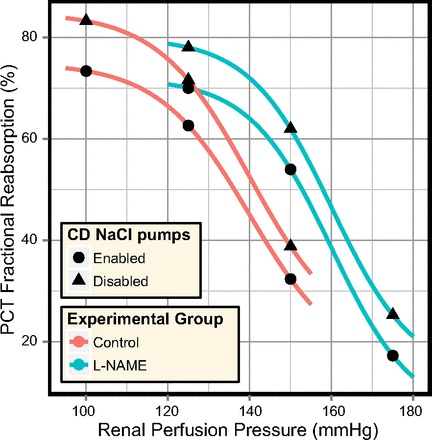
A comparison of the PCT responses fitted to the excretion rates measured by Guarasci and Kline (38), when active transport of NaCl in the model CD is enabled and when it is disabled.
The diuretic model excretion curves provided a good match to the experimental excretion rates when the fitted PCT responses were used. Whether these PCT responses are consistent with experimental observations of reabsorption in the PCT under saline diuresis is another matter. We address this question in the discussion.
DISCUSSION
The model only incorporates a few regulatory mechanisms: the myogenic response of the afferent arteriole, TGF, the direct effects of MBF on medullary solute concentrations, and inhibition of water and NaCl transport in the PCT. The model does not account for the actions of the renin-angiotensin system (RAS), NO, or endothelin, all of which are known to play significant roles in the regulation of renal NaCl excretion. Furthermore, MBF is understood to initiate signaling cascades (via RIHP) that affect sodium reabsorption in the PCT (67). Thus the regulatory mechanisms in the model are both highly simplified and incomplete. This is due, in part, to a shortage of relevant (quantitative) experimental data.
However, these limitations do not necessarily invalidate interpretation of the results presented in this article. In experimental studies of acute pressure natriuresis (such as those shown in Fig. 12), the experimental protocols include measures to keep paracrine levels fixed. This is typically achieved by steady infusion of a “cocktail” of hormones and various inhibitors/antagonists. Short stabilization and collection periods (e.g., 5–20 min) are also used to ensure there is insufficient time for other, slower, regulatory mechanisms to respond.
In short, in the experimental studies of acute pressure natriuresis against which we have compared our model, the very paracrine factors we have been unable to incorporate into our model have been either inhibited or maintained at fixed physiological levels. However, conclusions drawn from the model results may not apply to pressure natriuresis in organisms whose paracrine levels are not tightly controlled. Keeping these limitations in mind, we now compare the model MBF and PCT responses to in vivo data to evaluate the degree to which the model dynamics are consistent with experimental observations.
Medullary blood flow autoregulation.
Medullary blood flow is known to be strongly autoregulated in antidiuretic rats (24, 33, 65) and weakly regulated in diuretic rats (33, 66, 82). The benchmark values for KMBF used in this study (0 and 0.0125) correspond to the regulatory responses observed in hydropenic and volume-expanded rats (65). Since the experimental techniques used to measure variations in MBF are not capable of measuring absolute flow rates, the only quantitative data against which the model DVR flow rates can be compared are micropuncture measurements at the papillary tip.
Blood flow rate in individual DVR vessels at the papillary tip has been measured in several studies and has consistently been measured at 8–11 nl/min in volume-expanded rats (40, 105, 106). In the model base cases, the papillary DVR plasma flow rate is 5.0 nl/min in the antidiuretic model and 7.3 nl/min in the diuretic model (for an individual DVR vessel). Experimental measurements of papillary DVR hematocrit range from 9 to 21% (40). This would imply blood flow rates of 5.5–6.3 and 8.0–9.2 nl/min in the papillary DVR of the antidiuretic and diuretic models, respectively. The papillary DVR flow rate in the diuretic model is consistent with the experimental observations, while the papillary DVR flow rate in the antidiuretic model (5.5–6.3 nl/min) is lower than that observed by Holliger et al. (40) in young antidiuretic rats (8.83 nl/min).
In the diuretic model, decreased autoregulation of MBF (i.e., interstitial washout) did not stimulate an increase in NaCl excretion. This is consistent with evidence that increased washout is not a dominant factor in pressure natriuresis (21, 28, 85). Likewise, decreased autoregulation of MBF in the antidiuretic model did not increase NaCl excretion, since the increased urine flow rate was countered by an equivalent decrease in urine NaCl concentration (Fig. 6). Thus, while MBF plays a significant role in maintaining the hydration status, the model predictions suggest that its direct effects on the interstitial composition have negligible consequences for pressure natriuresis. It remains unclear whether MBF can trigger phenomena such as reduced PCT reabsorption or if the observed correlation between MBF autoregulation and NaCl excretion is due to a common (unidentified) mechanism, such as elevated RIHP (34, 37, 44, 48). The degree of MBF autoregulation is strongly influenced by circulating levels of vasopressin (23, 33), which indicates that vasopressin might play a role in modulating pressure natriuresis. The model results are consistent with the hydration-dependent magnitude of the pressure-natriuresis response and experimental evidence of the effects of interstitial washout. They cannot provide insight into in vivo signaling and the downstream effects of MBF autoregulation.
NaCl reabsorption in the PCT.
Some studies have suggested that increased NaCl excretion after volume expansion requires alterations in NaCl reabsorption beyond the PCT (50, 52, 70, 94, 96, 98). Sonnenberg (96) observed that “only in the low-salt rats can the natriuresis be explained by inhibition of Na transport in the CD; excretion of NaCl in expanded DOCA rats is uniformly greater than end-distal delivery, indicating net entry of the ion into the terminal nephron segment.”
By contrast, fractional NaCl reabsorption along the CD was consistently 10–20% in the diuretic model. Net NaCl secretion into the CD was not observed. It is therefore important to determine whether the fitted PCT responses (shown in Fig. 13) are consistent with experimental measurements of PCT reabsorption under saline diuresis. Inconsistencies between the model PCT response and experimental data would suggest that some of the diuretic parameter values (Table 2) are inappropriate. Acute volume expansion has been observed to reduce PCT fractional reabsorption from 61 to 42% (perfusion/arterial pressure not reported) (53) and from 62% (PRPP = 114 mmHg) to 33% (PRPP = 110 mmHg) (11). Under saline diuresis, increased perfusion pressure has been observed to reduce PCT fractional reabsorption even further, from 65% (PRPP ≈ 80 mmHg) to as low as 25% (PRPP ≈ 135 mmHg) (6). An increase of 50% in PCT delivery to the descending limb [as observed by Brenner et al. (11), mentioned above] is consistent with in vivo observations of end proximal tubule fluid velocity and flow rate in response to acute arterial hypertension (105→155 mmHg) in the rat (19). Urine flow rate was also increased ∼2.5-fold in response to the acute hypertension. A smaller degree of hypertension (104→129 mmHg) was observed to increase urine flow by 45% and late proximal flow rate by 30% (18). Clearly, there is significant variation between the baseline reabsorption rates and between the magnitude of the changes in reabsorption in response to volume expansion and acute hypertension.
Guarasci and Kline (38) observed an approximately five- to sixfold increase in urine flow rate and a seven to eightfold increase in NaCl excretion rate in response to an acute perfusion pressure elevation of 50 mmHg (Fig. 4). The PCT responses fitted to the “Control” case, with and without CD NaCl active transport, are consistent the above data. Volume expansion, without elevation in perfusion pressure, was observed in vivo to decrease PCT fractional reabsorption to 30–40%. When combined with an acute elevation of perfusion pressure to 135 mmHg, in vivo PCT fractional reabsorption decreased to 25%. PCT fractional reabsorption for both fits is significantly higher at PRPP = 100 mmHg than observed in volume-expanded animals. Instead, it is more consistent with levels observed in vivo before volume expansion. The decrease in fractional reabsorption from PRPP = 125 mmHg to PRPP = 150 mmHg is larger than observed in vivo, where late proximal flow rate increased by 30% and urine flow rate increased by 45% (18), but the pressure natriuresis observed by Guarasci and Kline (38) was also much larger than that observed by Chou and Marsh (18).
The PCT responses fitted to the “l-NAME” case predicted end-proximal flows and urine flows that were consistent with in vivo measurements in response to an acute elevation from PRPP = 125 mmHg to PRPP = 150 mmHg (18). Since PCT fractional reabsorption has been observed as low as 25% at PRPP = 135 mmHg (6), it seems plausible that it should decrease further when the perfusion pressure is elevated to 175 mmHg. This remains plausible, even when accounting for the shift of the pressure-natriuresis response induced by the administration of nitro-l-arginine methyl ester (l-NAME), as observed by Guarasci and Kline.
Studies have suggested that CD NaCl reabsorption is inhibited under volume expansion (50, 52, 70, 94), and NaCl secretion into the CD has even been observed (96–98). This suggests that the diuretic model is, perhaps, more realistic when active NaCl transport along the CD is inhibited. However, while PCT fractional reabsorption has been measured to be as high as 75% in antidiuretic animals (35), volume expansion is known to significantly reduce PCT reabsorption. Thus PCT fractional reabsorption for the fitted responses is higher than expected at the lowest pressures (PRPP = 100 mmHg for “Control” and PRPP = 125 mmHg for “l-NAME”), while being consistent with in vivo data at higher pressures. This suggests that the diuretic model (Table 2) produces a diuresis that is too strong at these low pressures and that PCT reabsorption must be overly elevated to counter this. This could be avoided by scaling the diuresis in proportion to the model perfusion pressure.
Given that the slope of the whole kidney pressure natriuresis response is commonly observed to be around four to six times steeper in diuretic animals than in antidiuretic animals (34, 60, 64, 74, 78, 80, 82, 103), it is reasonable to suggest that the model PCT response in the diuretic model should also be four to six times steeper than in the antidiuretic model. The slope of the fitted PCT responses in the diuretic model varied from 0.09 to 0.10, which is four times larger than the slope considered reasonable for the antidiuretic model (0.025).
Plasma ADH is known to increase the water permeability of the late distal tubule and CD (12, 27, 31, 42), to increase the urea permeability of the IMCD (42, 88, 90), and to stimulate active NaCl transport along the CD (39, 42, 61, 77). The epithelial changes introduced in the diuretic model are consistent with the known effects of the decrease in circulating ADH that is caused by volume expansion. Therefore, the model results suggest that the known actions of decreased ADH levels and increased inhibition of reabsorption in the PCT are sufficient to drive pressure natriuresis to levels consistent with those observed in experimental studies. The mechanisms by which PCT reabsorption is inhibited under volume expansion remain insufficiently quantified and cannot be investigated with this model.
Regulation of urea excretion.
In all mammals investigated, urea excretion has been observed to vary with the protein content of the diet (91), which is beyond the scope of this model. Urea excretion is also regulated by ADH (86, 87), which stimulates urea reabsorption in the terminal IMCD, and so we should expect the model urea excretion rate to be elevated in the diuretic kidney. Model excretion rates were 1–6 μeq·min−1·g kwt−1 in the antidiuretic model and 7–11 μeq·min−1·g kwt−1 in the diuretic model (compare Figs. 10 and 11). Model urine urea concentrations were 220–580 mM in the antidiuretic kidney and 70–150 mM in the diuretic kidney. In both cases, the concentration was maximal at low perfusion pressures and decreased in response to elevations in perfusion pressure.
Urea excretion has been measured in various studies in the rat. In male Sprague- Dawley rats an acute elevation of perfusion pressure by 37 mmHg doubled the urea excretion rate from 3.7 to 7.5 μeq·min−1·g kwt−1 (81). In response to acute elevations of around 60 mmHg in male Wistar-Kyoto rats, urea excretion increased from 2.7 to 5.5 μeq·min−1·g kwt−1 (80). In male spontaneously hypertensive rats, the same elevation increased urea excretion from 4.1 to 5.0 μeq·min−1·g kwt−1 (80). Water diuresis in male Wistar rats produced a rapid increase in urea excretion that returned to nondiuretic levels after 6–8 h (5). Osmotic diuresis also produced a rapid increase in urea excretion before decreasing to levels around 50% higher than in the nondiuretic rat (5). Saline diuresis in male Wistar rats elevated the urea excretion rate from 2.7 to 7.5 μeq·min−1·g kwt−1 in dehydrated rats, from 4.0 to 6.7 μeq·min−1·g kwt−1 in “normal” rats, and from 2.7 to 5.4 in hydrated rats (4). In response to ADH infusion in male Wistar rats, it was observed that “plasma urea concentrations were lowest in the diuretic groups, where the high urine flows were associated with the highest urinary urea outputs and urea clearances” (3).
In the antidiuretic model, urea excretion rate was increased from 1.1 to 3.1 μeq·min−1·g kwt−1 in response to acute elevations of 40 mmHg (KMBF = 0, KPCT = 0.040) and 60 mmHg (KMBF = 0, KPCT = 0.025), similar to the observations in Sprague-Dawley and Wistar-Kyoto rats. Acute elevations in the diuretic model produced smaller fractional increases in urea excretion rate, from 6.6 to 8.4 μeq·min−1·g kwt−1 (40 mmHg) and 9.2 μeq·min−1·g kwt−1 (60 mmHg), comparable to the observations in spontaneously hypertensive rats. At PRPP = 100 mmHg the urea excretion rates in the antidiuretic and diuretic models were 1.1 and 6.6 μeq·min−1·g kwt−1, respectively, which is comparable to the effects of saline diuresis in dehydrated male Wistar rats (from 2.7 to 7.5 μeq·min−1·g kwt−1). In all model simulations it was observed that increased urine flow was accompanied by decreased urine urea concentration and increased urea excretion, consistent with the behavior observed in Wistar rats undergoing ADH infusion. This suggests that the model urine concentrating mechanism degrades in a realistic manner.
Anatomical considerations.
Juxtamedullary afferent arterioles exhibit efficient blood flow autoregulation in the rat (14, 100), even in response to volume expansion (29, 43, 79, 95). If the DVR inflow rate is determined solely by the efferent flow rate of the juxtamedullary nephron population, this implies that MBF must be well-regulated in diuresis, which appears to contradict experimental measurements of MBF in diuretic rats (32, 33, 65). Roman et al. (82) suggested that the vascular resistance of the DVR might decrease when RPP is elevated. In the model simulations presented here, we have ignored this issue and varied the DVR inflow independently of the juxtamedullary SNGFR, but we can speculate as to how these two quantities may vary independently of each other in vivo.
Preglomerular shunts have been observed in the rat kidney (15), although the role of these vessels remains uncertain (72). If we assume that such shunts exist in a small fraction of the juxtamedullary nephron population and that their endothelium is similar to that of the initial DVR (46), then it seems plausible that such vessels could be closed and admit no flow of plasma or renal blood cells when the circulating levels of ADH are relatively high and that such vessels could be open and admit the flow of plasma and renal blood cells when the circulating levels of ADH are relatively low (69, 71). This would explain how juxtamedullary SNGFR and DVR can be regulated independently and why the rate of MBF is dependent upon the hydration status of the animal.
Conclusions.
The model has been used to predict pressure-sensitive changes in NaCl excretion in response to variations in MBF autoregulation and inhibition of PCT reabsorption. Changes in epithelial permeability, representing physiological effects of volume expansion, were shown to increase model NaCl and water excretion rates, but these increases are insensitive to the perfusion pressure.
The results also suggest that the direct effects of MBF on the interstitial composition cannot stimulate pressure natriuresis. In both the antidiuretic and diuretic models, MBF autoregulation exerted a stronger effect on urine osmolality and flow rate than did the PCT response. This suggests that efficient MBF autoregulation, as observed in the antidiuretic rat, is important for maintaining the whole body hydration status.
Model PCT responses were fitted to produce water and solute excretion rates that matched experimental measurements of pressure natriuresis in the diuretic rat. These responses were consistent with experimental observations of PCT reabsorption inhibition, suggesting that inhibition of PCT reabsorption is sufficient to drive pressure natriuresis to levels observed in vivo. The signaling mechanisms that mediate this inhibition are presumably key factors responsible for stimulating pressure natriuresis.
GRANTS
This research was supported by National Institute of Diabetes and Digestive and Kidney Diseases Grant DK-89066 (to A. T. Layton).
DISCLOSURES
No conflicts of interest, financial or otherwise, are declared by the author(s).
AUTHOR CONTRIBUTIONS
Author contributions: R.M. and A.T.L. conception and design of research; R.M. performed experiments; R.M. and A.T.L. analyzed data; R.M. and A.T.L. interpreted results of experiments; R.M. prepared figures; R.M. drafted manuscript; R.M. and A.T.L. edited and revised manuscript; R.M. and A.T.L. approved final version of manuscript.
ACKNOWLEDGMENTS
We thank Ardis Cheng for designing the model diagram (Fig. 1).
REFERENCES
- 1.Aperia AC, Broberger CG, Söderlund S. Relationship between renal artery perfusion pressure and tubular sodium reabsorption. Am J Physiol 220: 1205–1212, 1971 [DOI] [PubMed] [Google Scholar]
- 2.Armsen T, Reinhardt HW. Transtubular movement of urea at different degrees of water diuresis. Pflügers Arch 326: 270–280, 1971 [DOI] [PubMed] [Google Scholar]
- 3.Atherton JC, Evans JA, Green R, Thomas S. Influence of variations in hydration and in solute excretion of the effects of lysine-vasopressin infusion on urinary and renal tissue composition in the conscious rat. J Physiol 213: 311–327, 1971 [DOI] [PMC free article] [PubMed] [Google Scholar]
- 4.Atherton JC, Green R, Thomas S. Effects of 0–9% saline infusion on urinary and renal tissue composition in the hydropaenic, normal and hydrated conscious rat. J Physiol 210: 45–71, 1970 [DOI] [PMC free article] [PubMed] [Google Scholar]
- 5.Atherton JC, Hai MA, Thomas S. Effects of water diuresis and osmotic (mannitol) diuresis on urinary solute excretion by the conscious rat. J Physiol 197: 395–410, 1968 [DOI] [PMC free article] [PubMed] [Google Scholar]
- 6.Bank N, Koch KM, Aynedjian HS, Aras M. Effect of changes in renal perfusion pressure on the suppression of proximal tubular sodium reabsorption due to saline loading. J Clin Invest 48: 271–283, 1969 [DOI] [PMC free article] [PubMed] [Google Scholar]
- 7.Bengele HH, Lechene C, Alexander EA. Sodium and chloride transport along the inner medullary collecting duct: effect of saline expansion. Am J Physiol Renal Fluid Electrolyte Physiol 238: F504–F508, 1980 [DOI] [PubMed] [Google Scholar]
- 8.Bertram JF, Soosaipillai MC, Ricardo SD, Ryan GB. Total numbers of glomeruli and individual glomerular cell types in the normal rat kidney. Cell Tissue Res 270: 37–45, 1992 [DOI] [PubMed] [Google Scholar]
- 9.Bie P. Blood volume, blood pressure and total body sodium: internal signalling and output control. Acta Physiol (Oxf) 195: 187–196, 2009 [DOI] [PubMed] [Google Scholar]
- 10.Bie P, Damkjær M. Renin secretion and total body sodium: pathways of integrative control. Clin Exp Pharmacol Physiol 37: e34–e42, 2010 [DOI] [PubMed] [Google Scholar]
- 11.Brenner BM, Troy JL, Daugharty TM, Ueki IF, Nicholas DP, Wong CF. On the mechanism of inhibition in fluid reabsorption by the renal proximal tubule of the volume-expanded rat. J Clin Invest 50: 1596–1602, 1971 [DOI] [PMC free article] [PubMed] [Google Scholar]
- 12.Breyer MD, Ando Y. Hormonal signaling and regulation of salt and water transport in the collecting duct. Annu Rev Physiol 56: 711–739, 1994 [DOI] [PubMed] [Google Scholar]
- 13.Carlson BE, Arciero JC, Secomb TW. Theoretical model of blood flow autoregulation: roles of myogenic, shear-dependent, and metabolic responses. Am J Physiol Heart Circ Physiol 295: H1572–H1579, 2008 [DOI] [PMC free article] [PubMed] [Google Scholar]
- 14.Carmines PK, Inscho EW, Gensure RC. Arterial pressure effects on preglomerular microvasculature of juxtamedullary nephrons. Am J Physiol Renal Fluid Electrolyte Physiol 258: F94–F102, 1990 [DOI] [PubMed] [Google Scholar]
- 15.Casellas D, Mimran A. Shunting in renal microvasculature of the rat: a scanning electron microscopic study of corrosion casts. Anat Rec 201: 237–248, 1981 [DOI] [PubMed] [Google Scholar]
- 16.Cevese A, Guyton AC. Isohemic blood volume expansion in normal and areflexive dogs. Am J Physiol 231: 104–111, 1976 [DOI] [PubMed] [Google Scholar]
- 17.Chen J, Sgouralis I, Moore LC, Layton HE, Layton AT. A mathematical model of the myogenic response to systolic pressure in the afferent arteriole. Am J Physiol Renal Physiol 300: F669–F681, 2011 [DOI] [PMC free article] [PubMed] [Google Scholar]
- 18.Chou CL, Marsh DJ. Role of proximal convoluted tubule in pressure diuresis in the rat. Am J Physiol Renal Fluid Electrolyte Physiol 251: F283–F289, 1986 [DOI] [PubMed] [Google Scholar]
- 19.Chou CL, Marsh DJ. Time course of proximal tubule response to acute arterial hypertension in the rat. Am J Physiol Renal Fluid Electrolyte Physiol 254: F601–F607, 1988 [DOI] [PubMed] [Google Scholar]
- 20.Colding-Jørgensen M, Steven K. A model of the mechanics of smooth muscle reservoirs applied to the intestinal bladder. Neurourol Urodyn 12: 59–79, 1993 [DOI] [PubMed] [Google Scholar]
- 21.Cowley AW., Jr Long-term control of arterial blood pressure. Physiol Rev 72: 231–300, 1992 [DOI] [PubMed] [Google Scholar]
- 22.Cowley AW., Jr Role of the renal medulla in volume and arterial pressure regulation. Am J Physiol Regul Integr Comp Physiol 273: R1–R15, 1997 [DOI] [PubMed] [Google Scholar]
- 23.Cowley AW., Jr Control of the renal medullary circulation by vasopressin v1 and v2 receptors in the rat. Exp Physiol 85: 223s–231s, 2000 [DOI] [PubMed] [Google Scholar]
- 24.Cupples WA, Marsh DJ. Autoregulation of blood flow in renal medulla of the rat: no role for angiotensin II. Can J Physiol Pharmacol 66: 833–836, 1988 [DOI] [PubMed] [Google Scholar]
- 25.Damkjær M, Isaksson GL, Stubbe J, Jensen BL, Assersen K, Bie P. Renal renin secretion as regulator of body fluid homeostasis. Pflügers Arch 465: 153–165, 2013 [DOI] [PubMed] [Google Scholar]
- 26.Davis MJ, Sikes PJ. Myogenic responses of isolated arterioles: test for a rate-sensitive mechanism. Am J Physiol Heart Circ Physiol 259: H1890–H1900, 1990 [DOI] [PubMed] [Google Scholar]
- 27.Elalouf JM, Roinel N, de Rouffignac C. Effects of antidiuretic hormone on electrolyte reabsorption and secretion in distal tubules of rat kidney. Pflügers Arch 401: 167–173, 1984 [DOI] [PubMed] [Google Scholar]
- 28.Evans RG, Majid DS, Eppel GA. Mechanisms mediating pressure natriuresis: what we know and what we need to find out. Clin Exp Pharmacol Physiol 32: 400–409, 2005 [DOI] [PubMed] [Google Scholar]
- 29.Farman N, Bonvalet JP. Abnormal relationship between sodium excretion and hypertension in spontaneously hypertensive rats. Pflügers Arch 354: 39–53, 1975 [DOI] [PubMed] [Google Scholar]
- 30.Feldberg R, Colding-Jørgensen M, Holstein-Rathlou NH. Analysis of interaction between TGF and the myogenic response in renal blood flow autoregulation. Am J Physiol Renal Fluid Electrolyte Physiol 269: F581–F593, 1995 [DOI] [PubMed] [Google Scholar]
- 31.Field MJ, Stanton BA, Giebisch GH. Influence of ADH on renal potassium handling: a micropuncture and microperfusion study. Kidney Int 25: 502–511, 1984 [DOI] [PubMed] [Google Scholar]
- 32.Franchini KG, Cowley AW., Jr Sensitivity of the renal medullary circulation to plasma vasopressin. Am J Physiol Regul Integr Comp Physiol 271: R647–R653, 1996 [DOI] [PubMed] [Google Scholar]
- 33.Franchini KG, Mattson DL, Cowley AW., Jr Vasopressin modulation of medullary blood flow and pressure-natriuresis-diuresis in the decerebrated rat. Am J Physiol Regul Integr Comp Physiol 272: R1472–R1479, 1997 [DOI] [PubMed] [Google Scholar]
- 34.Garcia-Estãn. J, Roman RJ. Role of renal interstitial hydrostatic pressure in the pressure diuresis response. Am J Physiol Renal Fluid Electrolyte Physiol 256: F63–F70, 1989 [DOI] [PubMed] [Google Scholar]
- 35.Glabman S, Aynedjian HS, Bank N. Micropuncture study of the effect of acute reductions in glomerular filtration rate on sodium and water reabsorption by the proximal tubules of the rat. J Clin Invest 44: 1410–1416, 1965 [DOI] [PMC free article] [PubMed] [Google Scholar]
- 36.Granger JP. Pressure natriuresis. Role of renal interstitial hydrostatic pressure. Hypertension 19: I9–17, 1992 [DOI] [PubMed] [Google Scholar]
- 37.Granger JP, Alexander BT, Llinas M. Mechanisms of pressure natriuresis. Curr Hypertens Rep 4: 152–159, 2002 [DOI] [PubMed] [Google Scholar]
- 38.Guarasci GR, Kline RL. Pressure natriuresis following acute and chronic inhibition of nitric oxide synthase in rats. Am J Physiol Regul Integr Comp Physiol 270: R469–R478, 1996 [DOI] [PubMed] [Google Scholar]
- 39.Hawk CT, Li L, Schafer JA. AVP and aldosterone at physiological concentrations have synergistic effects on Na+ transport in rat CCD. Kidney Int Suppl 57: S35–S41, 1996 [PubMed] [Google Scholar]
- 40.Holliger C, Lemley KV, Schmitt SL, Thomas FC, Robertson CR, Jamison RL. Direct determination of vasa recta blood flow in the rat renal papilla. Circ Res 53: 401–413, 1983 [DOI] [PubMed] [Google Scholar]
- 41.Ikenaga H, Suzuki H, Ishii N, Itoh H, Saruta T. Role of NO on pressurenatriuresis in Wistar-Kyoto and spontaneously hypertensive rats. Kidney Int 43: 205–211, 1993 [DOI] [PubMed] [Google Scholar]
- 42.Inoue T, Nonoguchi H, Tomita K. Physiological effects of vasopressin and atrial natriuretic peptide in the collecting duct. Cardiovasc Res 51: 470–480, 2001 [DOI] [PubMed] [Google Scholar]
- 43.Jamison RL, Lacy FB. Effect of saline infusion on superficial and juxtamedullary nephrons in the rat. Am J Physiol 221: 690–697, 1971 [DOI] [PubMed] [Google Scholar]
- 44.Jin C, Hu C, Polichnowski A, Mori T, Skelton M, Ito S, Cowley AW., Jr Effects of renal perfusion pressure on renal medullary hydrogen peroxide and nitric oxide production. Hypertension 53: 1048–1053, 2009 [DOI] [PMC free article] [PubMed] [Google Scholar]
- 45.Kaloyanides GJ, DiBona GF, Raskin P. Pressure natriuresis in the isolated kidney. Am J Physiol 220: 1660–1666, 1971 [DOI] [PubMed] [Google Scholar]
- 46.Kennedy-Lydon TM, Crawford C, Wildman SS, Peppiatt-Wildman CM. Renal pericytes: regulators of medullary blood flow. Acta Physiol (Oxf) 207: 212–225, 2013 [DOI] [PMC free article] [PubMed] [Google Scholar]
- 47.Khavandi K, Greenstein AS, Sonoyama K, Withers S, Price A, Malik RA, Heagerty AM. Myogenic tone and small artery remodelling: insight into diabetic nephropathy. Nephrol Dial Transplant 24: 361–369, 2009 [DOI] [PubMed] [Google Scholar]
- 48.Khraibi AA, Knox FG. Effect of renal decapsulation on renal interstitial hydrostatic pressure and natriuresis. Am J Physiol Regul Integr Comp Physiol 257: R44–R48, 1989 [DOI] [PubMed] [Google Scholar]
- 49.Kim J, Pannabecker TL. Two-compartment model of inner medullary vasculature supports dual modes of vasopressin-regulated inner medullary blood flow. Am J Physiol Renal Physiol 299: F273–F279, 2010 [DOI] [PMC free article] [PubMed] [Google Scholar]
- 50.Knox FG, Schneider EG, Willis LR, Strandhoy JW, Ott CE. Effect of volume expansion on sodium excretion in the presence and absence of increased delivery from superficial proximal tubules. J Clin Invest 52: 1642–1646, 1973 [DOI] [PMC free article] [PubMed] [Google Scholar]
- 51.Kriz W. Der architektonische und funktioneile Aufbau der Rattenniere. Cell Tissue Res 82: 495–535, 1967 [PubMed] [Google Scholar]
- 52.Kunau RT, Lameire NH. The effect of an acute increase in renal perfusion pressure on sodium transport in the rat kidney. Circ Res 39: 689–695, 1976 [DOI] [PubMed] [Google Scholar]
- 53.Kuschinsky W, Wahl M, Wunderlich P, Thurau K. Different correlations between plasma protein concentration and proximal fractional reabsorption in the rat during acute and chronic saline infusion. Pflügers Arch 321: 102–120, 1970 [DOI] [PubMed] [Google Scholar]
- 54.Lameire NH, Lifschitz MD, Stein JH. Heterogeneity of nephron function. Annu Rev Physiol 39: 159–184, 1977 [DOI] [PubMed] [Google Scholar]
- 55.Layton AT, Dantzler WH, Pannabecker TL. Urine concentrating mechanism: impact of vascular and tubular architecture and a proposed descending limb urea-Na+ cotransporter. Am J Physiol Renal Physiol 302: F591–F605, 2012 [DOI] [PMC free article] [PubMed] [Google Scholar]
- 56.Liu KL, Lo M, Grouzmann E, Mutter M, Sassard J. The subtype 2 of angiotensin II receptors and pressure-natriuresis in adult rat kidneys. Br J Pharmacol 126: 826–832, 1999 [DOI] [PMC free article] [PubMed] [Google Scholar]
- 57.Lo M, Liu KL, Clemitson JR, Sassard J, Samani NJ. Chromosome 1 blood pressure QTL region influences renal function curve and salt sensitivity in SHR. Physiol Genomics 8: 15–21, 2002 [DOI] [PubMed] [Google Scholar]
- 58.Lo M, Liu KL, Lantelme P, Sassard J. Subtype 2 of angiotensin II receptors controls pressure-natriuresis in rats. J Clin Invest 95: 1394–1397, 1995 [DOI] [PMC free article] [PubMed] [Google Scholar]
- 59.Loutzenhiser R, Bidani A, Chilton L. Renal myogenic response: kinetic attributes and physiological role. Circ Res 90: 1316–1324, 2002 [DOI] [PubMed] [Google Scholar]
- 60.Madrid MI, Garc'ıa-Salom M, Tornel J, Gasparo MD, Fenoy FJ. Effect of interactions between nitric oxide and angiotensin II on pressure diuresis and natriuresis. Am J Physiol Regul Integr Comp Physiol 273: R1676–R1682, 1997 [DOI] [PubMed] [Google Scholar]
- 61.Makhanova N, Lee G, Takahashi N, Sequeira Lopez ML, Gomez RA, Kim HS, Smithies O. Kidney function in mice lacking aldosterone. Am J Physiol Renal Physiol 290: F61–F69, 2006 [DOI] [PubMed] [Google Scholar]
- 62.van der Mark J, Kline RL. Altered pressure natriuresis in chronic angiotensin II hypertension in rats. Am J Physiol Regul Integr Comp Physiol 266: R739–R748, 1994 [DOI] [PubMed] [Google Scholar]
- 63.Martino JA, Earley LE. Relationship between intrarenal hydrostatic pressure and hemodynamically induced changes in sodium excretion. Circ Res 23: 371–386, 1968 [DOI] [PubMed] [Google Scholar]
- 64.Masilamani S, Hobbs GR, Baylis C. The acute pressure natriuresis response blunted and the blood pressure response reset in the normal pregnant rat. Am J Obstet Gynecol 179: 486–491, 1998 [DOI] [PubMed] [Google Scholar]
- 65.Mattson DL, Lu S, Roman RJ, Cowley AW., Jr Relationship between renal perfusion pressure and blood flow in different regions of the kidney. Am J Physiol Regul Integr Comp Physiol 264: R578–R583, 1993 [DOI] [PubMed] [Google Scholar]
- 66.Mattson DL, Raff H, Roman RJ. Influence of angiotensin II on pressure natriuresis and renal hemodynamics in volume-expanded rats. Am J Physiol Regul Integr Comp Physiol 260: R1200–R1209, 1991 [DOI] [PubMed] [Google Scholar]
- 67.McDonough AA, Leong PK, Yang LE. Mechanisms of pressure natriuresis: how blood pressure regulates renal sodium transport. Ann NY Acad Sci 986: 669–677, 2003 [DOI] [PubMed] [Google Scholar]
- 68.Moss R, Thomas SR. Hormonal regulation of salt and water excretion: a mathematical model of whole-kidney function and pressure-natriuresis. Am J Physiol Renal Physiol 306: F224–F248, 2014 [DOI] [PubMed] [Google Scholar]
- 69.Navar LG, Arendshorst WJ, Pallone TL, Inscho EW, Imig JD, Bell PD. The renal microcirculation. In: Comprehensive Physiology, edited by Terjung RL. New York: John Wiley & Sons, chapt. 13, 2011, p. 550–683 [Google Scholar]
- 70.Navar LG, Bell PD, Burke TJ. Autoregulatory responses of superficial nephrons and their association with sodium excretion during arterial pressure alterations in the dog. Circ Res 41: 487–496, 1977 [DOI] [PubMed] [Google Scholar]
- 71.Pallone TL, Edwards A, Mattson DL. Renal medullary circulation. Compr Physiol 2: 97–140, 2012 [DOI] [PubMed] [Google Scholar]
- 72.Pallone TL, Robertson CR, Jamison RL. Renal medullary microcirculation. Physiol Rev 70: 885–920, 1990 [DOI] [PubMed] [Google Scholar]
- 73.Pannabecker TL, Abbott DE, Dantzler WH. Three-dimensional functional reconstruction of inner medullary thin limbs of Henle's loop. Am J Physiol Renal Physiol 286: F38–F45, 2004 [DOI] [PubMed] [Google Scholar]
- 74.Patel A, Layne S, Watts D, Kirchner KA. l-arginine administration normalizes pressure natriuresis in hypertensive Dahl rats. Hypertension 22: 863–869, 1993 [DOI] [PubMed] [Google Scholar]
- 75.Pries AR, Neuhaus D, Gaehtgens P. Blood viscosity in tube flow: dependence on diameter and hematocrit. Am J Physiol Heart Circ Physiol 263: H1770–H1778, 1992 [DOI] [PubMed] [Google Scholar]
- 76.Pries AR, Secomb TW, Gessner T, Sperandio MB, Gross JF, Gaehtgens P. Resistance to blood flow in microvessels in vivo. Circ Res 75: 904–915, 1994 [DOI] [PubMed] [Google Scholar]
- 77.Reif MC, Troutman SL, Schafer JA. Sodium transport by rat cortical collecting tubule. Effects of vasopressin and desoxycorticosterone. J Clin Invest 77: 1291–1298, 1986 [DOI] [PMC free article] [PubMed] [Google Scholar]
- 78.Roman RJ. Abnormal renal hemodynamics and pressure-natriuresis relationship in Dahl salt-sensitive rats. Am J Physiol Renal Fluid Electrolyte Physiol 251: F57–F65, 1986 [DOI] [PubMed] [Google Scholar]
- 79.Roman RJ. Pressure-diuresis in volume-expanded rats. Tubular reabsorption in superficial and deep nephrons. Hypertension 12: 177–183, 1988 [DOI] [PubMed] [Google Scholar]
- 80.Roman RJ, Cowley AW. Abnormal pressure-diuresis-natriuresis response in spontaneously hypertensive rats. Am J Physiol Renal Fluid Electrolyte Physiol 248: F199–F205, 1985 [DOI] [PubMed] [Google Scholar]
- 81.Roman RJ, Cowley AW., Jr Characterization of a new model for the study of pressure-natriuresis in the rat. Am J Physiol Renal Fluid Electrolyte Physiol 248: F190–F198, 1985 [DOI] [PubMed] [Google Scholar]
- 82.Roman RJ, Cowley AW, Jr, Garcia-Estãn J, Lombard JH. Pressurediuresis in volume-expanded rats. Cortical and medullary hemodynamics. Hypertension 12: 168–176, 1988 [DOI] [PubMed] [Google Scholar]
- 83.Roman RJ, Kaldunski M. Pressure natriuresis and cortical and papillary blood flow in inbred Dahl rats. Am J Physiol Regul Integr Comp Physiol 261: R595–R602, 1991 [DOI] [PubMed] [Google Scholar]
- 84.Romero JC, Knox FG. Mechanisms underlying pressure-related natriuresis: the role of the renin-angiotensin and prostaglandin systems state of the art lecture. Hypertension 11: 724–738, 1988 [DOI] [PubMed] [Google Scholar]
- 85.Sadowski J, Dobrowolski L. The renal medullary interstitium: focus on osmotic hypertonicity. Clin Exp Pharmacol Physiol 30: 119–126, 2003 [DOI] [PubMed] [Google Scholar]
- 86.Sands JM. Regulation of renal urea transporters. J Am Soc Nephrol 10: 635–646, 1999 [DOI] [PubMed] [Google Scholar]
- 87.Sands JM, Blount MA, Klein JD. Regulation of renal urea transport by vasopressin. Trans Am Clin Climatol Assoc 122: 82–92, 2011 [PMC free article] [PubMed] [Google Scholar]
- 88.Sands JM, Knepper MA. Urea permeability of mammalian inner medullary collecting duct system and papillary surface epithelium. J Clin Invest 79: 138- 147, 1987 [DOI] [PMC free article] [PubMed] [Google Scholar]
- 89.Sands JM, Layton HE. The urine concentrating mechanism and urea transporters. In: Seldin and Giebisch's The Kidney: Physiology and Pathophysiology (4th ed), edited by Alpern RJ, Hebert SC. New York: Elsevier, 2008, p. 1143–1178 [Google Scholar]
- 90.Sands JM, Nonoguchi H, Knepper MA. Vasopressin effects on urea and H2O transport in inner medullary collecting duct subsegments. Am J Physiol Renal Fluid Electrolyte Physiol 253: F823–F832, 1987 [DOI] [PubMed] [Google Scholar]
- 91.Schmidt-Nielsen B. Urea excretion in mammals. Physiol Rev 38: 139–168, 1958 [DOI] [PubMed] [Google Scholar]
- 92.Schnermann J, Häberle DA, Davis JM, Thurau K. Tubuloglomerular feedback control of renal vascular resistance. In: Handbook of Physiology. Renal Physiology, edited by Windhager EE. Bethesda, MD: Am Physiol Soc, sect. 8, chapt. 34, 1992, pp. 1675–1705 [Google Scholar]
- 93.Schnermann J, Traynor T, Yang T, Arend L, Huang YG, Smart A, Briggs JP. Tubuloglomerular feedback: new concepts and developments. Kidney Int Suppl 67: S40–S45, 1998 [DOI] [PubMed] [Google Scholar]
- 94.Selkurt EE, Womack I, Dailey WN. Mechanism of natriuresis and diuresis during elevated renal arterial pressure. Am J Physiol 209: 95–99, 1965 [DOI] [PubMed] [Google Scholar]
- 95.Sjöquist M, Göransson A, Källskog O, Ulfendahl HR. The influence of tubulo-glomerular feedback on the autoregulation of filtration rate in superficial and deep glomeruli. Acta Physiol Scand 122: 235–242, 1984 [DOI] [PubMed] [Google Scholar]
- 96.Sonnenberg H. Renal response to blood volume expansion: distal tubular function and urinary excretion. Am J Physiol 223: 916–924, 1972 [DOI] [PubMed] [Google Scholar]
- 97.Sonnenberg H. Secretion of salt and water into the medullary collecting duct of Ringer-infused rats. Am J Physiol 228: 565–568, 1975 [DOI] [PubMed] [Google Scholar]
- 98.Sonnenberg H, Honrath U, Wilson DR. Effects of increased perfusion pressure on medullary collecting duct function. Can J Physiol Pharmacol 68: 402–407, 1990 [DOI] [PubMed] [Google Scholar]
- 99.Strassberg J, Paule J, Gonick HC, Maxwell MH, Kleeman CR. The quantitative estimation of perfusible glomeruli and the collagen and noncollagen nitrogen of the normal kidney. Nephron 4: 384–393, 1967 [DOI] [PubMed] [Google Scholar]
- 100.Takenaka T, Harrison-Bernard LM, Inscho EW, Carmines PK, Navar LG. Autoregulation of afferent arteriolar blood flow in juxtamedullary nephrons. Am J Physiol Renal Fluid Electrolyte Physiol 267: F879–F887, 1994 [DOI] [PubMed] [Google Scholar]
- 101.Takezawa K, Cowley AW, Jr, Skelton M, Roman RJ. Atriopeptin III alters renal medullary hemodynamics and the pressure-diuresis response in rats. Am J Physiol Renal Fluid Electrolyte Physiol 252: F992–F1002, 1987 [DOI] [PubMed] [Google Scholar]
- 102.Thomson SC, Blantz RC, Vallon V. Increased tubular flow induces resetting of tubuloglomerular feedback in euvolemic rats. Am J Physiol Renal Fluid Electrolyte Physiol 270: F461–F468, 1996 [DOI] [PubMed] [Google Scholar]
- 103.Wang CT, Chin SY, Navar LG. Impairment of pressure-natriuresis and renal autoregulation in ANG II-infused hypertensive rats. Am J Physiol Renal Physiol 279: F319–F325, 2000 [DOI] [PubMed] [Google Scholar]
- 104.Yuan J, Pannabecker TL. Architecture of inner medullary descending and ascending vasa recta: pathways for countercurrent exchange. Am J Physiol Renal Physiol 299: F265–F272, 2010 [DOI] [PMC free article] [PubMed] [Google Scholar]
- 105.Zimmerhackl B, Robertson CR, Jamison RL. Fluid uptake in the renal papilla by vasa recta estimated by two methods simultaneously. Am J Physiol Renal Fluid Electrolyte Physiol 248: F347–F353, 1985 [DOI] [PubMed] [Google Scholar]
- 106.Zimmerhackl B, Robertson CR, Jamison RL. The microcirculation of the renal medulla. Circ Res 57: 657–667, 1985 [DOI] [PubMed] [Google Scholar]