Abstract
We experimentally monitored, at the single-molecule level, the competition among reverse transcription, exponential amplification (RT-LAMP), and linear degradation (restriction enzymes) starting with Hepatitis C viral RNA molecules. We found significant heterogeneity in the rate of single-molecule amplification; introduction of the restriction enzymes affected both the rate and the “fate” (the binary outcome) of single-molecule amplification. While end-point digital measurements were primarily sensitive to changes in fate, the bulk real-time kinetic measurements were dominated by the rate of amplification of the earliest molecules, and not sensitive to fate of the rest of the molecules. We showed how this competition of reactions can be used for rapid HCV genotyping with either digital or bulk readout. This work advances our understanding of single-molecule dynamics in reaction networks and may help bring genotyping capabilities out of clinical labs and into limited-resource settings.
Keywords: analytical methods, genotyping, global health, hepatitis C, single-molecule studies
This paper presents single-molecule kinetic measurements of how the competition between exponential amplification of RNA molecules and their linear degradation affects both the “rate” and “fate” of amplification, and shows how such competition can be used to design assays for rapid genotyping of the hepatitis C virus.
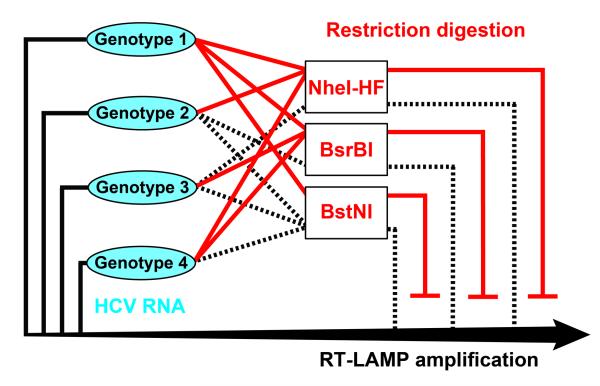
A wide range of diagnostic solutions for global health are urgently needed,[1] including for HCV, which infects 130-170 million people worldwide.[2] These patients can now be treated with recently approved small-molecule drugs,[3] which replace or reduce interferon therapy, but genotyping is still required to determine the treatment each patient should receive. However, most of these patients or their primary care doctors are located in limited-resource settings. High-complexity molecular tests such as commercially available HCV genotyping assays are not well suited for such settings (see SI). Therefore, a rapid (<1 hr), robust, and simple system for genotyping remains an unmet need. HCV genotypes differ by sets of mutations, with overlap between sequences of some but not all genotypes. Instead of attempting to design a separate detection reaction for each genotype, we wished to test whether we could design a competition reaction network (Figure 1): the detection for multiple HCV genotypes takes place in a single core amplification reaction, and the specificity for genotypes is achieved by the competing sequence-specific inhibition reactions.
Figure 1.
Schematic of a network based on competition between amplification (solid black lines and arrow) and inhibition (solid red). Any one of four HCV genotypes could be independently amplified by one RT-LAMP reaction and inhibited specifically by different restriction digestion reactions. When the restriction enzyme (RE) is specific to that genotype, it produces an inhibition feedback to the amplification (solid red). When the RE is not specific to the genotype, there is no inhibition even in the presence of RE (dashed black).
The use of competition among reactions to achieve regulation is common in biological systems; in our personal favorite example of the blood coagulation cascade,[4] the core autocatalytic amplification cascade is held in check by multiple inhibitors. Here, we wished to use a competition system consisting of reverse transcription loop-mediated isothermal amplification (RT-LAMP) as the amplification reaction, and restriction enzyme (RE) digestion as the inhibition reaction. Single-molecule, or “digital”[5] LAMP[6] is attractive for quantification under limited-resource settings due to its high intensity fluorescent output with calcein chemistry.[7] Digital RT-LAMP for the quantification of human immunodeficiency virus RNA was shown to be robust to perturbations in reaction conditions, imaging, temperature, and automatic cloud-based analysis, enabling robust cell phone–based quantification.[7b] In this work, we used RT-LAMP primers (see Table S1 in Supporting Information (SI)) modified from previous work targeting the conserved 5′-untranslated region (5′UTR) of HCV.[8] RE-based digestion is a reliable method to recognize specific nucleic acid sequences of multiple letters in length and cleave at specific sites.[9] We hypothesized that RE digestion could be used to compete with RT-LAMP amplification in situ in both bulk and digital formats.
Although the kinetics of single-molecule amplification has been studied for some reactions such as enzymatic turnover of a substrate [5b] or digital PCR,[5a] it has not been studied for sequence-specific isothermal amplification reactions, especially when competing reactions are involved. Therefore, before we could test this idea, we first had to answer three fundamental questions: i) How significant is the heterogeneity in the rate of digital RT-LAMP amplification? We expected some heterogeneity because LAMP itself has a complex mechanism, and RT-LAMP introduces an additional reverse transcription step from RNA molecules with heavy secondary structures. ii) Would introduction of RE affect the rate, or the fate, of digital RT-LAMP amplification (Figure 2A)? For simplicity, here we defined “rate” as the inverse of the “time-to-positive,” or time it takes the amplification to produce a particular level of a signal; competition from RE could decrease the rate of amplification by consuming some of the amplification products. We defined “fate” as whether or not amplification ultimately succeeds to provide that level of signal from a single molecule. For example, in the RT-LAMP/RE mechanism (Figure 2B), one fate-determining step could occur once the first double-stranded DNA (dsDNA) is formed (structure (1) in Figure 2B): either RE can bind to the strand and cleave it, or primer annealing followed by polymerase binding could lead to the formation of the double-looped template that can be further amplified. Such stochastic fate determination could also occur elsewhere during the early stages of the reaction as long as the number of molecules remains small. iii) Would this competition affect the bulk reaction differently from the single-molecule reactions? Given that this reaction system has significant nonlinearity, it is predicted[10] to be affected by the spatial distribution and compartmentalization.
Figure 2.
Schematic overview of the definition of “fate” and “rate” in general (a) and specifically for the competition between RT See text for details.
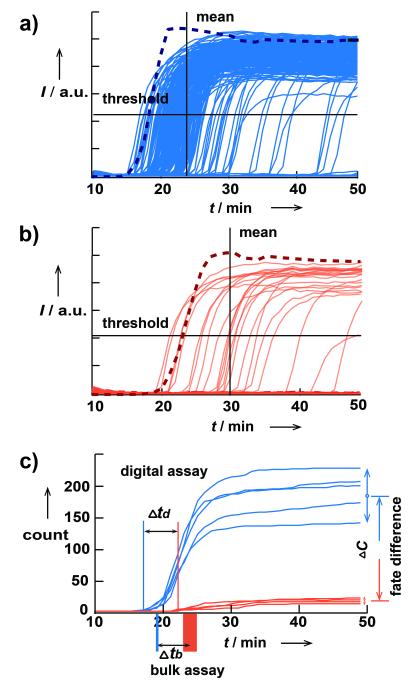
To answer the first two questions, we performed real-time digital RT-LAMP/RE experiments with HCV genotype 1 (GT1) RNA and BsrBI as the RE. HCV GT1 isolate was obtained commercially and sequenced after RNA purification to confirm the genotype assignment (Table S2 in SI). BsrBI cuts dsDNA at sequences CCGCTC, and this sequence exists in the RT-LAMP amplicon of GT1 RNA. With negative control experiments, we identified the highest possible BsrBI concentration that did not trigger ab initio DNA synthesis within the time of interest under reaction conditions (Figure S1 in SI).[11] The concentration was determined by performing a RE dilution experiment in the presence of all RT-LAMP components except HCV RNA and choosing the concentration for which ab initio synthesis was not observed within 50 min. We used a SlipChip microfluidic device (Figure S2 in SI) modified based on previous publication[6b] to compartmentalize the reaction mixture and monitored the progress of amplification for each single molecule using a CCD-based imaging system (Figure 3). Even in the amplification reaction in the absence of the RE, we found significant heterogeneity among rates of amplification of different molecules (Figure 3A). Addition of BsrBI did not abolish this heterogeneity (Figure 3B). On average, even though the rates of the reactions decreased upon addition of BsrBI, the shift in reaction times (approximately 5 min, for the first well that turned positive) was small relative to the width of the distribution of the reaction times (over 30 min). On the other hand, the fate of single-molecule amplification did change significantly upon addition of BsrBI: ~10-fold fewer molecules gave rise to successful amplification (with a p-value of 0.00033), indicating that in digital RT-LAMP, BsrBI affects fate more than it affects rate.
Figure 3.
Results of real-time, single-molecule digital RT-LAMP/RE experiments for HCV RNA. (a), (b) Graphs showing 1280 fluorescence traces for the RT-LAMP amplification process of all the wells on a SlipChip device (solid light blue) and normalized averaged fluorescence curve in bulk (dashed dark blue) in the absence of RE (a) and the traces for digital (solid light red) and for bulk (dashed dark red) in the presence of RE BsrBI (b) (see Figure S4 in SI for bulk data details). Horizontal solid lines indicate the threshold levels to consider a well positive. Vertical solid lines show the mean of the time-to-positive distribution. The scales in (a) and (b) are the same. (c) Graph showing the change of cumulative counts over time for wells exceeding the threshold in (a), blue, and (b), red (see Figure S5 in SI for histogram over time). The two bars below the x-axis show time-to-positive for real-time bulk experiments, the widths of which stand for standard deviation for the bulk assay (n=5).
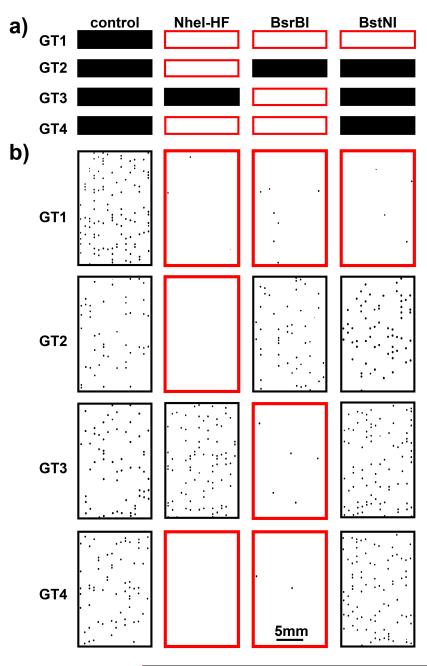
To answer the third question, we performed the same competition experiments in the bulk real-time format using an RNA concentration of ~3.3×10⁵ copies/mL (estimated based on digital RT-LAMP results), equivalent to the concentration of a single molecule in a 3 nL well. Without BsrBI, the reaction in this bulk experiment was approximately 5 min faster than the mean amplification time in the corresponding digital experiment (Figure 3A); it was closer to the time of the amplification of the first molecule (approximately 2 min slower) (Figure 3C). Upon addition of BsrBI, the bulk reaction showed increased variance and slowed down by Δtb = 4.9 ±1.9 min (Figure 3C); this delay was similar to the delay of the time-to-positive of the first molecule in the digital format, Δtd = 4.2 ± 1.1 min (Figure 3C). These data suggest that once exponential amplification of some molecules takes off, this process dominates the reaction mixture and is not affected by the amplification of the molecules that amplify later in the digital format—the bulk reaction has ended by then. In other words, the bulk experiment is dominated by the rate of amplification of the earliest molecules, and not sensitive to the fate of the rest of the molecules. We then tested if this concept could be applied to perform HCV genotyping. Our goal was not to validate a genotyping assay with a broad panel of clinical samples from across the globe. Instead, we wished to understand whether a proof-of-concept experiment was possible, and therefore we focused on HCV samples of the four most common genotypes in the USA[12] which were readily available to us from commercial sources (see Experimental section in SI). Sequencing results of the 5′UTR of these samples confirmed their genotype assignment(Table S2 in SI). Based on consensus obtained by aligning sequences of each genotype obtained from LANL[13], three REs thermostable under RT-LAMP conditions were chosen to target the sequence differences between these four genotypes within the RT-LAMP amplicon. NheI-HF (targeting GCTAGC) should recognize genotypes 1, 2, and 4; BsrBI (targeting CCGCTC) should recognize genotypes 1, 3, and 4; and BstNI (targeting CCWGG) should recognize only GT1 (Figure 4A). We have confirmed that under LAMP conditions these three enzymes remained active and sequence specific (Figure S3 in SI); such tests should be performed if additional REs are included. Because one RE can probe multiple genotypes, in principle unambiguous genotyping panels can be designed with fewer reactions than genotypes (e.g., three REs to differentiate four genotypes here). We note that this approach is well-suited for probing multiple mutations within the same amplification region; alternatively, several amplification reactions can compete with several cleavage reactions for higher multiplicity.
Figure 4.
(a) Predicted HCV genotyping pattern based on REs used and (b) photographs (inverted intensity) of end-point digital experimental genotyping results (only a part of each chip is shown). The first column in both sections represents the positive control in the absence of RE and the following three columns indicate experiments with different REs. Each row represents a genotype (GT) of HCV RNA. Red frame indicates predicted inhibition.
For each genotype, we performed four digital experiments: one positive control without RE, and three experiments with one RE each. The positive control also provided a measurement of the viral load and validation for performing digital experiments (see Table S3 in SI). The experimental results (Figure 4B) agreed with the inhibition pattern predicted (Figure 4A). Amplification of GT1 was inhibited by all three REs; amplification of GT2 was inhibited by NheI-HF only; amplification of GT3 was inhibited by BsrBI; and amplification of GT4 was inhibited by NheI-HF and BsrBI. The fate of molecules for each combination was dependent somewhat on the RE being used, but in all cases the inhibition was strong and statistically significant (Figure 5B).
Figure 5.
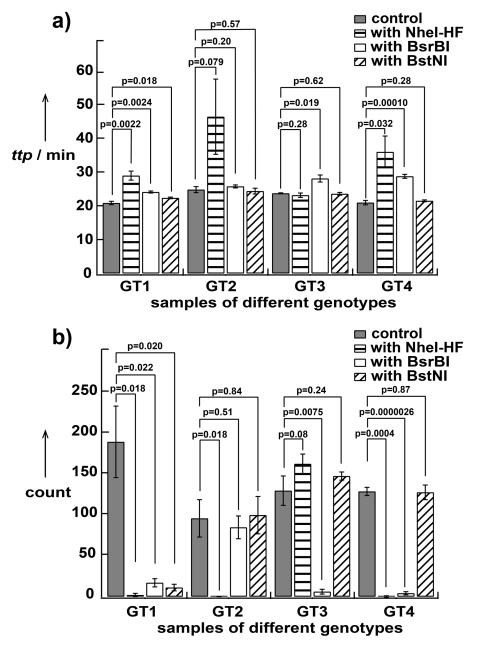
Graphs showing a comparison of HCV genotyping results using (a) real-time bulk assay (ttp: time-to-positive) and (b) end-point digital assay (n=3).
We then compared the performance of this HCV genotyping approach in a digital format to that in a real-time bulk format (Figure 5). Experimental repeats were performed on different days to ensure these experiments were not merely technical replicates. Both formats agreed with the prediction shown in Figure 4A. In the digital format (Figure 5B), reactions with RE specific to the genotype showed reduced counts by at least 10 fold, giving statistically significant results (p < 0.022). In the bulk format (Figure 5A), reactions with RE that are specific to the genotype were all delayed by a certain amount of time ranging from 2 min (~10% relative to time-to-positive of positive control) to 20 min (~100% relative to time-to-positive of positive control). Acceptable p-values were obtained for three of the four genotypes (p = 0.079 for GT2 and p < 0.032 for others). As the strength of inhibition by the RE increased, (e.g., NheI-HF in Figure 5B), in digital, lower counts and smaller p-values were observed. Paradoxically, stronger inhibition by RE in real-time bulk experiments led to a larger variation of reaction times and therefore did not improve p-values. Presumably, strong inhibition brings bulk amplification into the stochastic regime; this connection between digital “fate” and bulk “rate” deserves to be investigated further.
Here, we performed real-time kinetic measurements of competition between two reactions at the single-molecule level, and found that this competition affects both the rate and fate of single-molecule amplification. We observed significant heterogeneity in the rate of amplification of individual molecules, both in RT-LAMP amplification of HCV RNA, and in its competition with REs. We found that the introduction of the RE impacts both the rate and the fate of single-molecule amplification. We found a difference in how this competition is reflected in the readouts we used. Both fate and rate can be measured with real-time digital experiments. End-point digital experiments ignore the rate and measure fate, while bulk real-time experiments ignore the fate and rate of the majority of molecules and instead measure the rate and fate of the early amplification events. We demonstrated that both of these simplified measurements could in principle be used to derive genotype information from the competition of amplification and RE digestion. The advantage of the real-time methodology is that it is well-established and does not require development of microfluidic devices. We, however, prefer the end-point digital format for limited-resource settings: it does not require complex instrumentation for performing kinetic measurements; it is expected to be robust to fluctuation in conditions (although this robustness remains to be studied for competition reactions);[7b, 14] and it can be read-out with a cell phone,[1a, 7b] which we confirmed here as well (Figure S6 in SI). Although not described here, research is underway to integrate this method with user-friendly sample preparation techniques to enable full deployment in limited-resource settings. Further, the end-point digital format gives viral load information directly in the control—although, while digital amplification is often claimed to provide absolute concentration, determining the true concentration of molecules requires carefully measuring and adjusting for the efficiency of the processing and amplification, which we have not investigated in this manuscript. For genotyping, absolute measurements are not required, as only the magnitude of the decrease of digital counts upon introduction of the RE needs to be measured, which essentially sets the requirement for resolution of the platform used. For a specific digital device, resolution and dynamic range (i.e., the range of viral concentrations over which the genotyping measurement can be reliably performed on a given device) are in balance with one another—the lower the requirement for resolution, the larger dynamic range it has. For example, in a published multivolume SlipChip[15] device, the dynamic range for 5-fold resolution is 67 to 2×10⁷ copies/ mL. In this RT-LAMP/RE system, the requirement for resolution is only 10 fold and a better inhibition chemistry would further lower the required resolution, and increase the dynamic range, of the digital measurement. The results presented in this paper raise a number of additional questions: What is the right theoretical framework within which to analyze both rate and fate in single-molecule competition reactions? What are the molecular details of the mechanisms responsible for fate and rate determination in such systems? Can robustness of output of these systems be predicted a priori? What are the best amplification and inhibition chemistries with which to implement such competition reactions for genotyping and other genetic analyses?
Supplementary Material
Footnotes
[**] This research was supported by NIH grant R01EB012946, NIH grant 5DP1OD003584, and NIH/NRSA training grant 5T32GM07616. We thank T. Schlappi for data analysis, A. Tucker-Schwartz for helpful discussions, and Whitney Robles for contributions to editing this manuscript.
R.F.I. has a financial interest in SlipChip Corp.
This paper is dedicated to George M. Whitesides in honor of his 75th birthday.
References
- [1] a).Martinez AW, Phillips ST, Carrilho E, Thomas SW, 3rd, Sindi H, Whitesides GM. Anal. Chem. 2008;80:3699–3707. doi: 10.1021/ac800112r. [DOI] [PMC free article] [PubMed] [Google Scholar]; b) Martinez AW, Phillips ST, Whitesides GM, Carrilho E. Anal. Chem. 2009;82:3–10. doi: 10.1021/ac9013989. [DOI] [PubMed] [Google Scholar]; c) Whitesides GM. Clin. Chem. 2013;59:589–591. doi: 10.1373/clinchem.2013.204347. [DOI] [PubMed] [Google Scholar]
- [2].Lavanchy D. Clin. Microbiol. Infect. 2011;17:107–115. doi: 10.1111/j.1469-0691.2010.03432.x. [DOI] [PubMed] [Google Scholar]
- [3].Sheridan C. Nat. Biotechnol. 2014;32:3–5. doi: 10.1038/nbt0114-3. [DOI] [PubMed] [Google Scholar]
- [4] a).Runyon MK, Johnson-Kerner BL, Ismagilov RF. Angew. Chem. Int. Ed. Engl. 2004;43:1531–1536. doi: 10.1002/anie.200353428. [DOI] [PubMed] [Google Scholar]; Angew. Chem. 2004;116:1557–1562. [Google Scholar]; b) Kastrup CJ, Runyon MK, Shen F, Ismagilov RF. Proc. Natl. Acad. Sci. USA. 2006;103:15747–15752. doi: 10.1073/pnas.0605560103. [DOI] [PMC free article] [PubMed] [Google Scholar]
- [5] a).White RA, 3rd, Blainey PC, Fan HC, Quake SR. BMC Genomics. 2009;10:116. doi: 10.1186/1471-2164-10-116. [DOI] [PMC free article] [PubMed] [Google Scholar]; b) Rissin DM, Kan CW, Campbell TG, Howes SC, Fournier DR, Song L, Piech T, Patel PP, Chang L, Rivnak AJ, Ferrell EP, Randall JD, Provuncher GK, Walt DR, Duffy DC. Nat. Biotechnol. 2010;28:595–599. doi: 10.1038/nbt.1641. [DOI] [PMC free article] [PubMed] [Google Scholar]
- [6] a).Gansen A, Herrick AM, Dimov IK, Lee LP, Chiu DT. Lab Chip. 2012;12:2247–2254. doi: 10.1039/c2lc21247a. [DOI] [PMC free article] [PubMed] [Google Scholar]; b) Sun B, Shen F, McCalla SE, Kreutz JE, Karymov MA, Ismagilov RF. Anal. Chem. 2013;85:1540–1546. doi: 10.1021/ac3037206. [DOI] [PMC free article] [PubMed] [Google Scholar]
- [7] a).Tomita N, Mori Y, Kanda H, Notomi T. Nat. Protoc. 2008;3:877–882. doi: 10.1038/nprot.2008.57. [DOI] [PubMed] [Google Scholar]; b) Selck DA, Karymov MA, Sun B, Ismagilov RF. Anal. Chem. 2013;85:11129–11136. doi: 10.1021/ac4030413. [DOI] [PMC free article] [PubMed] [Google Scholar]
- [8].Kargar M, Askari A, Doosti A, Ghorbani-Dalini S. Indian J. Virol. 2012;23:18–23. doi: 10.1007/s13337-012-0067-2. [DOI] [PMC free article] [PubMed] [Google Scholar]
- [9].Nathans D, Smith HO. Annu. Rev. Biochem. 1975;44:273–293. doi: 10.1146/annurev.bi.44.070175.001421. [DOI] [PubMed] [Google Scholar]
- [10].Pompano RR, Li H-W, Ismagilov RF. Biophys. J. 2008;95:1531–1543. doi: 10.1529/biophysj.108.129486. [DOI] [PMC free article] [PubMed] [Google Scholar]
- [11].Liang X, Jensen K, Frank-Kamenetskii MD. Biochemistry. 2004;43:13459–13466. doi: 10.1021/bi0489614. [DOI] [PubMed] [Google Scholar]
- [12].Blatt LM, Mutchnick MG, Tong MJ, Klion FM, Lebovics E, Freilich B, Bach N, Smith C, Herrera J, Tobias H, Conrad A, Schmid P, McHutchison JG. J. Viral Hepat. 2000;7:196–202. doi: 10.1046/j.1365-2893.2000.00221.x. [DOI] [PubMed] [Google Scholar]
- [13]. [accessed March 5, 2014];The Los Alamos Hepatitis C Virus Sequence Database. http://hcv.lanl.gov/content/index.
- [14].Shen F, Davydova EK, Du W, Kreutz JE, Piepenburg O, Ismagilov RF. Anal. Chem. 2011;83:3533–3540. doi: 10.1021/ac200247e. [DOI] [PMC free article] [PubMed] [Google Scholar]
- [15].Shen F, Sun B, Kreutz JE, Davydova EK, Du W, Reddy PL, Joseph LJ, Ismagilov RF. J. Am. Chem. Soc. 2011;133:17705–17712. doi: 10.1021/ja2060116. [DOI] [PMC free article] [PubMed] [Google Scholar]
Associated Data
This section collects any data citations, data availability statements, or supplementary materials included in this article.


