

Abstract
Addition of the CCR5 inhibitor Maraviroc (MVC) to ongoing antiretroviral therapy increases CD4+ T cell counts in some virologically suppressed patients with suboptimal CD4+ T cell recovery. To understand the mechanisms by which MVC elicits increases in CD4+ T cell counts, the present study was undertaken to identify host factors (i.e. genes) that are modulated and are correlated with CD4+ T cell recovery during the 24 weeks of MVC intensification in 32 subjects. Median changes of CD4+ T cell counts over 24 weeks of MVC compared to baseline were 38 cells/mm3 (p < 0.001). The median slope of CD4+ T cell recovery was 39 cells/mm3 per year before initiation of MVC and 76 cells/mm3 per year during MVC intensification, however, this increase was not statistically significant (p = 0.33). Microarray analysis (N = 31,426 genes) identified a single differentially expressed gene, tumor necrosis factor alpha (TNF), which was modestly (1.44-fold, p < 0.001) downregulated by MVC at week 24 compared to baseline. TNF differential expression was evaluated using an independent method of droplet digital PCR, but the difference was not significant (p = 0.6). Changes in gene expression did not correlate with CD4+ T cell recovery or any changes in the CD4+ T cell maturation, proliferation and activation phenotypes. In summary, our data suggest that modest improvements of CD4+ T cell counts during MVC intensification cannot be explained by changes in gene expression elicited by MVC. However, the modest changes in T cell composition, including reduction of the percentages of Tregs, proliferating CD4+ T cells and senescent CD8+ T cells, suggest immunologically favorable effects of MVC.
Keywords: HIV, CCR5 inhibitors, Maraviroc, Gene expression, CD4+ T cell recovery
1. Introduction
Suboptimal CD4+ T cell recovery during potent antiretroviral therapy (ART) is a common clinical dilemma with an incidence as high as 40% (Dronda et al., 2002; Florence et al., 2003; Goicoechea et al., 2006; Kaufmann et al., 2003) that can have detrimental clinical consequences (Grabar et al., 2000), including an increased rate of HIV associated infections, malignancies, and cardiovascular morbidity and mortality. Among ART-naïve subjects treated with either efavirenz or MVC, those receiving MVC experienced significantly greater CD4+ T cell recovery (mean CD4+ T cell gain: 170 vs 144 cells/mm3) (Cooper et al., 2010). In ART-experienced subjects with ongoing viral replication, administration of MVC for 24 weeks resulted in significantly greater CD4+ T cell recovery than background ART alone despite similar reductions in viral load (Saag et al., 2009). In the setting of viral suppression, addition of MVC to a suppressive regimen modestly improved CD4+ T cell counts over 24 week of intensification (12 cells/mm3 increase) (Wilkin et al., 2012). A very modest improvement in CD4+ T cell slope over 24 weeks also occurred in a similar intensification trial (Cuzin et al., 2012). Other studies however, have failed to demonstrate a positive response (Hunt et al., 2013). Our understanding of host gene interactions with HIV during ART and the impact on CD4+ T cell recovery is at an early stage. Genomic chip arrays were used to screen approximately 12,000 human genes of which ~200 genes’ expression appeared to be modified in response to initiation of ART (Li et al., 2004). Genes involved in T cell apoptosis, immune activation and some chemokines and cognate receptors (i.e. CCR5, MIP-1β, RANTES and others) were down-regulated, while genes involved in tissue repair and remodeling were up-regulated. Massanella and colleagues (Massanella et al., 2013) used a paired design to identify an order of magnitude more genes responsive to ART than previously recognized. In vitro MVC binds CCR5 receptors without inducing intracellular signaling or altering cell-surface expression (Dorr et al., 2005). However, the host response to MVC in HIV-infected patients whose virus has already been suppressed by other therapies is unknown. We sought to identify host factors (i.e. genes) that are modulated by MVC in HIV-infected individuals with sub-optimal CD4+ T cell recovery and to evaluate the association of gene expression changes with CD4+ T cell recovery. Secondary objectives included evaluation of T cell composition changes in response to MVC. A paired study design was adopted to increase power in evaluating gene expression changes induced by MVC added to the stable first-line ART regimen.
2. Materials and methods
2.1. Study design and subjects
CCTG 590 is a single-arm, open-label study to evaluate the impact of therapy intensification with the CCR5 inhibitor MVC added to a stable suppressive HIV antiretroviral regimen on the rate of CD4+ T cell recovery and gene expression profiles. The study was approved by local institutional review boards at each of the participating CCTG sites, and registered under the ClinicalTrials.gov Identifier NCT00925756. Subjects ages 18 years and older were recruited from primary care clinics at each of the CCTG sites. All subjects provided written informed consent. For inclusion and exclusion criteria please refer to Supplementary materials and methods.
2.2. Intervention and collections
MVC was provided by ViiV Healthcare (Research Triangle Park, NC) and was dosed according to FDA-approved guidelines (Selzentry prescribing information). MVC was administered for the first 24 weeks of the study, followed by a 12 week washout phase. All historic plasma HIV-1 RNA levels and CD4+ T cell counts since the initiation of each subject’s first ART regimen and, where possible, documentation of the nadir CD4+ T cell count (defined as the last CD4+ T cell count prior to initiation of ART), were collected. Study visits occurred at weeks 0, 2, 4, 8, 12, 24 and 36. At each visit, CD4+ and CD8+ T cell counts and percentages were obtained. At baseline (week 0), week 4 and week 24 on MVC blood was collected for flow cytometry and gene expression analyses.
2.3. Assessment of CD4+ T cell recovery before and during MVC intensification
CD4+ T cell recovery was assessed by determining change in CD4+ T cell count over 24 weeks of MVC intensification and by comparing slopes of CD4+ T cell recovery before and after addition of MVC to baseline therapy. All CD4+ T cell counts collected in the last 2 years prior to screening visit were used. For CD4+ T cell recovery during MVC intensification, CD4+ T cell counts collected at baseline, week 2, week 4, week 8, week 12 and week 24 were used.
2.4. Flow cytometry
Maturation, activation and proliferation markers on CD4+ and CD8+ T cells were measured from fresh whole blood using panels of antibodies obtained from BD Biosciences, Inc. (San Diego, CA). Maturation was assessed by the loss of CD27 and CD28 receptors and separately by expression of CD62L and CD45RA surface markers. Activation was assessed by expression of CD38 and HLA-DR surface markers. Ki67 marker was used to measure proliferation. Regulatory T cells (Tregs) were measured using CD25+ CD127- marker.
2.5. RNA isolation and microarrays
RosetteSep kit (StemCell Technologies, Inc., Vancouver, Canada) was used to isolate CD4+ T cells from 32 mL of fresh whole blood per manufacturer’s instructions. RNA was extracted using Qiagen RNeasy mini kit (Qiagen Inc., Valencia, CA) per manufacturer’s instructions. RNA concentration was determined using a NanoDrop 1000 (Thermo Fisher Scientific, Wilmington, DE). RNA quality was assessed by 260/280 ratio (>1.8) and by measuring RNA integrity number (RIN) using Agilent 2100 Bioanalyzer (Agilent Technologies Inc., Santa Clara, CA). For samples with sufficient RNA yields (>100 ng) and 260/280 ratios >1.8, RINs were acceptable for microarray analysis (average 9.8, standard deviation 0.3). cRNA preparations and hybridizations to Illumina HT12 beadchips version 4 (Illumina, San Diego, CA) (47,324 probes corresponding to 31,426 unique genes) were performed by Expression Analysis, Inc. (Durham, NC). One hundred nanograms of total RNA were used as starting material. Gene expression data are available at the Gene Expression Omnibus (http://www.ncbi.nlm.nih.gov/geo/) under accession number GSE56804.
2.6. Statistical analyses
Wilcoxon signed rank test was used to assess changes in T cell counts, percentages, CD4+ T cell recovery slopes and changes in T cell phenotypes measured by flow cytometry. Plots were produced using GraphPad Prism version 6.00 for Windows, GraphPad Software, La Jolla California USA, www.graphpad.com. The proportion tests were performed using prop.test in the R statistical computing environment 2.13.2 (R Developmental Core Team, 2011).
Microarray quality control and data pre-processing was performed as previously described (Beliakova-Bethell et al., 2014). Technical batches associated with sample processing at three different recruitment sites were adjusted using ComBat (Johnson et al., 2007). Repeated measures (RM) ANOVA (Beliakova-Bethell et al., 2014) was used to identify genes whose expression changed over the course of MVC administration. Multivariate permutation tests under default settings (80% confident no more than 10% false positives) were performed using BRB-Array Tools (Simon et al., 2007). Gene assignment to temporal profiles was performed using a nonparametric clustering algorithm in Short Time-series Expression Miner (STEM) (Ernst and Bar-Joseph, 2006). Please refer to Supplementary materials and methods for further details on using STEM.
Expression of genes identified in the ANOVA, permutation t-test and STEM analyses of microarray data was correlated with CD4+ and CD8+ T cell counts and percentages, and the T cell activation markers that were measured by flow cytometry over the MVC intensification time course. For these analyses, changes over 4 and 24 weeks on MVC were correlated for each variable. Spearman’s rank correlation analysis was used to test whether correlations are equal to zero or not.
2.7. Droplet digital PCR (ddPCR)
One gene whose expression differed significantly between week 24 and baseline (week 0) as assessed by multivariate permutation test (tumor necrosis factor alpha, official gene symbol TNF) was selected for further validation by ddPCR using the QX100 system (Bio-Rad, Hercules, CA) as described previously (Beliakova-Bethell et al., 2014; Massanella et al., 2013). Please refer to the Supplementary materials and methods for details.
3. Results
3.1. Subjects characteristics and safety
A total of 32 subjects were enrolled in the study (Fig. 1), 8 at UCSD, 15 at UCLA and 9 at USC. Their baseline characteristics and MVC dosing are shown in Table 1. For the 25 of 32 subjects with adequate documentation, the median nadir CD4+ T cell count was 19 (IQR =7–44). All subjects completed the study follow-up.
Fig. 1.
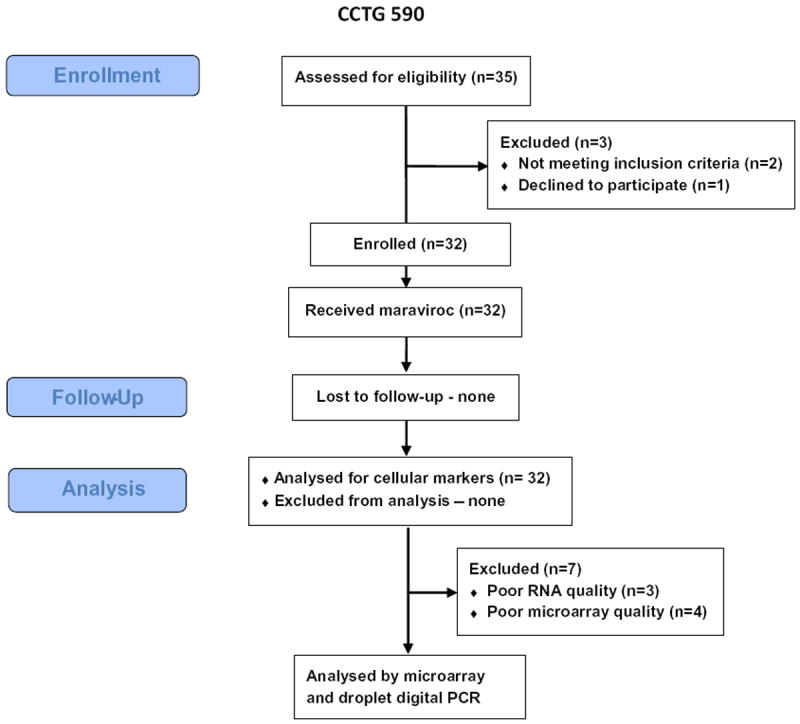
CONSORT diagram showing study design.
Table 1.
Subject characteristics. Values are means (±standard deviation) except where noted.
| Subject characteristics, unit | Value |
|---|---|
| N | 32 |
| Age, years | 48.9 ± 9.7 |
| Male sex, N (%) | 28 (87.5) |
| Race/Ethnicity, N (%) | |
| White, not Hispanic | 7 (21.9) |
| Black | 2 (6.3) |
| White Hispanic | 21 (65.6) |
| Other | 2 (6.3) |
| Route of HIV acquisition, N (%) | |
| Homosexual contact | 14 (43.8) |
| Heterosexual contact | 15 (46.9) |
| Homo/Heterosexual contact | 1 (3.1) |
| Injection drug use | 1 (3.1) |
| Blood products | 1 (3.1) |
| Prior AIDS diagnosis, N (%) | 21 (65.6) |
| Total time on ART, months | 52 ± 40 |
| Total time on baseline ART regimen, months | 33 ± 24 |
| ART regimen | |
| NNRTI-based | 20 (62.5) |
| NNRTI/PI-based | 1 (3.1) |
| PI-based | 11 (34.4) |
| Maraviroc dosage | |
| 150 mg twice daily | 12 (37.5) |
| 300 mg twice daily | 2 (6.3) |
| 600 mg twice daily | 18 (56.3) |
| aUndetectable HIV RNA, N (%) | 32 (100) |
| Active hepatitis B or C, N (%) | 0 (0) |
| Baseline CD4+ T cells/mm3, median (interquartile range) | 215 (180, 263) |
ART – antiretroviral therapy, NNRTI – nonnucleoside reverse transcriptase inhibitor, PI – protease inhibitor.
Viral load was considered undetectable when less than 50 copies RNA/mL using Roche Amplicor or less than 75 copies/mL using Bayer bDNA.
MVC intensification was well tolerated. Apart from elevated bilirubin among subjects receiving atazanavir, only one serious adverse event occurred during study drug administration. This subject experienced transiently altered mental status, was hospitalized and had MVC stopped temporarily. Altered mental status did not recur upon rechallenge with MVC. No subject experienced virologic failure during the study.
3.2. Changes in CD4+ and CD8+ T cell counts during and following MVC intensification
CD4+ and CD8+ T cell counts gradually increased over 24 weeks of MVC intensification, and decreased at week 36 (12 week follow-up) compared to week 24, but were still elevated compared to baseline (Fig. 2A and B). Percent CD4+ T cells increased over 24 weeks (Figs. 2A and 3A) and did not decrease at follow-up (Fig. 2A). Percent CD8+ T cell counts increased over the time course on MVC (Figs. 2B and 3B), and at the follow-up these returned to baseline (Fig. 2B). The slope of CD4+ T cell recovery while on MVC increased (median 76 CD4+ T cells/mm3 per year) compared to slope prior to MVC (median 39 CD4+ T cells/mm3 per year), but the difference did not reach statistical significance (p = 0.33).
Fig. 2.
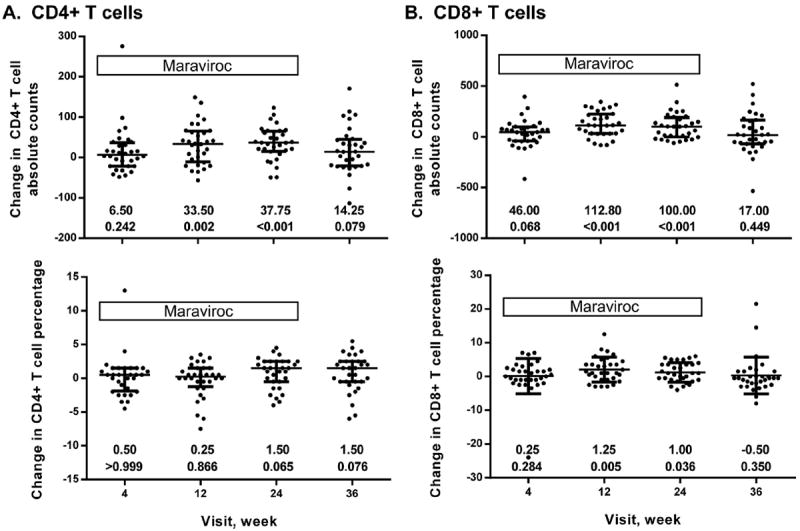
T cell counts and percentages in patients over the MVC intensification time course and follow-up after MVC discontinuation. CD4+ T cells absolute counts (top) and percentages (bottom) (A); CD8+ T cell absolute counts (top) and percentages (bottom) (B). Bars represent median with interquartile range. Median changes at each time point compared to baseline (week 0) and p-values as determined by Wilcoxon ranked sum test are shown underneath the graphs.
Fig. 3.
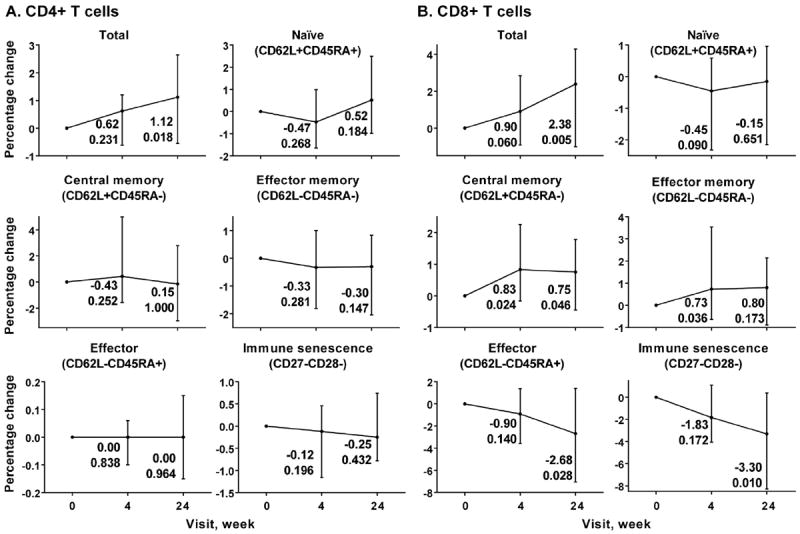
Flow cytometry analysis of maturation phenotypes of CD4+ (A) and CD8+ T cells (B) over MVC intensification time course. Each graph represents median percentage changes with interquartile range of each phenotype indicated compared to baseline, which was set to 0. The changes and p-values associated with these changes at weeks 4 and 24 are shown next to each time point. X axis, time points (week 0, week 4 and week 24). Y axis, change in percentage of each phenotype compared to baseline.
3.3. Analysis of maturation, activation and proliferation of CD4+ and CD8+ T cell subsets
We evaluated the impact of MVC intensification on immune activation, maturation and proliferation of CD4+ and CD8+ cells and their subsets during viral suppression. While there were no significant changes in CD4+ T cell maturation phenotypes (Fig. 3A), some differences were observed in case of CD8+ T cells (Fig. 3B). Percentages of the central memory CD8+ T cells (CD62L+CD45RA−) increased early during the MVC time course (week 4 p = 0.024, week 24 p = 0.046). Percentage of CD8+ effector memory cells (CD62L−CD45RA−) had similar pattern of increase, but did not reach significance at week 24 (week 4 p = 0.036, week 24 p = 0.173). On the other hand, percentages of the CD8+ effector cells (CD62L−CD45RA+, week 4 p = 0.140, week 24 p = 0.028) and cells harboring immune senescence phenotype (CD27−CD28−, week 4 p = 0.172, week 24 p = 0.010) decreased over 24 weeks on MVC.
Activation was assessed using CD38 and HLA-DR markers (Fig. 4). The only significant change observed with CD4+ T cells, was a transient increase of the percentage of CD4+CD38+HLA-DR+ cells at week 4 (p = 0.039) (Fig. 4A). On the other hand, more significant changes were observed in case of CD8+ T cells (Fig. 4B). Percentage of CD8+CD38+HLA-DR− decreased over the MVC intensification time course, which included total CD8+ T cells and their central memory and effector subsets. Percentages of CD8+CD38+HLA-DR+ cells tended to increase, but reached significance only in case of the central memory subset (week 4 p = 0.010, week 24 p = 0.039).
Fig. 4.
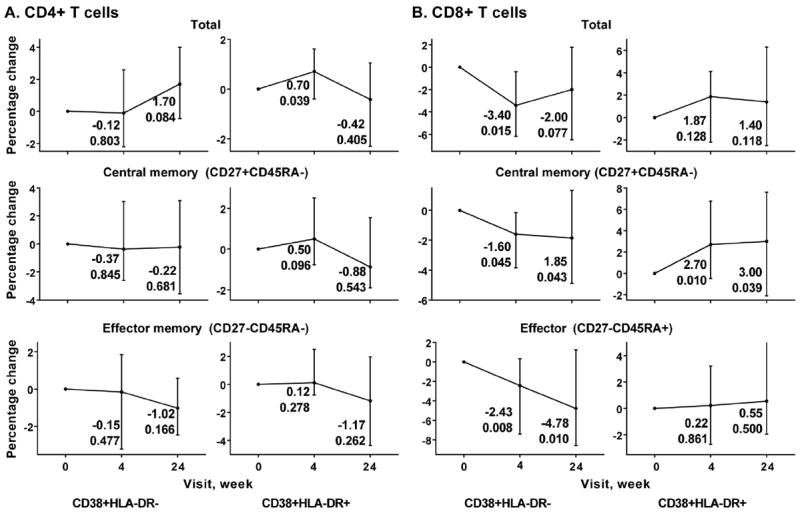
Flow cytometry analysis of activation phenotypes (CD38+HLA-DR− and CD38+HLA-DR+ as indicated underneath the graph) of CD4+ (A) and CD8+ T cells (B) over MVC intensification time course. Each graph represents median percentage changes with interquartile range for each phenotype indicated compared to baseline, which was set to 0. The changes and p-values associated with these changes at weeks 4 and 24 are shown next to each time point. X axis, time points (week 0, week 4 and week 24). Y axis, change in percentage of each phenotype compared to baseline.
Percentage of proliferating CD4+ T cells and double positive CD4+CD8+ T cells tended to decrease at week 24 of MVC intensification (p = 0.049 and p = 0.076 for CD4+ and CD4+CD8+ T cells, respectively), while percentage of proliferating CD8+ T cells transiently increased at week 4 (p = 0.001) (Fig. 5A). Total Tregs did not change at week 4 and significantly decreased at week 24 (p = 0.001) (Fig. 5B).
Fig. 5.
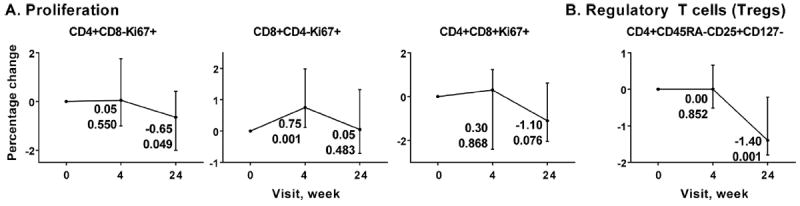
Flow cytometry analysis of proliferation phenotypes (A) and Regulatory T cells (Tregs, B) over MVC intensification time course. Each graph represents median percentage changes with interquartile range for each phenotype indicated compared to baseline, which was set to 0. The changes and p-values associated with these changes at weeks 4 and 24 are shown next to each time point. X axis, time points (week 0, week 4 and week 24). Y axis, change in percentage of each phenotype compared to baseline.
3.4. Gene expression profiling in CD4+ T cells
Based on RNA yields and quality assessment, samples from 3 of the 32 subjects were excluded from microarray study. Four outlier arrays as determined by microarray quality control were also excluded from the analysis. Thus, a total of 25 subjects (75 samples) were included. The characteristics between subjects included or excluded from microarray analysis were statistically similar. For initial analysis of MVC effects on gene expression over the time course, genes were filtered to minimize the number of multiple tests by excluding genes with low spread among samples. Filtering based on IQR being >0.5 resulted in a set of 3826 probes corresponding to 3301 unique genes. Even considering the 3826 probes with the highest variability among samples, the analysis showed minimal signal in the data, with all the genes essentially having the same expression level across the time points (p = 1), except for TNF (p = 0.805 for 4 weeks vs 24 weeks comparison). An independent analysis of gene expression using permutation paired t-tests in BRB-Array Tools identified a sole differentially expressed gene, TNF, between week 0 and week 24 of MVC and week 4 and week 24 of MVC (p < 0.001). At week 24, the expression of TNF was 1.44-fold lower compared to baseline and 1.54-fold lower compared to week 4.
A more sensitive method, ddPCR, was used to measure TNF expression in subjects over the time course. An RM ANOVA was conducted across time points. At week 24 of MVC intensification, TNF had 1.17-fold lower expression than at week 0 and this difference was not statistically significant (p = 0.6).
Of 25 subjects analyzed by microarrays, by week 24, 18 had increased CD4+ T cell counts, while 7 subjects had decreased CD4+ T cell counts. We hypothesized that those patients who had CD4+ T cell increases, had reduced TNF expression. Twenty-one subjects had declined TNF expression, while only 4 had TNF expression higher than at baseline. The proportion of patients with declined TNF was equal among those patients that increased vs decreased CD4+ T cell counts (1/6 vs 1/7, p = 1). Thus, subdividing subjects into groups according to CD4+ T cell recovery status did not identify a role for differential TNF gene expression. TNF expression also did not correlate with CD4+ T cell maturation, activation and proliferation phenotypes.
To ensure that the data was analyzed in all possible ways and none of the gene expression perturbations were missed in the course of the analyses, temporal gene expression profiling with STEM was utilized. In this approach, the differences in gene expression do not have to reach statistical significance; rather, a number of genes assigned to the same temporal profile should be greater than expected by chance for a profile to be considered significant. For example, all the genes whose expression increases over a time course would be mapped to one profile, while those with decrease in expression in the beginning and increase towards the end – to another. In our experiment, only two of the identified four profiles (Fig. 6) contained more than one gene, and only one profile was significant (p = 0.02). After adjustment for multiple testing, that one profile was no longer significant. Thus, the absence of signal in gene expression due to MVC intensification was confirmed by an independent method.
Fig. 6.
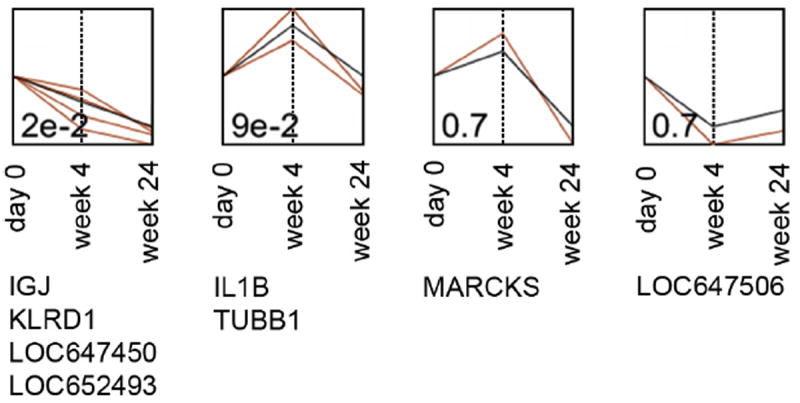
Temporal gene expression profiling using Short Time-series Expression Miner (STEM). Profile p-values (before multiple testing adjustment) are indicated in the left bottom corner of each profile. Profiles are ordered based on the significance of the number of genes assigned to the profile vs expected. Black lines represent temporal profiles; red lines show gene expression changes along MVC intensification time course. X axis, visit at which samples were collected for gene expression analysis. Y axis, relative units of gene expression change. Genes that mapped to each profile are listed underneath the profiles.
4. Discussion
The current study attempted to characterize the mechanisms of CD4+ T cell recovery incurred during MVC intensification at the level of CD4+ T cell transcriptome and by measuring expression of maturation, activation and proliferation markers on CD4+ and CD8+ T cells. Single arm studies of MVC in subjects with suboptimal CD4+ recovery have reported very modest increases in CD4+ T cell counts (Cuzin et al., 2012; Wilkin et al., 2012), while a placebo-controlled study reporting no difference with MVC (Hunt et al., 2013). We observed an increase in CD4+ T cell count of 37 cells/mm3 over 24 weeks, a value greater than previously reported (Cuzin et al., 2012; Hunt et al., 2013; Wilkin et al., 2012), which attenuated 12 weeks after MVC discontinuation. However, the slopes of CD4+ T cell recovery before and during MVC administration were not significantly different. As compared to the 2 studies that reported the slope of CD4 cell recovery prior to MVC intensification (Cuzin et al., 2012; Wilkin et al., 2012) our subjects had a greater pace of CD4+ T cell recovery prior to MVC, which likely explains the greater absolute gain in our study. Taken together, there is evidence for at best only a very modest and transient effect of MVC intensification on CD4+ T cell recovery.
In addition to evaluating CD4+ T cell recovery, this study also analyzed changes in CD4+ T cell composition during MVC intensification. No significant changes were observed in CD4+ T cell composition by maturation subsets (naïve, central memory, effector memory, effector and senescent CD4+ T cells). A small transient increase of activated CD4+ T cells (CD38+HLA-DR+) was observed early during MVC intensification (week 4), with return to baseline levels at week 24. An interesting observation of the present study was a significant decrease in the percentages of both proliferating Ki67+CD4+ T cells and Tregs, which occurred with a lag time after beginning of MVC intensification. While after 4 weeks of MVC percentages of both proliferating CD4+ T cells and Tregs did not differ from baseline, at week 24 they were decreased by 0.65% and 1.4%, respectively. Elevated percentages of proliferating CD4+ T cells and Tregs were previously implicated in inadequate immunologic response, despite successful virologic control, in HIV-infected patients on ART (Marchetti et al., 2006; Saison et al., 2014). Thus, even though increase in CD4+ T cell counts was modest in our study, MVC appeared to cause changes in CD4+ T cell type composition associated with immunologically favorable outcomes.
Profiling the entire transcriptome of the CD4+ T cells from patients administered MVC was the novel aspect of the present study. Contrary to our hypothesis, MVC did not appear to induce any significant changes in the CD4+ T cell transcriptome. In particular, only one gene, TNF, was identified as differentially expressed between week 0 and week 24 and week 4 and week 24 using multivariate permutation t-tests in BRB-Array Tools. TNF is upregulated in CD4+ T cells productively infected with HIV (Imbeault et al., 2012) and plays a role in apoptosis of CD4+ T cells during HIV infection (reviewed in Herbein and Khan, 2008). Moreover, single nucleotide polymorphisms in TNF were associated with CD4+ T cell recovery of HIV-infected patients on ART (Haas et al., 2006). Thus, the observed modest reduction of TNF expression in CD4+ T cells during MVC treatment might have contributed to modest improvement of CD4+ T cell recovery. However, TNF was not confirmed as differentially expressed either in the RM ANOVA analysis of microarrays or by ddPCR, a method independent of microarrays which is also considered to be more sensitive. Changes in TNF expression over 24 weeks on MVC did not correlate with changes in CD4+ T cells and changes in any of the CD4+ T cell maturation, activation and proliferation phenotypes tested. Moreover, temporal profiling of gene expression did not identify any significant profiles. Thus, the modestly increased CD4+ T cell counts on MVC could not be explained by changes in the CD4+ T cell transcriptome.
This study also evaluated the effect of MVC on CD8+ T cell counts and composition. Consistent with previous reports (Rusconi et al., 2013; Wilkin et al., 2012), increased CD8+ T cell counts during the MVC treatment were observed. Analysis of the maturation phenotypes indicated increase in percentages of central memory and effector memory cells and decrease in effector and senescent cells. There is some controversy concerning the effects of MVC intensification on CD8+ T cell activation phenotypes. For example, a number of reports (Cossarini et al., 2012; Cuzin et al., 2012; Wilkin et al., 2012) showed decreases in percentage of activated CD8+ T cells, while two more recent studies demonstrated no effect or increase (Hunt et al., 2013; Rusconi et al., 2013). In all these studies, the effect of MVC on CD38+HLA-DR+ or total CD38+ cells was evaluated. Our study differed from the previous studies by performing separate analyses of MVC effect on CD38+HLA-DR− and CD38+HLA-DR+ cells. Interestingly, the effect of MVC on activated CD8+ T cells of these two phenotypes appeared to be different: the percentage of CD38+HLA-DR−CD8+ T cells significantly decreased, while the percentage of CD38+HLA-DR+CD8+ cells slightly but insignificantly increased. In addition, we have demonstrated that central memory and effector subsets contributed to the observed changes in total activated CD8+ T cells. However, due to only small changes and large spread in the data, it is hard to infer clinically relevant effects from these observations. Among all the phenotypes tested, MVC had the greatest effect on CD8+ T cells of senescent phenotype (CD27−CD28−, 3.3% reduction by week 24). Higher percentages of CD8+CD27+CD28+ T cells (lacking senescent phenotype) were previously implicated as predictors of improved CD4+ T cell recovery following 12 months on ART (Seu et al., 2013). Thus, reduction of senescent CD8+ T cells by MVC in the present study may have contributed to the observed CD4+ T cell recovery.
A potential limitation of this study is the lack of receptor tropism testing; however, immunologic activity of MVC is thought to be independent of viral tropism (Corbeau and Reynes, 2009). Another limitation is that the key immune effects of MVC may be mediated by cell types other than the CD4+ T cell subset that were analyzed, such as cells of the innate immune system (Rossi et al., 2011). Finally, the present study did not have a placebo control arm. We believe, however, that because of variations in CD4+ T cell levels, the within-subjects design is more robust and less prone to identification of false positives.
In summary, our results indicate that changes in CD4+ T cell gene expression signature cannot explain the small increases in CD4+ T cell count in patients on MVC intensification therapy. However, the modest changes in T cell composition, including reduction of the percentages of Tregs, proliferating CD4+ T cells and senescent CD8+ T cells, suggest immunologically favorable effects of MVC.
Supplementary Material
Acknowledgments
We gratefully acknowledge the time and effort of the study participants, without which this study could not have been done. We also thank the research coordinators at each of the CCTG sites: Connie Funk, RN, MPH (University of Southern California), Linda Meixner, RN (UCSD), Angela Grbic, ACRN, BSN (Harbor-UCLA). The study was funded by the California HIV/AIDS Research Program (CHRP): MC08-SD-700 and EI-11-SD-005, ViiV Healthcare, and National Institutes of Health Grants AI 064086 (K24 to R.H.) and AI 36214 (CFAR Clinical Investigation and Biostatistics Core). N.B.B. was supported by Ruth L. Kirschstein National Research Service Award (NRSA) Institutional Research Training Grants (2T32AI007384-21A1). This material is based upon work supported in part by the Department of Veterans Affairs (VA), Veterans Health Administration, Office of Research and Development. The views expressed in this article are those of the authors and do not necessarily reflect the position or policy of the Department of Veterans Affairs or the United States government.
Abbreviations
- CCTG
The California Collaborative Treatment Group
- UCSD
University of California San Diego
- UCLA
University of California Los Angeles
- USC
University of Southern California
Glossary
- ANOVA
Analysis of variance
- ART
Anti-retroviral therapy
- CCR5
Chemokine (C–C motif) receptor 5
- ComBat
Software for normalizing microarray data after COMbining BATches
- ddPCR
Droplet digital polymerase chain reaction
- FDA
Food and Drug Administration
- HIV
Human immunodeficiency virus
- IQR
Interquartile range
- MIP-1β (CCL4)
Chemokine (C–C motif) ligand 4
- MVC
Maraviroc
- NNRTI
Nonnucleoside reverse transcriptase inhibitor
- PI
Protease inhibitor
- RANTES (CCR1)
Chemokine (C–C motif) receptor 1
- RIN
RNA integrity number
- RM ANOVA
Repeated Measures ANOVA
- STEM
Short Time-series Expression Miner
- TNF
Tumor necrosis factor alpha (official gene symbol)
- Tregs
Regulatory T cells
Footnotes
Appendix A. Supplementary data
Supplementary data associated with this article can be found, in the online version, at http://dx.doi.org/10.1016/j.antiviral.2014.04.005.
Contributor Information
Nadejda Beliakova-Bethell, Email: nbeliako@ucsd.edu.
Michael P. Dubé, Email: mdube@usc.edu.
References
- Beliakova-Bethell N, Massanella M, White C, Lada SM, Du P, Vaida F, Blanco J, Spina CA, Woelk CH. The effect of cell subset isolation method on gene expression in leukocytes. Cytometry A. 2014;85A:94–104. doi: 10.1002/cyto.a.22352. [DOI] [PMC free article] [PubMed] [Google Scholar]
- Cooper DA, Heera J, Goodrich J, Tawadrous M, Saag M, DeJesus E, Clumeck N, Walmsley S, Ting N, Coakley E, Reeves JD, Reyes-Teran G, Westby M, Van Der Ryst E, Ive P, Mohapi L, Mingrone H, Horban A, Hackman F, Sullivan J, Mayer H. Maraviroc versus efavirenz, both in combination with zidovudine–lamivudine, for the treatment of antiretroviral-naive subjects with CCR5-tropic HIV-1 infection. J Infect Dis. 2010;201:803–813. doi: 10.1086/650697. [DOI] [PubMed] [Google Scholar]
- Corbeau P, Reynes J. CCR5 antagonism in HIV infection: ways, effects, and side effects. AIDS. 2009;23:1931–1943. doi: 10.1097/QAD.0b013e32832e71cd. [DOI] [PubMed] [Google Scholar]
- Cossarini F, Galli A, Galli L, Bigoloni A, Salpietro S, Vinci C, Della Torre L, Gianotti N, Spagnuolo V, Lazzarin A, Castagna A, Nozza S. Immune recovery and T cell subset analysis during effective treatment with maraviroc. J Antimicrob Chemother. 2012;67:2474–2478. doi: 10.1093/jac/dks216. [DOI] [PubMed] [Google Scholar]
- Cuzin L, Trabelsi S, Delobel P, Barbuat C, Reynes J, Allavena C, Peytavin G, Ghosn J, Lascoux-Combe C, Psomas C, Corbeau P, Flandre P. Maraviroc intensification of stable antiviral therapy in HIV-1–infected patients with poor immune restoration: MARIMUNO-ANRS 145 study. JAIDS. 2012;61:557–564. doi: 10.1097/QAI.0b013e318273015f. [DOI] [PubMed] [Google Scholar]
- Dorr P, Westby M, Dobbs S, Griffin P, Irvine B, Macartney M, Mori J, Rickett G, Smith-Burchnell C, Napier C, Webster R, Armour D, Price D, Stammen B, Wood A, Perros M. Maraviroc (UK-427,857), a potent, orally bioavailable, and selective small-molecule inhibitor of chemokine receptor CCR5 with broad-spectrum anti-human immunodeficiency virus type 1 activity. Antimicrob Agents Chemother. 2005;49:4721–4732. doi: 10.1128/AAC.49.11.4721-4732.2005. [DOI] [PMC free article] [PubMed] [Google Scholar]
- Dronda F, Moreno S, Moreno A, Casado JL, Perez-Elias MJ, Antela A. Long-term outcomes among antiretroviral-naive human immunodeficiency virus-infected patients with small increases in CD4+ cell counts after successful virologic suppression. Clin Infect Dis. 2002;35:1005–1009. doi: 10.1086/342695. [DOI] [PubMed] [Google Scholar]
- Ernst J, Bar-Joseph Z. STEM: a tool for the analysis of short time series gene expression data. BMC Bioinformatics. 2006;7:191. doi: 10.1186/1471-2105-7-191. [DOI] [PMC free article] [PubMed] [Google Scholar]
- Florence E, Lundgren J, Dreezen C, Fisher M, Kirk O, Blaxhult A, Panos G, Katlama C, Vella S, Phillips A. Factors associated with a reduced CD4 lymphocyte count response to HAART despite full viral suppression in the EuroSIDA study. HIV Med. 2003;4:255–262. doi: 10.1046/j.1468-1293.2003.00156.x. [DOI] [PubMed] [Google Scholar]
- Goicoechea M, Smith DM, Liu L, May S, Tenorio AR, Ignacio CC, Landay A, Haubrich R. Determinants of CD4+ T cell recovery during suppressive antiretroviral therapy: association of immune activation, T cell maturation markers, and cellular HIV-1 DNA. J Infect Dis. 2006;194:29–37. doi: 10.1086/504718. [DOI] [PubMed] [Google Scholar]
- Grabar S, Le Moing V, Goujard C, Leport C, Kazatchkine MD, Costagliola D, Weiss L. Clinical outcome of patients with HIV-1 infection according to immunologic and virologic response after 6 months of highly active antiretroviral therapy. Ann Intern Med. 2000;133:401–410. doi: 10.7326/0003-4819-133-6-200009190-00007. [DOI] [PubMed] [Google Scholar]
- Haas DW, Geraghty DE, Andersen J, Mar J, Motsinger AA, D’Aquila RT, Unutmaz D, Benson CA, Ritchie MD, Landay A. Immunogenetics of CD4 lymphocyte count recovery during antiretroviral therapy: an AIDS clinical trials group study. J Infect Dis. 2006;194:1098–1107. doi: 10.1086/507313. [DOI] [PubMed] [Google Scholar]
- Herbein G, Khan KA. Is HIV infection a TNF receptor signalling-driven disease? Trends Immunol. 2008;29:61–67. doi: 10.1016/j.it.2007.10.008. [DOI] [PubMed] [Google Scholar]
- Hunt PW, Shulman NS, Hayes TL, Dahl V, Somsouk M, Funderburg NT, McLaughlin B, Landay AL, Adeyemi O, Gilman LE, Clagett B, Rodriguez B, Martin JN, Schacker TW, Shacklett BL, Palmer S, Lederman MM, Deeks SG. The immunologic effects of maraviroc intensification in treated HIVinfected individuals with incomplete CD4+ T-cell recovery: a randomized trial. Blood. 2013;121:4635–4646. doi: 10.1182/blood-2012-06-436345. [DOI] [PMC free article] [PubMed] [Google Scholar]
- Imbeault M, Giguere K, Ouellet M, Tremblay MJ. Exon level transcriptomic profiling of HIV-1 infected CD4+ T cells reveals virus-induced genes and host environment favorable for viral replication. PLoS Pathog. 2012;8:e1002861. doi: 10.1371/journal.ppat.1002861. [DOI] [PMC free article] [PubMed] [Google Scholar]
- Johnson WE, Li C, Rabinovic A. Adjusting batch effects in microarray expression data using empirical Bayes methods. Biostatistics. 2007;8:118–127. doi: 10.1093/biostatistics/kxj037. [DOI] [PubMed] [Google Scholar]
- Kaufmann GR, Perrin L, Pantaleo G, Opravil M, Furrer H, Telenti A, Hirschel B, Ledergerber B, Vernazza P, Bernasconi E, Rickenbach M, Egger M, Battegay M. CD4 T-lymphocyte recovery in individuals with advanced HIV-1 infection receiving potent antiretroviral therapy for 4 years: the swiss HIV cohort study. Arch Intern Med. 2003;163:2187–2195. doi: 10.1001/archinte.163.18.2187. [DOI] [PubMed] [Google Scholar]
- Li Q, Schacker T, Carlis J, Beilman G, Nguyen P, Haase AT. Functional genomic analysis of the response of HIV-1-infected lymphatic tissue to antiretroviral therapy. J Infect Dis. 2004;189:572–582. doi: 10.1086/381396. [DOI] [PubMed] [Google Scholar]
- Marchetti G, Gori A, Casabianca A, Magnani M, Franzetti F, Clerici M, Perno C-F, Monforte AdA, Galli M, Meroni L. Comparative analysis of T-cell turnover and homeostatic parameters in HIV-infected patients with discordant immune-virological responses to HAART. AIDS. 2006;20:1727–1736. doi: 10.1097/01.aids.0000242819.72839.db. [DOI] [PubMed] [Google Scholar]
- Massanella M, Singhania A, Beliakova-Bethell N, Pier R, Lada SM, White CH, Pérez-Santiago J, Blanco J, Richman DD, Little SJ, Woelk CH. Differential gene expression in HIV-infected individuals following ART. Antiviral Res. 2013;100:420–428. doi: 10.1016/j.antiviral.2013.07.017. [DOI] [PMC free article] [PubMed] [Google Scholar]
- R Developmental Core Team. R: A Language and Environment for Statistical Computing. R Foundation of Statistical Computing; Vienna, Austria: 2011. [Google Scholar]
- Rossi R, Lichtner M, De Rosa A, Sauzullo I, Mengoni F, Massetti AP, Mastroianni CM, Vullo V. In vitro effect of anti-human immunodeficiency virus CCR5 antagonist maraviroc on chemotactic activity of monocytes, macrophages and dendritic cells. Clin Exp Immunol. 2011;166:184–190. doi: 10.1111/j.1365-2249.2011.04409.x. [DOI] [PMC free article] [PubMed] [Google Scholar]
- Rusconi S, Vitiello P, Adorni F, Colella E, Focà E, Capetti A, Meraviglia P, Abeli C, Bonora S, D’Annunzio M, Biagio AD, Di Pietro M, Butini L, Orofino G, Colafigli M, d’Ettorre G, Francisci D, Parruti G, Soria A, Buonomini AR, Tommasi C, Mosti S, Bai F, Di Nardo Stuppino S, Morosi M, Montano M, Tau P, Merlini E, Marchetti G. Maraviroc as intensification strategy in HIV-1 positive patients with deficient immunological response: an Italian randomized clinical trial. PLoS One. 2013;8:e80157. doi: 10.1371/journal.pone.0080157. [DOI] [PMC free article] [PubMed] [Google Scholar]
- Saag M, Goodrich J, Fätkenheuer G, Clotet B, Clumeck N, Sullivan J, Westby M, van der Ryst E, Mayer H A4001029 Study Group. A double-blind, placebo-controlled trial of maraviroc in treatment-experienced patients infected with non-R5 HIV-1. J Infect Dis. 2009;199:1638–1647. doi: 10.1086/598965. [DOI] [PubMed] [Google Scholar]
- Saison J, Ferry T, Demaret J, Maucort Boulch D, Venet F, Perpoint T, Ader F, Icard V, Chidiac C, Monneret G Lyon HIV Cohort Study. Association between discordant immunological response to HAART, regulatory T cells percentage, immune cell activation and very low level viremia in HIV-infected patients. Clin Exp Immunol. 2014 doi: 10.1111/cei.12278. http://dx.doi.org/10.1111/cei.12278. [DOI] [PMC free article] [PubMed]
- Seu L, Ortiz GM, Epling L, Sinclair E, Swainson LA, Bajpai UD, Huang Y, Deeks SG, Hunt PW, Martin JN, McCune JM. Higher CD27+CD8+ T cells percentages during suppressive antiretroviral therapy predict greater subsequent CD4+ T cell recovery in treated HIV infection. PLoS One. 2013;8:e84091. doi: 10.1371/journal.pone.0084091. [DOI] [PMC free article] [PubMed] [Google Scholar]
- Simon R, Lam A, Li MC, Ngan M, Menenzes S, Zhao Y. Analysis of gene expression data using BRB-array tools. Cancer Inform. 2007;3:11–17. [PMC free article] [PubMed] [Google Scholar]
- Wilkin TJ, Lalama CM, McKinnon J, Gandhi RT, Lin N, Landay A, Ribaudo H, Fox L, Currier JS, Mellors JW, Gulick R, Tenorio AR. A pilot trial of adding maraviroc to suppressive antiretroviral therapy for suboptimal CD4+ Tcell recovery despite sustained virologic suppression: ACTG A5256. J Infect Dis. 2012;206:534–542. doi: 10.1093/infdis/jis376. [DOI] [PMC free article] [PubMed] [Google Scholar]
Associated Data
This section collects any data citations, data availability statements, or supplementary materials included in this article.