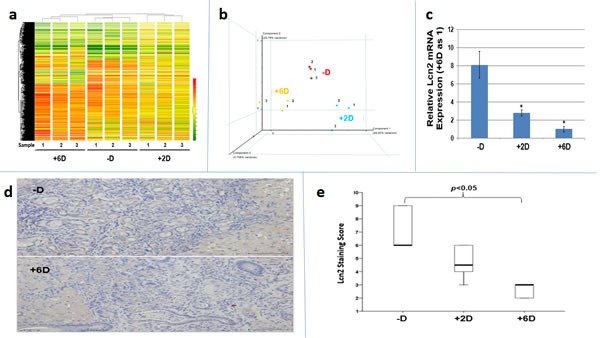
Figure 3. Analyses of tumor tissues obtained from -D, +2D and +6D groups of rats by microarray, qRT/PCR and immunohistochemistry (IHC) staining.

a. Molecular portrait of gene expression profile in rat ICC (-D, +2 IU and +6D groups). Hierarchical clustering illustrates 1,633 gene expression patterns. The results are shown in a diagram format, in which rows represent individual transcripts and columns represent data from 3 different animals in each group. The color in each cell reflected the expression level of the corresponding sample, relative to its mean expression level. The result indicated each group has indistinct gene expression profiles and the similar gene expression profile is observed within the group. b Principal components analysis (PCA) of vitamin D responsive gene expression profiles. The gene expression in each group was analyzed by PCA method. The individual point from -D, +2D and +6D group was marked in red, blue, and orange, respectively. c. Lcn2 mRNA expression in tumor tissues. Comparison of Lcn2 mRNA expression by RT-qPCR among tumors from -D, +2D and +6 D animals. *p<0.05 d. LCN2 expression in tumor tissues. Comparison of Lcn2 expression by IHC staining between the tumors from -D and +6D animals. e. Quantitative analysis of tumor tissue by IHC staining. Box plots analysis was used to compare the LCN2 IHC staining among tumors from -D, +2D and +6D animals. The LCN2 expression in –D and +6D group is significantly different.
