

Abstract
Contraction and relaxation are fundamental aspects of cardiomyocyte functional biology. They reflect the response of the contractile machinery to the systolic increase and diastolic decrease of the cytoplasmic Ca2+ concentration. The analysis of contractile function and Ca2+ transients is therefore important to discriminate between myofilament responsiveness and changes in Ca2+ homeostasis. This article describes an automated technology to perform sequential analysis of contractile force and Ca2+ transients in up to 11 strip-format, fibrin-based rat, mouse, and human fura-2-loaded engineered heart tissues (EHTs) under perfusion and electrical stimulation. Measurements in EHTs under increasing concentrations of extracellular Ca2+ and responses to isoprenaline and carbachol demonstrate that EHTs recapitulate basic principles of heart tissue functional biology. Ca2+ concentration-response curves in rat, mouse, and human EHTs indicated different maximal twitch forces (0.22, 0.05, and 0.08 mN in rat, mouse, and human, respectively; P < 0.001) and different sensitivity to external Ca2+ (EC50: 0.15, 0.39, and 1.05 mM Ca2+ in rat, mouse, and human, respectively; P < 0.001) in the three groups. In contrast, no difference in myofilament Ca2+ sensitivity was detected between skinned rat and human EHTs, suggesting that the difference in sensitivity to external Ca2+ concentration is due to changes in Ca2+ handling proteins. Finally, this study confirms that fura-2 has Ca2+ buffering effects and is thereby changing the force response to extracellular Ca2+.
Keywords: cardiac tissue engineering, contractile analysis, Ca2+ transient, hiPSC
contractile force is a fundamental physiological parameter of cardiomyocyte function and can be evaluated in heart tissue, isolated papillary muscles, or force-generating engineered heart tissue (EHT). Development of contractile force is driven by an increase in cytoplasmic Ca2+ concentration from sarcoplasmic Ca2+ stores (9, 17, 35). Relaxation follows the reuptake of Ca2+ ions into the sarcoplasmic reticulum or removal across the plasma membrane via sodium-calcium exchanger. The cytoplasmic Ca2+ concentrations during systole and diastole can differ by a factor of up to 100 (10 μM, 100 nM) and are subject to physiological and pharmacological regulation (2–4, 12, 28). Examples are the positive inotropic effects of β-adrenergic agonists and phosphodiesterase inhibitors and the negative inotropic effects of muscarinic agonists and Ca2+ channel antagonists. The alternative principle to modify force development is the alteration of myofilament Ca2+ sensitivity by modifying the threshold Ca2+ concentration for activation or force development per Δ Ca2+ concentration. This mechanism occurs in the decrease in force in situations of intracellular acidosis, acceleration of relaxation by β-adrenergic stimulation, and increased force production in response to drugs such as levosimendan (Ca2+ sensitizers) or myosin activators (16). The list of candidate targets is long and includes troponin C, troponin I, cardiac myosin-binding protein C, titin, and myosin among others (1, 6, 7, 18–20, 23, 26). Ca2+ transients are frequently measured in single cardiac myocytes, but only rarely in three-dimensional heart tissues (5, 23, 30). Reasons include insufficient uptake of fluorescent dyes into intact heart preparations and difficulties to simultaneously monitor light signals and force of contraction. EHTs are three-dimensional, force-generating heart muscle constructs from single cells (8, 37, 38). Our laboratory has recently established a technology to generate fibrin-based EHTs in a 24-well format between flexible silicone posts under auxotonic stretching conditions (11). Furthermore, we have set up an automated test platform to analyze contractility by video-optical recording. This study describes an extension of our technology, which allows measurement of contractile force and Ca2+ transients, measured as F340-to-F380 ratio under perfusion and electrical pacing in up to 11 EHTs after fura-2 loading.
MATERIAL AND METHODS
Cell population.
Heart cells were isolated from neonatal Wistar and Lewis rats (postnatal day 0 to 3) or from C57BL/6J mice (postnatal day 0 to 1) by a fractionated DNase/Trypsin or a collagenase-based digestion protocol as previously described (11, 30). The resulting unpurified cell suspension was subsequently subjected to EHT generation. Experimental procedures were reviewed and approved by the Ethics Committee, University of Hamburg. The human iPS cell line was reprogrammed with lenti/retroviral vectors and characterized for pluripotency (21). Cardiomyocyte differentiation from human induced pluripotent stem cells (hiPSC) and subsequent human EHT generation were performed as previously described (27).
Generation and culture of EHTs.
To generate EHTs, a reconstitution mix was prepared on ice as follows (final concentration): unpurified 4.1 × 10⁶ cells/ml (rat), 6.8 × 10⁶ cells/ml (mouse), or 10 × 106 cells/ml (hiPSC), 5 mg/ml bovine fibrinogen (stock solution: 200 mg/ml plus aprotinin 0.5 μg/mg fibrinogen in NaCl 0.9%; Sigma F4753), 10% Matrigel (mouse, hiPSC; BD Biosience 356235). DMEM (2×) was added to match the volumes of fibrinogen and thrombin (stock 100 U/ml; Sigma T7513) to ensure isotonic conditions. Custom-made Teflon spacers for casting mold generation and silicone racks (produced by Siltec GmbH) were used, and EHTs were generated as previously described (11). In brief, for each EHT, 97 μl reconstitution mix was mixed briefly with 3 μl thrombin and pipetted into the agarose casting mold. For fibrinogen polymerization the constructs were placed in a 37°C, 7% CO2 humidified cell culture incubator for 2 h. The racks were transferred to 24-well plates filled with cell culture medium. EHTs were kept in 37°C, 7% CO2 humidified cell culture incubator (40% O2 for rat and human, 21% O2 for mouse). Cell culture medium was changed after 48 h and consisted of DMEM (Biochrom F0415), 10% horse serum (Gibco 26050), 2% chick embryo extract, 1% penicillin-streptomycin (Gibco 15140), insulin (10 μg/ml; Sigma-Aldrich I9278), and aprotinin (33 μg/ml; Sigma Aldrich A1153). On day 5 of mouse EHT culture β-D-arabinofuranoside (25 μg/ml; Sigma-Aldrich C1768) was added to the EHT medium for 48 h as previously described to prevent proliferation of noncardiomyocytes (30).
Measurement of contractile force and F340-to-F380 ratio.
The set-up to sequentially measure contractile force and F340-to-F380 ratio is illustrated in Fig. 1. In principle it consists of four components. The first component is a conventional IonOptix set-up to analyze Ca2+ transients. It consists of a fluorescent light source containing a xenon lamp and a hyperswitch (IonOptix) to excite the EHT with ultraviolet light at 340 and 380 nm (1,000 Hz; blue light path; Fig. 1). Fura-2 is the Ca2+ indicator dye used. Ca2+-bound fura-2 has peak excitation at 340 nm and emits at 510 nm. Ca2+-free fura-2 has peak excitation at 380 nm and also emits at 510 nm. For brevity, F340 is defined as 510 nm fluorescence emission from 340 nm excitation and F380 is defined as 510 nm fluorescence from 380 nm excitation. Intracellular Ca2+ concentration [Ca2+]i corresponds to F340-to-F380 ratio. A shutter system restricts the detection of emitted light (green light path; Fig. 1) to a predefined area. A dichroic mirror reflects short-wavelength light into a tight bandpass filter centered at fura-2 fluorescence wavelength before entering a photomultiplier tube (PMT; IonOptix) and let long-wavelength light pass. A video camera (Basler A6021-2) in the path of the pass-through long wavelength light (red light path in Fig. 1) is used to identify an area in the center of the EHT for F340-to-F380 ratio analysis (Fig. 2). Although one does not see the F340-to-F380 in the long wave pass-through video image, one can identify the area by appearance of contracting myocytes. A fluorescence system interface (FSI; IonOptix) and a computer (not shown) integrate the signals.
Fig. 1.
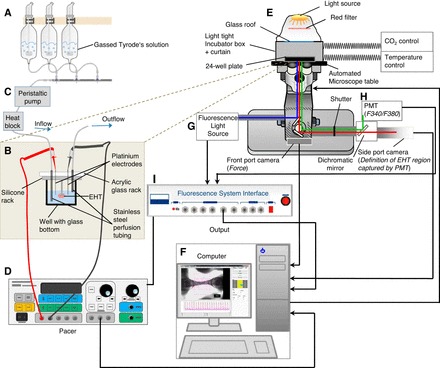
Schematic depiction of the novel-microscope based set-up for sequential contractile force and F340-to-F380 ratio measurements under electrical stimulation and continuous perfusion. A: carbogen-bubbled Tyrode's solution for baseline recordings and experimental conditions in glass reservoirs. B: acrylic glass rack equipped with stainless steel perfusion tubing and platinum iridium electrode pair on top of the silicone rack containing fura-2-loaded engineered heart tissues (EHT) in a 24-well plate with glass bottom. Peristaltic pump (C; 1 to 2 ml·well−1·min−1), heat block, and electrical pacer (D; 2–6 Hz, species specific, 4-ms pulse duration, 7 V) are shown. E: temperature and CO2-controlled incubation chamber with automated microscope table, 24-well plate holder, and 24-well plate. F: customized software to analyze contractile force and F340-to-F380 ratio sequentially. Fluorescence light source (hyperswitch; IonOptix) containing a xenon lamp (G), the photomultiplier tube (PMT; IonOptix; H), and the fluorescence system interface (FSI; IonOptix; I) are used for F340-to-F380 ratio measurements. Black lines illustrate electrical interconnection.
Fig. 2.
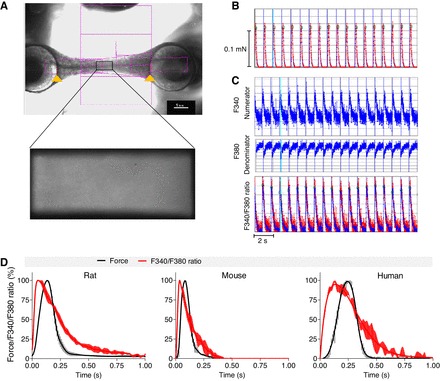
Data analysis. A contour recognition mode automatically recognizes both ends of the EHTs and follows them over time (A, top). The pink squares represent the contour recognition mode of the CTMV software, which automatically identifies both ends of EHT despite variable geometry. The red lines (marked with an orange arrow) indicate correct recognition of the silicone post, which is important for force measurement. Deflection, elastic property, and geometry of the silicone posts are used to calculate contractile force, which is depicted over time (B). A camera in the optical path of the PMT is used before the start of the measurement to define a rectangle area in the center of the EHT (A, bottom). Fluorescence light emission of this area is integrated by the PMT and converted into an electrical signal. The time flow of these signals and excitations at 340 nm (numerator) and 380 nm (denominator) are integrated (Fluorescence System Interface) and signal emission intensities at both excitation wavelengths are displayed as single graphs over time (C). Force and F340-to-F380 ratio are measured sequentially with 2 different objectives automatically. Electrical pacing signals are integrated as blue vertical lines. Baseline for analysis are the tips of contraction, and F340-to-F380 ratio peaks based on predefined criteria. Green squares illustrate these data points and serve as quality control. The following parameters are calculated: absolute force (in mN), contraction and relaxation times (T1 and T2 in s), F340-to-F380 ratio (in arbitrary units), and times to Ca2+ peak and Ca2+ return (in s). Average peaks of rat, mouse, and human EHTs can be generated for force and Ca2+ transients and their temporal progression can be illustrated (D). Data are means ± SE.
The second component is an Axiovert 200M (Carl Zeiss) inverted fluorescence microscope equipped with a 10× objective for F340-to-F380 ratio measurements (EC Plan-Neofluar 10×/0.3; Zeiss), a 1.25× objective for force measurement (EC Plan-Neofluar 1.25×/0.03; Zeiss), and a motorized microscope table (Märzhäuser Wetzler) with a 24-well plate holder (PeCon). This is covered by a custom-made light-tight incubator box and curtain, which is ventilated with temperature- and CO2-controlled air (CTI controller 3700 digital; PeCon). A video camera (Basler A6021-2) is connected to the front port of the microscope to monitor EHT contractility.
The third component is a custom-made perfusion system consisting of an acrylic glass plate with 12 stainless steel tube pairs to allow continuous infusion and aspiration of Tyrode's solution of 11 EHTs and a temperature sensor in an extra well in parallel. The aspiration tube for each well is adjusted to guarantee that the minimum level of Tyrode's solution is high enough to cover the EHT. The tubing pairs are complemented by two platinum iridium electrodes connected to a field stimulator (Grass S88X Dual Output Square Stimulator; Natus Neurology). A silicone tubing system is connecting eight carbogen-bubbled glass reservoirs (95% O2-5% CO2) with the stainless steel inlet. The inlet and outlet silicone tubes are clamped into a 24-channel peristaltic pump (IPC, Ismatec, IDEX). Perfusion rate is determined by the speed of the pump (not individually adjustable) and the diameter of tube clamped into the pump (perfusion 1.29 mm, aspiration 2.29 mm). The inlet silicone tubes are also positioned into a heating block to equilibrate Tyrode's solution at 37°C. Tyrode's solution is heated with electrical heating foil on the heating block. Temperature is equilibrated at 37°C by a negative feedback regulation with a thermometer placed in one of the perfused wells in the 24-well plate (not displayed in Fig. 1).
The fourth component is a separate computer running a customized software (CTMV GmbH). It is receiving input signals from two video cameras (Basler A6021-2) positioned at the front port and the side port of the microscope. The front port camera is monitoring contractility by recording the movement of the two silicone posts at both ends of the EHT (frame rate, 100/s) and the side port camera enables the experimenter to define the sector of the EHT, which will be integrated for F340-to-F380 ratio measurement. Alternate excitation wavelengths with 340 and 380 nm UV light are achieved with a HyperSwitch (IonOptix). In this system, the light of a Xenon arc bulb is split with a rapidly switching mirror, generating a light beam of either 340 nm or 380 nm wavelengths. The emitted 510 nm fluorescence light from the EHT in the well is reflected by the dichroic mirror and bandpass-filtered before traveling into the PMT. The PMT converts light intensities into electrical signals and forwards them to the FSI (frame rate, 250 Hz). The FSI parse these signals with time points of 340 and 380 nm excitations to define numerator (510 nm emission from 340 nm excitation) and denominator (510 nm emission from 380 nm excitation) values and transmit them to the customized CTMV software to calculate F340-to-F380 ratio values. The software is also connected to the operator interface of the microscope/motorized microscope table. Thereby, the software can define XYZ coordinates for each EHT and synchronize objective position and microscope settings (front port-force measurement, side port-F340-to-F380 ratio measurement) with force or F340-to-F380 ratio measurements. Given the need for two different objectives, force and F340-to-F380 ratio values cannot be measured simultaneously but sequentially and require motorized and software-controlled switching of objectives. Contractile force is calculated from post movements as described previously (34).
A typical measurement starts with perfusion of the system with Tyrode's solution. Fura-2 loaded EHTs are placed into a 24-well plate with glass bottom allowing ultraviolet light transition (IWAKI 090615). The perfusion rack is placed on top of the silicone racks in the 24-well plate. The 24-well plate is placed into the 24-well plate holder, and the incubator box is closed. The XYZ coordinates are defined for measurement of contractile force and F340-to-F380 ratio, and the EHT sample identity is added to the protocol. Prewarmed Tyrode's solution for baseline recordings (in mM: 120 NaCl, 5.4 KCl, 1.0 MgCl2, 0.2–1.8 CaCl2, 0.4 NaH2PO4, 22.6 NaHCO3, 5.0 glucose, 0.05 Na2EDTA, and 0.3 ascorbic acid) is filled into the glass reservoirs and bubbled with carbogen (95% O2-5% CO2) for at least 5 min. The peristaltic pump (1 to 2 ml·well−1·min−1) and electrical pacer (1–6 Hz depending on species, 4-ms pulse duration, 7 V) are switched on, and the measurement is started.
Fura-2 loading of EHTs.
EHTs were washed twice in Tyrode's solution (1.8 mM Ca2+, 5 min) and incubated in Tyrode's solution (1.8 mM Ca2+) containing 2, 5, or 10 μM fura-2 AM and Cremophor EL (0.75%; Sigma C5135) as a detergent to allow fura-2 AM to pass the cell membrane for 2 h at 37°C (32). EHTs were washed with Tyrode's solution (1.8 mM Ca2+) for 5–10 min before the start of measurements.
Evaluation of myofilament Ca2+-sensitivity.
Rat and human EHTs were removed from the silicone posts and washed three times in cold pCa 9 relaxing solution containing 5.89 mM Na2ATP, 14.5 mM CrP, 6.48 mM MgCl, 40.76 mM potassium propionate, 100 mM BES, and 6.97 mM EGTA. Tissues were stored at −20°C in a mixture of 50% glycerol and 50% relaxing solution with 1% triton X-100. Before force measurements, EHTs were washed in cold relaxing solution, cut into two or three strips and incubated in relaxing solution containing 1% triton X-100 for 1 h at 4°C to complete skinning. The Ca2+-sensitivity of skinned EHT strips was evaluated using a permeabilized fiber test system (1400A; Aurora Scientific). The strips were mounted between two T-clips and attached to a force transducer and a length controller. Strips were stretched carefully until they started to develop force when activated in pCa 4.5 solution (5.97 mM Na2ATP, 14.5 mM CrP, 6.28 mM MgCl2, 40.64 mM potassium propionate, 100 mM BES, and 7 mM CaEGTA). After the initial maximal force (in mN) was determined, strips were relaxed in pCa 9 buffer and exposed to solutions of increasing Ca2+ concentrations from pCa 9 to pCa 4.5 (22). Force development was measured in each pCa solution. Data were analyzed using the Hill equation (14), with pCa50 as the free Ca2+ concentration, which yields 50% of the maximal force and the Hill coefficient (in nH). The pCa50 represents the measure of myofilament Ca2+-sensitivity.
Statistical analysis.
Results are presented as means ± SE. All statistical tests were performed in GraphPad Prism version 5.02. In detail, sum-of-squares F-test (to compare curve data sets), one-way ANOVA with Dunnett's multiple comparison post-test (to compare to control condition) or two-way ANOVA, and Bonferroni's multiple comparison post-test (to compare all groups) was used for more than two groups. P < 0.05 or less was considered statistically significant. P values are displayed graphically as follows: *P < 0.05, **P < 0.01, ***P < 0.001.
RESULTS
Average contraction and Ca2+ transient peaks.
Silicone post movements and fluorescence emissions at 340 nm (numerator, F340) and 380 nm (denominator, F380) excitation were recorded sequentially over time using an automatic contour recognition algorithm and a PMT, respectively (Fig. 2, A–C). Sequential measurement of force and F340-to-F380 ratio is illustrated in the supplemental online movie. EHTs in the relaxed state will not generate active contractile force to cause deflection of the posts; thus the distance between posts during the relaxed state was equated to 0 force. Deflection of the posts during active contraction was captured in micrometers, and force in millinewtons was calculated from deflection distance. Typical values were in the range of 140 to 800 μm or 0.05 to 0.3 mN. Increasing Ca2+ simultaneously caused F340 to increase and F380 to decrease (Fig. 2C). Thus numerator-to-denominator ratio of fluorescent light emissions (F340-to-F380 ratio) increased when fura-2 bound Ca2+ and was therefore reflecting intracellular Ca2+ concentrations (Fig. 2C). Example values were 5,000 for the numerator, 4,000 for denominator, and 1–1.5 for the F340-to-F380 ratio. The software automatically sets baseline ratio values during relaxation to 0. The change in F340-to-F380 ratio during contraction was typically in the range of 0.1 to 0.3. Representative average contraction twitches and F340-to-F380 ratio values for rat, mouse, and human EHTs are illustrated in Fig. 2D. Differences between the species as well as between the kinetics of the F340-to-F380 ratio and the contraction were apparent.
Contractile characterization of three different EHT species.
Ca2+ concentration-response curves were performed with rat (4 Hz, 0.1–1.8 mM Ca2+), mouse (6 Hz, 0.1–1.8 mM Ca2+), and human (2 Hz, 0.1–5 mM Ca2+) EHTs (Fig. 3). Pacing frequencies were chosen to override spontaneous contraction frequencies. Maximal twitch force differed between the groups, amounting to a mean of 0.22, 0.05, and 0.08 mN, respectively (Fig. 3A). This corresponded to 0.41 ± 0.28, 0.17 ± 0.14, and 0.37 ± 0.29 mN/mm2 for rat, mouse, and human EHT, respectively. Maximal force was reached at 0.4, 1.0, and 5.0 mM Ca2+ in rat, mouse, and human EHTs and calculated EC50 values (and Hill Slopes) were 0.15 mM (3.10), 0.39 mM (1.87), and 1.05 mM (1.80), respectively (P < 0.001; Fig. 3B). Force increased 4-, 10-, and 70-fold between 0.1 and 1.8 mM Ca2+. Analysis of normalized force showed the highest sensitivity to external Ca2+ in rat EHTs (Fig. 3B). Figure 3C illustrates Ca2+ concentration response curves as average peaks with the highest contractions set to 100%. Contraction time (T180%) and relaxation time (T280%) were measured from 20% to peak and from peak to 20% of peak height, respectively. Increasing external Ca2+ concentrations did not affect these parameters in the three groups. T180% significantly differed between rat, mouse, and human (P < 0.001). T280% was approximately twofold longer in human than in rat and mouse (P < 0.001), but did not differ between rat and mouse (P > 0.05; Fig. 2, D and E).
Fig. 3.
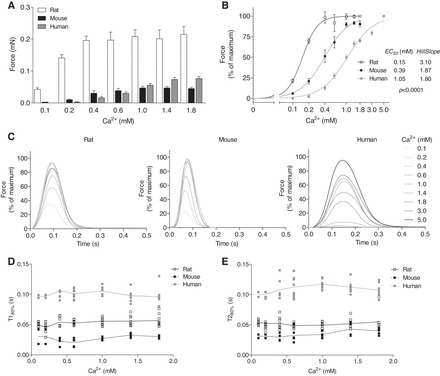
Ca2+ concentration response curves were performed with rat, mouse, and human EHTs under electrical stimulation (rat: 4 Hz; mouse: 6 Hz; human: 2 Hz). A: absolute peak forces at different external Ca2+ concentrations ranging from 0.1 to 1.8 mM [rat (n = 12), mouse (n = 12), and human (n = 8)]. B: same data as A, expressed as percentage of maximal peak force and calculated values for the EC50 for Ca2+ and the Hill Slopes. C: average peaks were generated from 20 to 40 peaks of EHTs for each external Ca2+ concentration. D: contraction time T1 and relaxation time T2 (E), both measured at 20% of the peak height. Data are means ± SE. P < 0.0001 different curve for each data set (Sum-of-squares F-test).
Responses to drugs.
Contractile parameters were measured in the presence of standard positive and negative inotropic drugs. Positive inotropic effects of isoprenaline were determined at external [Ca2+] around the EC50 for the respective species (0.1, 0.6, and 0.6 mM Ca2+ for rat, mouse, and human, respectively), ensuring sufficient force development for acceptable peak height and resolution under baseline conditions. Negative inotropic effects of the Ca2+ channel blocker verapamil were determined at maximally effective [Ca2+] (1.8 mM in rat and mouse, and 5 mM in human). Isoprenaline (100 nM) increased force sixfold, fourfold, and 1.85-fold in rat, mouse, and human, respectively (Fig. 4A). Addition of the muscarinic agonist carbachol (10 μM) partially antagonized the positive inotropic effect of isoprenaline in all groups. As expected, isoprenaline showed a positive clinotropic (faster force development) and lusitropic (faster relaxation) effect in rat, mouse, and human EHTs, which was abolished by carbachol in rat and mouse (Fig. 4, C and D). Verapamil concentration dependently reduced force development in all EHT groups (Fig. 4B). Calculated IC50 values (and Hill Slopes) amounted to 1,239 (−2.78), 316 (−1.11), and 968 (−3.20) nM in rat, mouse, and human EHT, respectively (P < 0.0001).
Fig. 4.
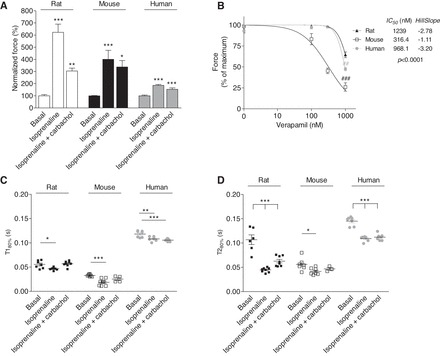
Effects of isoprenaline, isoprenaline plus carbachol, and verapamil in rat, mouse, and human EHTs. A: isoprenaline (100 nM)- and carbachol (10 μM)-induced changes in relative force. B: effect of verapamil (100–1,000 nM) on relative force. A and B, expressed as percentage of maximal peak force of each EHT of rat (n = 7 to 8), mouse (n = 4–8), and human (n = 4–8). Contraction time T1 (C) and relaxation time T2 (D) in the presence of isoprenaline (100 nM) and isoprenaline plus carbachol (10 μM) are shown. Kinetics were measured at 20% of the peak height. Data are means ± SE. *P < 0.05, **P < 0.01, and ***P < 0.001 vs. basal condition (1-way ANOVA plus Dunnett post tests); ##P < 0.01 and ###P < 0.001 vs. rat (2-way ANOVA plus Bonferroni post tests).
Sequential measurement of force and Ca2+ transient.
Rat EHTs were labeled with 2, 5, or 10 μM fura-2 and force and F340-to-F380 ratio were measured in the presence of increasing Ca2+ concentrations (Fig. 5, A–C). This revealed that fura-2 shifted the Ca2+ concentration-response curve to the right with EC50 values of 0.11, 0.27, and 0.47 mM at fura-2 concentrations of 2, 5, and 10 μM, respectively (Fig. 5D; P < 0.001). Fura-2 at 2 μM did not result in Ca2+ transients sufficiently above the noise signal (Fig. 5A; 1.8 mM external Ca2+) and lacked a positive correlation between Ca2+ transients and increasing Ca2+ concentrations (Fig. 5E). In contrast, EHTs loaded with 5 and 10 μM fura-2 (both measured at 1.8 mM external Ca2+) showed a 1.6- and twofold increase in F340-to-F380 ratio (percentage of maximum) between 0.1 mM and 1.8 mM external Ca2+ concentration, respectively. The maximal F340-to-F380 ratio did not differ between 5 and 10 μM fura-2 (Fig. 5A).
Fig. 5.
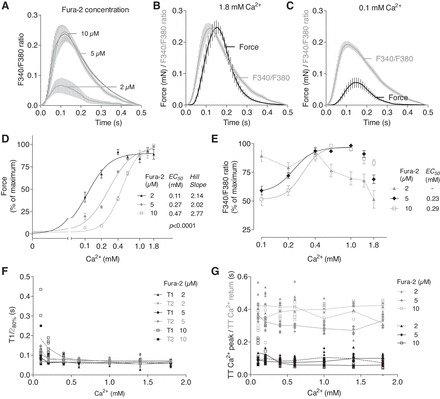
Force and F340-to-F380 ratio were measured sequentially in rat EHTs in the presence of increasing external Ca2+ concentrations. A: Average F340-to-F380 ratio in the presence of 2, 5, or 10 μM fura-2 (1.8 mM external Ca2+). Average F340-to-F380 ratio and force in the presence of 5 μM fura-2 and 1.8 mM (B) or 0.1 mM (C) external Ca2+. D: peak forces at different external Ca2+ concentrations in the presence of 2, 5, or 10 μM fura-2 were expressed as percentage of maximal peak force of each EHT. E: F340-to-F380 ratios at different external Ca2+ concentrations were expressed as percentage of maximal F340-to-F380 ratio of each EHT. F: correlation between contraction time T1 and relaxation time T2 to external Ca2+ concentrations. G: correlation between time to Ca2+ peak (TT Ca2+ peak) and time to Ca2+ return (TT Ca2+ return) to external Ca2+ concentrations were measured at 10% of the Ca2+ peak height. Number of EHTs was n = 6–8. Data are means ± SE. P < 0.0001 different curve for each data set (Sum-of-squares F-test).
A number of observations are noteworthy. First, the F340-to-F380 ratio tended to decrease at higher external Ca2+ concentrations (>1.0 mM) in the three groups. This most likely indicates leakage and/or bleaching due to repeated measurements and perfusion with 120 ml Tyrode's solution per hour. Second, in 10 μM fura-2-loaded EHTs the F340-to-F380 ratio declined to only 50% of maximal values in the presence of 0.1 mM Ca2+ concentrations, whereas force of contraction decreased to ∼7% of maximal values. This indicates that, at low external Ca2+ concentrations, fura-2 competes with the myofilaments for Ca2+ binding to an extent that prevents force development and is consequence of the high Ca2+ affinity of fura-2 (13). Accordingly, the F340-to-F380 ratio showed a very narrow regulation range.
Kinetic analyses revealed that, at high concentrations of fura-2 (10 μM), T1 and T2 markedly increased at low external Ca2+ concentrations (0.1–0.2 mM Ca2+), indicating a buffering effect of fura-2. With increasing Ca2+ concentrations (0.4 mM) no differences in T1 and T2 times were detected anymore. Kinetics of average F340-to-F380 ratio amplitude showed no differences in the time to Ca2+ peak and the time to Ca2+ return between different fura-2 concentrations (Fig. 5, F and G).
In another approach, rat EHTs were loaded with 10 μM fura-2 and force and Ca2+ transients were measured in the absence and presence of isoprenaline. The measurements were performed at the EC50 for Ca2+ for EHTs loaded with 10 μM fura-2 (0.3 mM; compare Fig. 5D). Isoprenaline led to a positive inotropic (+150%), clinotropic (−28 ms in T1), and lusitropic (−47.1 ms in T2) effect (Fig. 6, A and D–F). In analogy, isoprenaline increased the amplitude and reduced the time to peak Ca2+ (−10.1 ms; Fig. 6G) and time to Ca2+ transient return (−176.5 ms; Fig. 6H). As expected, addition of the muscarinic agonist carbachol (10 μM) partially antagonized the effect of isoprenaline (Fig. 6, C–H). Phase plane diagrams of force and F340-to-F380 ratio showed that, in the presence of isoprenaline, higher intracellular Ca2+ concentrations were needed for contraction to start and relaxation was completed at higher Ca2+ concentrations, illustrating that isoprenaline changed Ca2+ threshold for activation (Fig. 6B). On the other hand, isoprenaline caused an increased force per change in Ca2+ concentration after activation (0.45 vs. 0.8; ratio was calculated from Fig. 6, B–D).
Fig. 6.
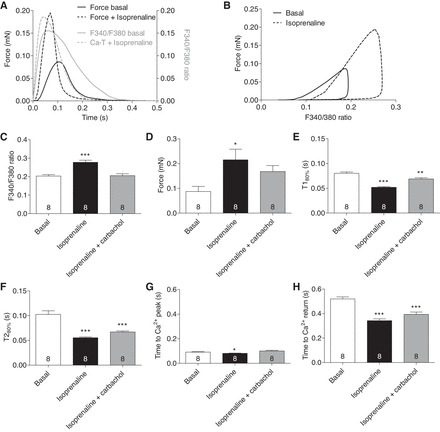
Force and F340-to-F380 ratio were measured sequentially in rat EHTs in the presence of isoprenaline and isoprenaline plus carbachol. A: average peak forces and F340-to-F380 ratio of EHTs loaded with 10 μM fura-2 under basal conditions or 100 nM isoprenaline. B: correlation between peak force and F340-to-F380 ratio. Absolute values for F340-to-F380 ratio (C) and force (D) are shown. Contraction time T1 (E) and relaxation time T2 (F) were measured at 80% of the peak height. Time to Ca2+ peak (TT Ca2+ peak; G) and time to Ca2+ return (TT Ca2+ return; H) in EHTs were measured at 10% of the Ca2+ peak height. Number of EHTs is indicated in the panels. All measurements were performed at 0.3 mM external Ca2+. Data are means ± SE. *P < 0.05, **P < 0.01, and ***P < 0.001 vs. basal condition (1-way ANOVA plus Dunnett post tests).
Evaluation of myofilament Ca2+ sensitivity in skinned rat and human EHTs.
To discriminate if species differences in force response to external Ca2+ correlate with different myofilament Ca2+ sensitivity skinned rat and human EHTs were subjected to myofilament analysis (Fig. 7A). Maximal force was higher in skinned rat than human EHTs (0.048 mN vs. 0.026 mN; P < 0.05), supporting force measurements in nonskinned EHTs (Fig. 3). Analysis of force (normalized to maximal values of each strip) revealed that there was no difference in myofilament Ca2+ sensitivity between rat and human EHTs (pCa50 = 5.64 and 5.62, Hill Slope 5.6 and 6, respectively; Fig. 7B).
Fig. 7.
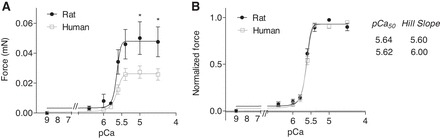
Force in skinned rat and human EHT strips was measured in the presence of increasing external Ca2+ concentrations using a permeabilized fiber test system. EHT strips were mounted between 2 T-clips and attached to a force transducer and a length controller. A: EHT strips were relaxed in pCa 9 buffer and exposed to solutions of increasing Ca2+ from pCa 9 to pCa 4.5, and absolute force was measured. B: force at different Ca2+ concentrations is expressed as relative value of the maximal absolute force of each EHT strip. Data were analyzed using the Hill equation with pCa50 as the free Ca2+ concentration, which yields 50% of the maximal force and the Hill coefficient (in nH) (n = 13 per group). Data are means ± SE. *P < 0.05 vs. human (2-way ANOVA plus Bonferroni post tests).
DISCUSSION
This article describes the prototype of a test set-up to sequentially analyze contractile force and F340-to-F380 ratio (Ca2+ transients) in fura-2-loaded three-dimensional EHTs. The automated test set-up and the perfusion system with glass reservoirs allow the analysis of different experimental conditions in a short period of time. The technique was useful to generate the following main results: 1) force and F340-to-F380 ratio were measured in EHTs generated from rat, mouse, and human cardiomyocytes; 2) rat EHTs showed the highest force and sensitivity to external Ca2+, whereas human EHTs displayed the lowest Ca2+ sensitivity and the slowest contraction kinetics; 3) EHTs of all three species showed positive inotropic, clinotropic, and lusitropic response to isoprenaline; 4) a concentration of 5–10 μM fura-2 resulted in Ca2+ transient amplitudes beyond the noise signal; 5) Fura-2 decreased the Ca2+ sensitivity concentration dependently; and 6) F340-to-F380 ratio increased with increasing external [Ca2+] and in the presence of isoprenaline in rat EHTs, which is in line with findings obtained in single cardiomyocytes (25). Important parameters for a successful measurement are the total length of an experiment, the number of EHTs measured in one experimental run (maximum, 11 EHTs), and the equilibration time for the experimental conditions. Given a perfusion speed of 1 to 2 ml/min and a calculated dead volume of less than 5 ml per well, an experimental condition is established in less than 5 min in the wells. Continuous perfusion avoids accumulation of oxidative radicals as a side product of the electrical pacing with platinum iridium electrodes. However, consecutive measurement of up to 11 EHTs in an experimental run results in different incubation times and could be a limitation in detecting acute transient effects.
The high level of versatility of this system is emphasized by the ability to study EHTs from different species (including EHTs obtained from human iPSC-derived cardiomyocytes). This feature allowed us to gain insight into contractile performance of EHTs generated from different species, such as maximal force development, response to β-adrenergic stimulation, or sensitivity to external Ca2+. Previous studies showed that myofilament Ca2+ sensitivity is dependent on the phosphorylation status of the main myofilament proteins involved in regulation of Ca2+ sensitivity and decreases with development of the murine heart (29). In contrast to rodent hearts, β-myosin heavy chain is the predominant myosin isoform expressed in the human adult heart. This leads to slower contraction and relaxation times in human cardiomyocytes than in rodents, where α-myosin heavy chain is the predominant adult isoform. This raises the question whether differences in myofilament isoforms might contribute to the difference in contractile response to external Ca2+ in EHTs. Analysis of force development in skinned EHTs confirmed higher force development in rat than in human and revealed that myofilament Ca2+ sensitivity did not differ between human and rat, suggesting that not differences in myofilament Ca2+ sensitivity but differences in Ca2+-handling proteins are likely the reason for the differences in contractile response to external Ca2+.
This high content analysis of primary physiological parameters is an important prerequisite to use EHT technology to characterize biological effects. An important innovative perspective is the analysis of EHT from control and disease-specific hiPSC. Given the heterozygous nature of many hereditary cardiac diseases and the immature character of the cardiomyocytes, the expected effect size in these comparisons is small. Test platforms with high levels of standardization/automation and high content analysis will be instrumental to describe a phenotype in these constructs. Another important prerequisite for these analyses is the high frame rate (video-optical recording 100 Hz, Ca2+ transient 250 Hz) resulting in high-resolution analysis of contractile force and Ca2+ transients. Examples are given demonstrating that changes in force and Ca2+ transients in EHTs recapitulate findings in other ex vivo or in vivo systems. The integrated analysis and graphical presentation of contractile force or Ca2+ transients with electrical pacing signals allows the analysis of time from pacing to the contraction/Ca2+ transient peak as additional parameter compared with analyses of spontaneous contractility. Furthermore, the software allows generating average peaks from a predefined area of the original recordings and studying the chronological sequence of contractile force and Ca2+ transients in assembled graphs (Fig. 2D).
The presented test platform is a technological extension to previously published set-ups to study force and Ca2+ transients in three-dimensional cardiac tissues (5, 32, 33). Important extensions include the high level of automation of the test platform and the analysis of auxotonic versus isometric contractions. The analysis of EHTs attached to flexible silicone posts improves standardization since manual preparation of trabeculae from cardiac tissue and transfer/mounting in analysis chambers is not required. The use of engineered tissue in general increases the versatility of the system with respect to species, cellular/matrix composition, but is accompanied by lower force development and an immature phenotype of the tissue. A limitation of this system is the inability to adjust the preload with the current set-up. Another important limitation of this and related experimental systems is the Ca2+ buffering effect of fura-2, causing an apparent desensitization effect as previously reported for dye-based measurements of Ca2+ transients (9, 35). This may be an important confounder in cases where altered responses to extracellular Ca2+ might contribute to the primary pathophysiology or drug effects. The markedly reduced response to extracellular Ca2+ of fura-2 loaded EHTs also requires further optimization in the case of human and mouse EHTs with lower Ca2+ sensitivity and force development. A second important aspect is the small window of linear correlation between the F340-to-F380 ratio and extracellular Ca2+ concentration (Fig. 5E) due to the small window of linear conversion of the PMT and competition between fura-2 and myofilaments at low Ca2+ concentrations. Supra-physiological Ca2+ concentrations (e.g., 3–5 mM) or recently developed Ca2+ sensitive dyes with lower Ca2+ affinity like fura-4F may be required (36). Furthermore, fura-2 is sensitive to bleaching and washout resulting in run-down and unstable baseline in measurement lasting for more than 2 h (24). Nevertheless, this high content and high resolution test system to analyze physiological parameters under automated conditions in EHTs from different species, including hiPSC-derived cardiomyocytes, will be an enormous asset for future studies.
GRANTS
This study was supported by funds from the German Research Foundation (DFG Es 88/12-1 and Mo 2217/1-1), the German Ministry of Research and Education (DZHK, German Centre for Cardiovascular Research), the European Commission with FP7 Projects Angioscaff and Biodesign and Era-Net E-RARE (01GM1305). Further support comes from the Deutsche Herzstiftung (F/13/10).
DISCLOSURES
No conflicts of interest, financial or otherwise, are declared by the author(s).
AUTHOR CONTRIBUTIONS
Author contributions: A.S., C.N., C.B., I.V., F.W.F., and F.F. performed experiments; A.S., C.N., C.B., I.V., F.W.F., and F.F. analyzed data; A.S., C.B., C.W.T., T.E., and A.H. interpreted results of experiments; A.S., F.W.F., and F.F. prepared figures; A.S., C.W.T., T.E., and A.H. drafted manuscript; A.S., C.N., I.V., A.E., S.S., M.N.H., C.W.T., A.M., T.E., and A.H. edited and revised manuscript; A.S., C.N., C.B., I.V., F.W.F., F.F., L.C., A.E., S.S., M.N.H., B.A., C.W.T., A.M., T.E., and A.H. approved final version of manuscript; L.C., S.S., M.N.H., B.A., C.W.T., A.M., T.E., and A.H. conception and design of research.
Supplementary Material
ACKNOWLEDGMENTS
We thank June Uebeler and Thomas Schulze for technical assistance.
REFERENCES
- 1.Baudenbacher F, Schober T, Pinto JR, Sidorov VY, Hilliard F, Solaro RJ, Potter JD, Knollmann BC. Myofilament Ca2+ sensitization causes susceptibility to cardiac arrhythmia in mice. J Clin Invest 118: 3893–3903, 2008. [DOI] [PMC free article] [PubMed] [Google Scholar]
- 2.Bers DM. Ca regulation in cardiac muscle. Med Sci Sports Exerc 23: 1157–1162, 1991. [PubMed] [Google Scholar]
- 3.Bers DM. Calcium fluxes involved in control of cardiac myocyte contraction. Circ Res 87: 275–281, 2000. [DOI] [PubMed] [Google Scholar]
- 4.Bers DM. Cardiac excitation-contraction coupling. Nature 415: 198–205, 2002. [DOI] [PubMed] [Google Scholar]
- 5.de Lange WJ, Grimes AC, Hegge LF, Ralphe JC. Ablation of cardiac myosin-binding protein-C accelerates contractile kinetics in engineered cardiac tissue. J Gen Physiol 141: 73–84, 2013. [DOI] [PMC free article] [PubMed] [Google Scholar]
- 6.Endoh M. Cardiac Ca2+ signaling and Ca2+ sensitizers. Circ J 72: 1915–1925, 2008. [DOI] [PubMed] [Google Scholar]
- 7.Endoh M. Signal transduction and Ca2+ signaling in intact myocardium. J Pharm Sci 100: 525–537, 2006. [DOI] [PubMed] [Google Scholar]
- 8.Eschenhagen T, Fink C, Remmers U, Scholz H, Wattchow J, Weil J, Dohmen HH, Schäfer H, Bishopric N, Wakatsuki T, Elson EL. Three dimensional reconstitution of embryonic cardiomyocytes in a collagen matrix: a new heart muscle model system. FASEB J 11: 683–694, 1997. [DOI] [PubMed] [Google Scholar]
- 9.Fabiato A. Simulated calcium current can both cause calcium loading in and trigger calcium release from the sarcoplasmic reticulum of a skinned canine cardiac Purkinje cell. J Gen Physiol 85: 291–320, 1985. [DOI] [PMC free article] [PubMed] [Google Scholar]
- 10.Grynkiewicz G, Poenie M, Tsien RY. A new generation of Ca2+ indicators with greatly improved fluorescence properties. J Biol Chem 260: 3440–3450, 1985. [PubMed] [Google Scholar]
- 11.Hansen A, Eder A, Bonstrup M, Flato M, Mewe M, Schaaf S, Aksehirlioglu B, Schworer A, Uebeler J, Eschenhagen T. Development of a drug screening platform based on engineered heart tissue. Circ Res 107: 35–44, 2010. [DOI] [PubMed] [Google Scholar]
- 12.Hasenfuss G. Alterations of calcium-regulatory proteins in heart failure. Cardiovasc Res 37: 279–289, 1998. [DOI] [PubMed] [Google Scholar]
- 13.Herron TJ, Lee P, Jalife J. Optical imaging of voltage and calcium in cardiac cells and tissues. Circ Res 110: 609–623, 2012. [DOI] [PMC free article] [PubMed] [Google Scholar]
- 14.Hill TL, Eisenberg E, Greene L. Theoretical model for the cooperative equilibrium binding of myosin subfragment 1 to the actin-troponin-tropomyosin complex. Proc Natl Acad Sci USA 77: 3186–3190, 1980. [DOI] [PMC free article] [PubMed] [Google Scholar]
- 15.Husse B, Wussling M. Developmental changes of calcium transients and contractility during the cultivation of rat neonatal cardiomyocytes. Mol Cell Biochem 163–164: 13–21, 1996. [DOI] [PubMed] [Google Scholar]
- 16.Janssen PM. Kinetics of cardiac muscle contraction and relaxation are linked and determined by properties of the cardiac sarcomere. Am J Physiol Heart Circ Physiol 299: H1092–H1099, 2010. [DOI] [PMC free article] [PubMed] [Google Scholar]
- 17.Janssen PM. Myocardial contraction-relaxation coupling. Am J Physiol Heart Circ Physiol 299: H1741–H1749, 2010. [DOI] [PMC free article] [PubMed] [Google Scholar]
- 18.Lee EJ, Peng J, Radke M, Gotthardt M, Granzier HL. Calcium sensitivity and the Frank-Starling mechanism of the heart are increased in titin N2B region-deficient mice. J Mol Cell Cardiol 49: 449–458, 2010. [DOI] [PMC free article] [PubMed] [Google Scholar]
- 19.Li L, Desantiago J, Chu G, Kranias EG, Bers DM. Phosphorylation of phospholamban and troponin I in β-adrenergic-induced acceleration of cardiac relaxation. Am J Physiol Heart Circ Physiol 278: H769–H779, 2000. [DOI] [PubMed] [Google Scholar]
- 20.Matsuba D, Terui T, JOU, Tanaka H, Ojima T, Ohtsuki I, Ishiwata S, Kurihara S, Fukuda N. Protein kinase A-dependent modulation of Ca2+ sensitivity in cardiac and fast skeletal muscles after reconstitution with cardiac troponin. J Gen Physiol 133: 571–581, 2009. [DOI] [PMC free article] [PubMed] [Google Scholar]
- 21.Moretti A, Bellin M, Welling A, Jung CB, Lam JT, Bott-Flugel L, Dorn T, Goedel A, Hohnke C, Hofmann F, Seyfarth M, Sinnecker D, Schomig A, Laugwitz KL. Patient-specific induced pluripotent stem-cell models for long-QT syndrome. N Engl J Med 363: 1397–1409, 2010. [DOI] [PubMed] [Google Scholar]
- 22.Narolska NA, Eiras S, van Loon RB, Boontje NM, Zaremba R, Spiegelen Berg SR, Stooker W, Huybregts MA, Visser FC, van der Velden J, Stienen GJ. Myosin heavy chain composition and the economy of contraction in healthy and diseased human myocardium. J Muscle Res Cell Motil 26: 39–48, 2005. [DOI] [PubMed] [Google Scholar]
- 23.Pohlmann L, Kroger I, Vignier N, Schlossarek S, Kramer E, Coirault C, Sultan KR, El-Armouche A, Winegrad S, Eschenhagen T, Carrier L. Cardiac myosin-binding protein C is required for complete relaxation in intact myocytes. Circ Res 101: 928–938, 2007. [DOI] [PubMed] [Google Scholar]
- 24.Roe MW, Lemasters JJ, Herman B. Assessment of Fura-2 for measurements of cytosolic free calcium. Cell Calcium 11: 63–73, 1990. [DOI] [PubMed] [Google Scholar]
- 25.Roof SR, Shannon TR, Janssen PM, Ziolo MT. Effects of increased systolic Ca2+ and phospholamban phosphorylation during β-adrenergic stimulation on Ca2+ transient kinetics in cardiac myocytes. Am J Physiol Heart Circ Physiol 301: H1570–H1578, 2011. [DOI] [PMC free article] [PubMed] [Google Scholar]
- 26.Saucerman JJ, Bers DM. Calmodulin mediates differential sensitivity of CaMKII and calcineurin to local Ca2+ in cardiac myocytes. Biophys J 95: 4597–4612, 2008. [DOI] [PMC free article] [PubMed] [Google Scholar]
- 27.Schaaf S, Shibamiya A, Mewe M, Eder A, Stohr A, Hirt MN, Rau T, Zimmermann WH, Conradi L, Eschenhagen T, Hansen A. Human engineered heart tissue as a versatile tool in basic research and preclinical toxicology. PLos One 6: e26397, 2011. [DOI] [PMC free article] [PubMed] [Google Scholar]
- 28.Shannon TR, Ginsburg KS, Bers DM. Reverse mode of the sarcoplasmic reticulum calcium pump and load-dependent cytosolic calcium decline in voltage-clamped cardiac ventricular myocytes. Biophys J 78: 322–333, 2000. [DOI] [PMC free article] [PubMed] [Google Scholar]
- 29.Siedner S, Kruger M, Schroeter M, Metzler D, Roell W, Fleischmann BK, Hescheler J, Pfitzer G, Stehle R. Developmental changes in contractility and sarcomeric proteins from the early embryonic to the adult stage in the mouse heart. J Physiol 548: 493–505, 2003. [DOI] [PMC free article] [PubMed] [Google Scholar]
- 30.Stohr A, Friedrich FW, Flenner F, Geertz B, Eder A, Schaaf S, Hirt MN, Uebeler J, Schlossarek S, Carrier L, Hansen A, Eschenhagen T. Contractile abnormalities and altered drug response in engineered heart tissue from Mybpc3-targeted knock-in mice. J Mol Cell Cardiol 63: 189–198, 2013. [DOI] [PubMed] [Google Scholar]
- 31.Takahashi A, Camacho P, Lechleiter JD, Herman B. Measurement of intracellular calcium. Physiol Rev 79: 1089–1125, 1999. [DOI] [PubMed] [Google Scholar]
- 32.Tong CW, Gaffin RD, Zawieja DC, Muthuchamy M. Roles of phosphorylation of myosin binding protein-C and troponin I in mouse cardiac muscle twitch dynamics. J Physiol 558: 927–941, 2004. [DOI] [PMC free article] [PubMed] [Google Scholar]
- 33.Torres CA, Varian KD, Canan CH, Davis JP, Janssen PM. The positive inotropic effect of pyruvate involves an increase in myofilament calcium sensitivity. PLos One 8: e63608, 2013. [DOI] [PMC free article] [PubMed] [Google Scholar]
- 34.Vandenburgh H, Shansky J, Benesch-Lee F, Barbata V, Reid J, Thorrez L, Valentini R, Crawford G. Drug-screening platform based on the contractility of tissue-engineered muscle. Muscle Nerve 37: 438–447, 2008. [DOI] [PubMed] [Google Scholar]
- 35.Vaughan-Jones RD. Excitation and contraction in heart: the role of calcium. Br Med Bull 42: 413–420, 1986. [DOI] [PubMed] [Google Scholar]
- 36.Wokosin DL, Loughrey CM, Smith GL. Characterization of a range of fura dyes with two-photon excitation. Biophys J 86: 1726–1738, 2004. [DOI] [PMC free article] [PubMed] [Google Scholar]
- 37.Zimmermann WH, Fink C, Kralish D, Mittman C, Patk M, Remmers U, Weil J, Eschenhagen T. Three-dimensional engineered heart tissue from neonatal rat cardiac myocytes. Biotechnol Bioeng 68: 106–114, 2000. [PubMed] [Google Scholar]
- 38.Zimmermann WH, Schneiderbanger K, Schubert P, Didie M, Munzel F, Heubach JF, Kostin S, Neuhuber WL, Eschenhagen T. Tissue engineering of a differentiated cardiac muscle construct. Circ Res 90: 223–230, 2002. [DOI] [PubMed] [Google Scholar]
Associated Data
This section collects any data citations, data availability statements, or supplementary materials included in this article.