Toll-like receptor (TLR) signaling is critical for the regulation of the innate and adaptive immune system, For instance, TLR signaling is involved in DC maturation, antigen presentation and CD8+ T-cell cytotoxicity,[1] all of which are important for antitumor immunity. The binding of an agonist to the TLR causes the homo/heterodimerization of TLRs, triggering the recruitment of intracellular adaptors that form signal transduction complexes in the cytoplasm. The formation of these complexes leads to the activation of signaling pathways, involving nuclear factor-κB (NF-κB), p38 mitogen-activated protein kinase (p38-MAPK) and c-Jun N-terminal kinase (JNK), which regulate the expression of genes involved in inflammation and immunity.[2]
Bacterial and synthetic TLR agonists have been developed for cancer immunotherapy, and used either as single agents or in combination with tumor antigens. Such agonists have shown great promise for cancer treatment.[3–12] Here, we demonstrate the use of polyarginine as a cheap alternative to conventional TLR agonists. We show that polyarginine binds to TLR4, causing the activation of the immune system.
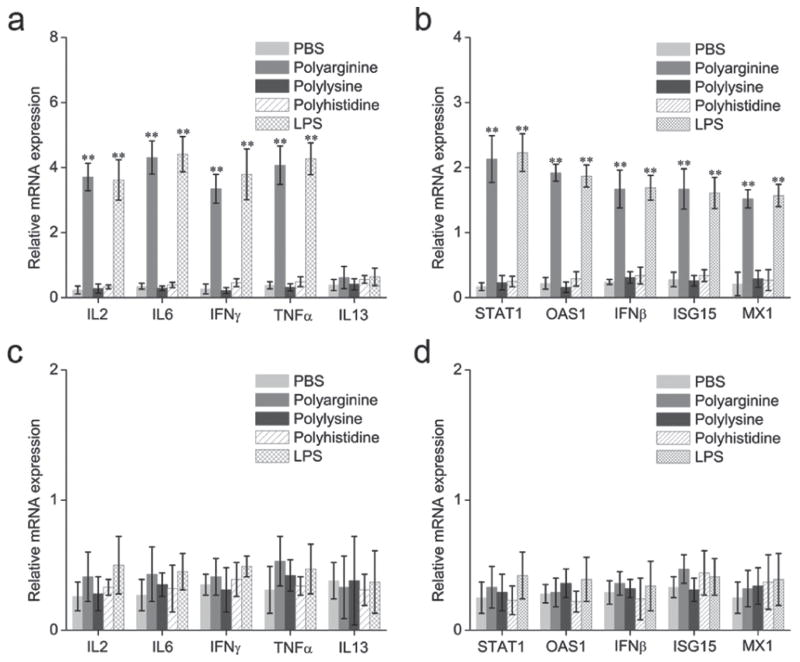
In order to evaluate the potency of polyarginine to activate the immune system, we profiled cytokine mRNA levels in mouse splenocytes. Splenocytes were selected as the experimental model of study as they are the reservoir of immune cells in the murine body. This reservoir is mostly comprised of B-lymphocytes, but also includes T cells and monocytes, thus representing both the innate and the adaptive arms of the immune system. Splenocytes harvested from C57BL/6 mice were exposed to phosphate buffered saline (PBS), lipopolysaccharide (LPS) or polyarginine for 2 h, where after the cells were washed and lysed. LPS, which is derived from the outer membrane of gram-negative bacteria, was used as a positive control, as it is an agonist of TLR4. Quantitative RT-PCR was employed to quantify the messenger RNA (mRNA) levels of various cytokines, including interleukin 2 (IL-2), interleukin- 6 (IL-6), interleukin 13 (IL-13), tumor necrosis factor alpha (TNFα), interferon gamma (IFNγ), and the interferon responsive genes (IRG); 2′-5′-oligoadenylate synthetase 1 (OAS1), signal transducer and activator of transcription 1 (STAT1), interferon beta (IFNβ), myxovirus resistance 1 (MX1) and ubiquitin-like protein ISG15 (ISG15). The gene expression levels were normalized against the housekeeping gene glyceraldehyde 3-phosphate dehydrogenase (GAPDH). Figure 1a illustrates that the expression levels of almost all of the above-mentioned cytokines increased approximately 10–15-fold in response to polyarginine, reaching equal levels to that of the LPS control group. Similarly, expression of the IRGs increased 8–12-fold when exposed to polyarginine (Figure 1b).
Figure 1.
Messenger RNA (mRNA) levels of cytokines and interferon response genes (IRGs) in spleconcyes after exposure to polyamino acids. (a–b) Splenocytes harvested from toll-like receptor4 (TLR4)+/+ C57BL/6 mice. (c–d) Splenocytes harvested from TLR4−/− C57BL/6 mice. Lipopolysaccharide (LPS) was used as a positive control for TLR4 activation. Data is plotted as the relative mRNA expression in comparison to glyceraldehyde 3-phosphate dehydrogenase (GAPDH). Data is expressed as mean ± SD. Statistical significance was measured by comparing experimental groups to the phosphate buffered saline (PBS) group. **p < 0.01. IFN β, interferon beta; IFN γ, interferon gamma; IL-2, interleukin 2; IL-6, interleukin-6; IL-13, interleukin 13; ISG15, ubiquitin-like protein ISG15; MX1, myxovirus resistance 1; OAS1, 2′-5′-oligoadenylate synthetase 1; STAT1, signal transducer and activator of transcription 1; TNF α, tumor necrosis factor alpha.
However, the cytokine IL13 remained unchanged after treatment with polyarginine or LPS. Previously, it has been shown that the levels of IL-13 increase in response to TLR2 activation but not TLR4 activation.[13] The observation that polyarginine and LPS produce almost identical reactions in splenocytes suggests that polyarginine is also an agonist for TLR4. To evaluate this notion, the expression levels of cytokines and IRGs were measured in splenocytes harvested from TLR4−/− C57BL/6 mice. Indeed, the results demonstrate the absence of an immune reaction in the splenocytes lacking TLR4 (Figure 1c–d), indicating that the polyarginine-induced immune response is TLR4 dependent.
Next, we assessed whether other polyamino acids also induced activation of the immune system. Polylysine and polyhistidine were added to splenocytes and the expression levels of cytokines and IRGs were measured. The results demonstrate that only polyarginine is capable of inducing an immune reaction (Figure 1a–b). Interestingly, polyarginine contains a guanidine group, which has proven useful for the transport of a variety of biopolymers and small molecules into cells and tissues.[14,15] As this guanidine group is absent from polylysine and polyhistidine, it is likely that this group is responsible for activating the TLR4.
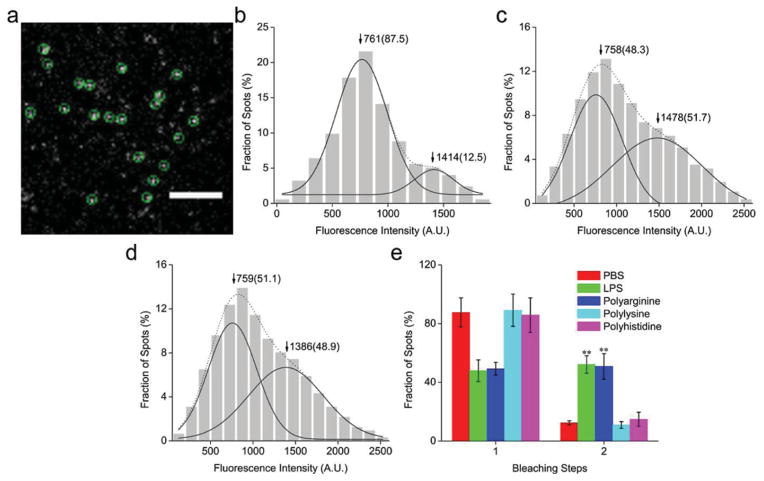
To investigate how polyarginine activates the TLR4 signaling pathway, total internal reflection fluorescence microscopy (TIRFM) was employed. In particular, we studied receptor dimerization, which is a prerequisite for TLR4 activation and signal propagation.[16] Prior to imaging, DC2.4 dendritic cells were transfected with a TLR4-green fluorescent protein (GFP) plasmid for 5 h. On the microscope images the TLR4-GFP molecules appeared as well-dispersed diffraction-limited fluorescent spots (5 × 5 pixels, 800 × 800 nm) (Figure 2a and Movie S1). The fluorescence intensity spots resembled a mix of two Gaussian distributions (Figure 2b). The first distribution had a peak intensity close to that of a single GFP molecule, indicating the presence of TLR4 monomers (Figure S1a). The second distribution had a two-fold higher peak value, indicative of TLR4 dimers. A total of 376 fluorescent spots were counted, of which 87.5% were monomers and 12.5% were dimers. In response to LPS stimulation, the population of monomers decreased to 48.3%, while the population of dimers increased to 51.7% (Figure 2c). This phenomenon suggests that LPS stimulation causes TLR4 receptor dimerization and activation.
Figure 2.
Single-molecule fluorescence imaging of the toll-like receptor 4 (TLR4). (a) A typical single-molecule image of TLR4-green fluorescent protein (GFP) on the DC2.4 dendritic cell membrane. The spots enclosed by a green circle represent a signal from an individual TLR4-GFP molecule. Scale bar: 4 μm. (b–d) Distribution graph of the fluorescence intensity of individual TLR4-GFP spots from control cells (b), cells stimulated with lipopolysaccharide (LPS) (c), and cells exposed to polyarginine (d). The solid curves show the fitting of the Gaussian function, with the arrowheads indicating the peak positions. The two peaks represent a population of monomers and dimers, and the numbers in parentheses indicate the percentage of all counted spots. (e) Frequency of one- and two-step bleaching events. Data is expressed as mean ± SD. Statistical significance was measured by comparing the treatment groups to phosphate buffered saline (PBS). **P < 0.01.
In parallel, cells were treated with polyarginine, polylysine or polyhistidine. The fluorescence intensity distribution in response to polyarginine was similar to that obtained with LPS treatment (Figure 2d). Conversely, polylysine and polyhistidine did not increase the population of TLR4 dimers (Figure S1b–c). These results are consistent with the cytokine studies, supporting the notion that polyarginine is an agonist to TLR4. To further confirm the presence of two distinct receptor populations, the TLR4 molecules were subjected to photobleaching (Figure 2e). Bleaching-step counting is an emerging technique to determine the subunit number of membrane-bound proteins tagged to GFP.[17] The plots obtained with this approach reveal an LPS and polyarginine-induced increase of two-step photobleaching spots (Figure S2a–b), hence, confirming the results obtained with the fluorescence distribution graphs. For comparison, the TLR4 photobleaching steps of cells treated with polylysine or polyhistidine were analyzed. Indeed, no significant change in the TLR4 dimer/monomer populations could be observed in response to these polyamino acids (Figure 2e).
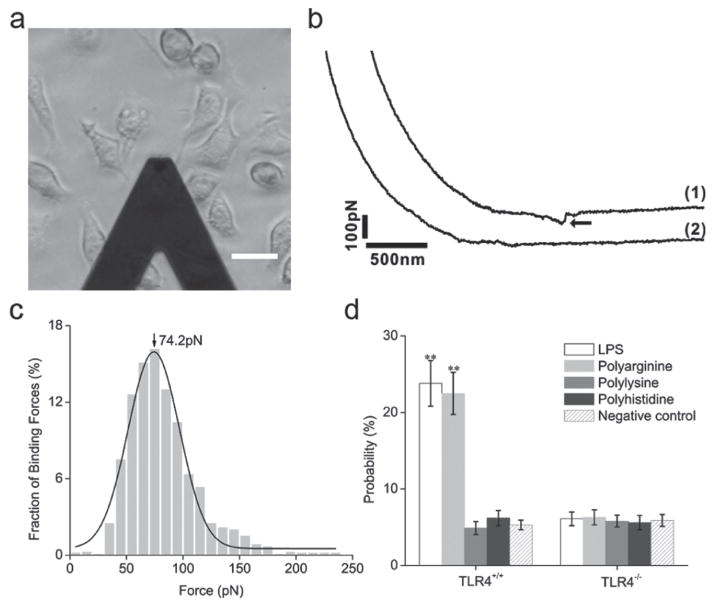
To investigate whether receptor dimerization was a consequence of polyarginine binding to TLR4, live-cell single-molecule force spectroscopy was performed. Previously, this technique has been used to measure the binding force between ligand-receptor pairs.[18] Briefly, an atomic force microscopy (AFM) tip was modified with polyarginine, polylysine or polyhistidine. The AFM tip was then moved in the vicinity of TLR4+/+ or TLR4−/− DC2.4 cells (Figure 3a) and the rupture force was detected as the tip broke contact with the cell (Figure 3b). A substantial binding force could only be observed with TLR4+/+ DC2.4 cells (Figure 3c). A binding force of equal magnitude could not be detected when the AFM tip was modified with polylysine or polyhistidine. Furthermore, polyarginine and LPS displayed higher binding probability to TLR4, when compared to polylysine and polyhistidine (Figure 3d).
Figure 3.
Binding force measurements between toll-like receptor 4 (TLR4) and polyamino acids in DC2.4 dendritic cells. (a) An illuminated image of binding force measurements. Scale bar: 20 μm. (b) Force curves obtained in TLR4+/+ cells (1) and TLR4−/− cells (2) using an AFM tip modified with polyarginine. The arrowhead indicates the specific binding force between polyarginine and TLR4. (c) Histogram of the binding forces between polyarginine and TLR4 in TLR4+/+ DC2.4 cells. The bars represent the experimental data, while the solid line is the theoretical Gaussian distribution curve. (d) The binding probability of polyarginine, polylysine, polyhistidine or lipopolysacharide (LPS) to TLR4 in TLR4+/+ or TLR4−/− cells. Data is expressed as mean ± SD. Statistical significance was measured by comparing data obtained with the modified AFM tip to data obtained using an unmodified tip. **P < 0.01.
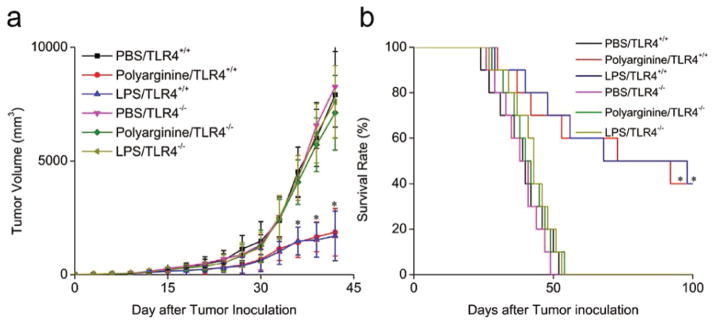
Previous studies have revealed that TLR4 agonists are effective for the treatment of melanoma.[19,20] Therefore, we examined the antitumor efficacy of polyarginine in a subcutaneous B16 murine melanoma model. Wild type C57BL/6 and TLR4−/− C57BL/6 mice received subcutaneous injection of PBS or polyarginine. As shown in Figure 4a, the tumor growth was significantly suppressed in the polyarginine or LPS-treated TLR4+/+ mice, but not in the TLR4−/− mice. All control mice died 54 days after cancer cell inoculation, whereas 40% of the polyarginine or LPS-treated TLR4+/+ mice survived beyond day 100 (Figure 4b). Hence, the immunostimulatory effect of polyarginine is evident both in vitro and in vivo.
Figure 4.

Anticancer efficacy of polyarginine in a subcutaneous B16 murine melanoma model. Toll-like receptor 4 (TLR4)+/+ and TLR4−/− C57BL/6 mice received subcutaneous injection of phosphate buffered saline (PBS), polyarginine or lipopolysacharide (LPS). Tumor volume (a, n = 6) and survival (b, n = 10) were recorded. Data are expressed as mean ± SD. Statistical significance was measured by comparing the polyarginine or LPS TLR4+/+ mice with the PBS TLR4+/+ mice. *P < 0.05.
In summary, we have discovered that polyarginine is a TLR4 agonist and activator of the immune system. Single-molecule fluorescence microscopy and force spectroscopy results reveal that polyarginine binds to TLR4, causing receptor dimerization. Concurrently, we have shown that polylysine and polyhistidine do not elicit a TL4-dependent immune response, suggesting that the guanidine groups of polyarginine may be responsible for TLR4 activation. Furthermore, we demonstrate that polyarginine can suppress tumor growth in a murine melanoma model. Taken together, these results indicate that polyarginine has the potential to be used for cancer immunotherapy. This study could also have implications for the use of polyarginine as a delivery agent for nucleic acids, as activation of the immune system is not desirable for this application.
Experimental Section
Cells, Mice and Reagents
High pure polyarginine (100 monomers, 15–16 kDa), polylysine (100 monomers, 12.5–13.5 kDa) and polyhistidine (100 monomers, 13.5–14.5 kDa) were synthesized from SCILIGHT-PEPTIDE. TLR4+/+ and TLR4−/− DC2.4 dendritic cells were kindly provided by Dr. Kenneth Rock (University of Massachusetts Medical Center). Healthy C57BL/6 mice (TLR4+/+ mice) were purchased from Charles Rive. TLR4 deficient C57BL/6 mice (TLR4−/− mice) were a kind gift from Dr. G. Nussbaum (Hebrew University). B-16 melanoma cells were purchased from ATCC. Total RNAs were extracted with the RNeasy mini kit from QIAGEN and reverse-transcribed by Superscript III from Invitrogen. Lipopolysaccharide (LPS) was purchased from Sigma. Primers for quantitative RT-PCR were obtained from Sigma.
Cytokines and interferon responsive genes induction assays
Mice splenocytes were isolated from the spleen as previously described.[21] Expression of cytokines and interferon responsive genes (IRG) were examined by quantitative RT-PCR. mRNA levels of cytokines, as well as a panel of IRG were quantified either after treatment with PBS, LPS (100 ng/mL), polyarginine (10 μM), polylysine (10 μM) or polyhistidine (10 μM). LPS was used as a positive control.
Quantitative RT-PCR
Quantitative RT-PCR was carried out as previously described.[22] RNA was extracted from the cells using RNeasy kit (QIAGEN). Total RNA (1 mg) was reverse transcribed into cDNA using Superscript III from Invitrogen in a 25 ml reactions. GAPDH served as endogens control. The following primer pairs were used:
IL-2 primers: forward primer: 5′-TGCAAACAGTGCACCTA-CTTCAA-3′; reverse primer: 5′-CCAAAAGCAACTTTAAATCCATCTG-3′.
IL-6 primers: forward primer: 5′-ATCCAGTTGCCTTCTTGG-GACTGA-3′; reverse primer: 5′-TAAGCCTCCGACTTGTGAAGTGGT-3′.
IL-13 primers: forward primer: 5′-CTGTGAGCCTTGTCCTCCTC-3′; reverse primer: 5′-TTGGTGAGCCAGTGAGACG-3′.
TNFα primers: forward primer: 5′-CCTGTAGCCCACGTCGTAGC-3′; reverse primer: 5′-TTGACCTCAGCGCTGAGTTG-3′.
IFNβ primers: forward primer: 5′-CTGGAGCAGCTGAATG-GAAAG-3′; reverse primer: 5′-CTTGAAGTCCGCCCTGTAGGT-3′.
IFNγ primers: forward primer: 5′-TGAACGCTACACACTG-CATCTTGG-3′; reverse primer: 5′-CTCAGGAAGCGGAAAAGGAGTCG-3′.
STAT1 primers: forward primer: 5′-TTTGCCCAGACTCGAGCT-CCTG-3′; reverse primer: 5′-GGGTGCAGGTTCGGGATTCAAC-3′.
OAS1 primers: forward primer: 5′-GGAGGTTGCAGTGCCAAC-GAAG-3′; reverse primer: 5′-TGGAAGGGAGGCAGGGCATAAC-3′.
MX1 primers: forward primer: 5′-GAATAGCAACTCCATACCGTG-3′; reverse primer: 5′-GTATTAAAGGTTGCTGCTAATG-3′.
ISG15 primers: forward primer: 5′-GTGGTGCAGAACTGCAT CTC-3′; reverse primer: 5′-GCCAGAACTGGTCTGCTTGT-3′.
GAPDH primers: forward primer: 5′-TTCACCACCATGGAGA-AGGC-3′; reverse primer: 5′-GGCATGGACTGTGGTCATGA-3′.
Plasmid Construction
The DNA fragment encoding full-length TLR4 was subcloned into the HindIII and BamHI sites of pEGFP-N1 (Clontech), yielding the TLR4-green fluorescent protein (GFP) expression plasmid. The plasmid was confirmed by DNA sequencing.
Cell Culture and Transfection
TLR4+/+ and TLR4−/− DC2.4 cells were cultured in complete media comprised of RPMI-1640 (Gibco), supplemented with 10% FBS (Hyclone). Transfection was performed using FuGENE6 (Promega). Cells growing in a 35-mm glass-bottom dish (MatTek) were transfected with 0.2 μg/mL plasmids in the medium. To achieve a low-level protein expression, cells were incubated with the plasmid for 5 h, washed, and then imaged under the fluorescence microscopy. For the stimulation experiment, the transfected cells were added with LPS (100ng/ml), polyarginine (10 μM), polylysine (10 μM) or polyhistidine (10 μM) treatment in the medium for 30 min at 37°C.
Single Molecule Fluorescence Imaging
Single molecule fluorescence imaging was performed with the objective-type total internal reflection fluorescence microscopy using an inverted microscope (IX 81, Olympus), a total internal reflective fluorescence illuminator, a 100X/1.45NA Plan Apochromat TIR objective (Olympus) and a 14-bit back-illumanated electron-multiplying charge-coupled device (EMCCD) (Andor iXon DU-897 BV). The microscope was equipped with a CO2 incubation system (INU-ZIL-F1, TOKAI HIT) and all living cell imaging was performed at 37°C in 5% CO2. GFP was excited at 488-nm by an argon laser (Melles Griot) with the power of 5 mW measured after the laser passing through the objective in the epi-fluorescence mode. The collected fluorescent signals were passed through two filters, BA510IF and HQ 525/50 (Chroma Technology), before directed to the EMCCD. The gain of EMCCD was set at 300. As the intensity at the edge of illumination field of TIRFM was about 80% of that in the center, only the central quarter of the chip (256 × 256 pixels) was used for imaging analysis to ensure homogeneous illumination. Movies of 200 frames were acquired for each sample at a frame rate of 10 Hz using MetaMorph software (Molecular Device).
For the control experiment of single GFP molecule imaging on coverslip, GFP protein purified from E. coli was firstly dissolved in the high salt buffer (600 mM NaCl, 150 mM PBS buffer, pH 7.4) to prevent the dimer formation and then immobilized on the coverslips through biotin coupled GFP antibody (Clontech) as previously reported.[23]
Image Analysis
For analysis of single-molecule fluorescence intensity in a movie acquired from living cells, the background fluorescence was first substracted from each frame using the rolling ball method in Image J software (NIH). Then the first frame of each movie was used for fluorescent spot (regions of interest) selection. The image was thresholded (four times of the mean intensity of an area with no fluorescent spots), then filtered again with a user-defined program in Matlab. The fluorescent spots were selected as previously reported.[23]
To analyze the bleaching steps, regions of interest for bleaching analysis were selected according to the method previously reported.[23] The background fluorescence was subtracted from the movie acquired from the fixed cells using the rolling ball method in Image J software. For each group the same amount of spots were analyzed.
AFM Tip Preparation
AFM silicon nitride (Si3N4) tips (type: NP, Veeco) were used in the experiments. Chemical modification of AFM tips were carried out as previous reported.[18]
AFM Force Measurement
The force measurements of the LPS, polyarginine, polylysine or polyhistidine modified AFM tips on the living cells were carried out on a PicoSPM II with PicoScan 3000 controller and a large scanner (Molecular Imaging). The AFM scanner was mounted on an inverted fluorescence microscopy (Olympus IX71, Japan). The loading rate of Force measurements was 1.0 × 10⁴ pN/s. The force curves measured in living TLR4+/+ or TLR4−/− DC2.4 cells were recorded and analyzed by PicoScan 5 software (Molecular Imaging). All forces were measured with contact mode at room temperature.
Inoculation of tumor cells and subcutaneous administration of polyarginine
The animal studies were performed in accordance with guidelines of the Animal Welfare Act and the guide for the care and use of laboratory animals following protocols approved by the Institutional Animal Care and Use Committee (IACUC). 1 × 10⁶ B16 melanoma cells were inoculated subcutaneously into shaved lateral flanks of the TLR4+/+ or TLR4−/− mice. The mice were given a suspension of 100 μl polyarginine (7.8 mg/ml), LPS (5 μg/ml) or PBS subcutaneous injection once every 5 days from 1 day before tumor inoculation. The size of primary tumors was determined every 3 days using calipers. Tumor volume was calculated using the formula V = (A × B2)/2, where V is the volume (mm3), A is the long diameter (mm) and B is the short diameter (mm).
Statistical analysis
Data were measured by analysis of variance, followed by Student’s t-test (Microsoft Excel) for multiple comparisons. Data were performed as mean ± SD.
Supplementary Material
Acknowledgments
This research was supported by the following grants: Ernest Cockrell Jr. Distinguished Endowed Chair, US Department of Defense (W81XWH-09–1–0212), National Institute of Health (U54CA143837, U54CA151668), National Basic Research Program of China (2011CB935601), NSFC (Nos 90713024, 20821003) and Chinese Academy of Sciences.
Footnotes
Supporting Information is available from the Wiley Online Library or from the author.
Contributor Information
Dr. Yong Yang, Email: yyang@tmhs.org, Department of Nanomedicine, The Methodist Hospital Research Institute, 6670 Bertner Ave, Houston, TX, 77030, USA
Joy Wolfram, Department of Nanomedicine, The Methodist Hospital Research Institute, 6670 Bertner Ave, Houston, TX, 77030, USA.
Dr. Xiaohong Fang, Key Laboratory of Molecular Nanostructures and Nanotechnology, Institute of Chemistry, Chinese Academy of Sciences, Beijing, 100190, China
Dr. Haifa Shen, Department of Nanomedicine, The Methodist Hospital Research Institute, 6670 Bertner Ave, Houston, TX, 77030, USA
Prof. Mauro Ferrari, Email: mferrari@tmhs.org, Department of Nanomedicine, The Methodist Hospital Research Institute, 6670 Bertner Ave, Houston, TX, 77030, USA
References
- 1.Medzhitov R. Nat Rev Immunol. 2001;1:135. doi: 10.1038/35100529. [DOI] [PubMed] [Google Scholar]
- 2.Akira S, Takeda K. Nat Rev Immunol. 2004;4:499. doi: 10.1038/nri1391. [DOI] [PubMed] [Google Scholar]
- 3.Robinson RA, DeVita VT, Levy HB, Baron S, Hubbard SP, Levine AS. J Natl Cancer Inst. 1976;57:599. doi: 10.1093/jnci/57.3.599. [DOI] [PubMed] [Google Scholar]
- 4.Tokunaga T, Yamamoto H, Shimada S, Abe H, Fukuda T, Fujisawa Y, Furutani Y, Yano O, Kataoka T, Sudo T, Makiguchi N, Suganuma T. J Natl Cancer Inst. 1984;72:955. [PubMed] [Google Scholar]
- 5.Reisser D, Pance A, Jeannin JF. Bioessays. 2002;24:284. doi: 10.1002/bies.10053. [DOI] [PubMed] [Google Scholar]
- 6.Uehori J, Matsumoto M, Tsuji S, Akazawa T, Takeuchi O, Akira S, Kawata T, Azuma I, Toyoshima K, Seya T. Infect Immun. 2003;71:4238. doi: 10.1128/IAI.71.8.4238-4249.2003. [DOI] [PMC free article] [PubMed] [Google Scholar]
- 7.Wolf IH, Smolle J, Binder B, Cerroni L, Richtig E, Kerl H. Arch Dermatol. 2003;139:273. doi: 10.1001/archderm.139.3.273. [DOI] [PubMed] [Google Scholar]
- 8.Kamiryo Y, Yajima T, Saito K, Nishimura H, Fushimi T, Ohshima Y, Tsukamoto Y, Naito S, Yoshikai Y. Int J Cancer. 2005;115:769. doi: 10.1002/ijc.20934. [DOI] [PubMed] [Google Scholar]
- 9.Paulos CM, Kaiser A, Wrzesinski C, Hinrichs CS, Cassard L, Boni A, Muranski P, Sanchez-Perez L, Palmer DC, Yu Z, Antony PA, Gattinoni L, Rosenberg SA, Restifo NP. Clin Cancer Res. 2007;13:5280. doi: 10.1158/1078-0432.CCR-07-1378. [DOI] [PMC free article] [PubMed] [Google Scholar]
- 10.Paulos CM, Wrzesinski C, Kaiser A, Hinrichs CS, Chieppa M, Cassard L, Palmer DC, Boni A, Muranski P, Yu Z, Gattinoni L, Antony PA, Rosenberg SA, Restifo NP. J Clin Invest. 2007;117:2197. doi: 10.1172/JCI32205. [DOI] [PMC free article] [PubMed] [Google Scholar]
- 11.Adams S. Immunotherapy. 2009;1:949. doi: 10.2217/imt.09.70. [DOI] [PMC free article] [PubMed] [Google Scholar]
- 12.Gnjatic S, Sawhney NB, Bhardwaj N. Cancer J. 2010;16:382. doi: 10.1097/PPO.0b013e3181eaca65. [DOI] [PMC free article] [PubMed] [Google Scholar]
- 13.Yang D, Chen Q, Su SB, Zhang P, Kurosaka K, Caspi RR, Michalek SM, Rosenberg HF, Zhang N, Oppenheim JJ. J Exp Med. 2008;205:79. doi: 10.1084/jem.20062027. [DOI] [PMC free article] [PubMed] [Google Scholar]
- 14.Mitchell DJ, Kim DT, Steinman L, Fathman CG, Rothbard JB. J Pept Res. 2000;56:318. doi: 10.1034/j.1399-3011.2000.00723.x. [DOI] [PubMed] [Google Scholar]
- 15.Lattig-Tunnemann G, Prinz M, Hoffmann D, Behlke J, Palm-Apergi C, Morano I, Herce HD, Cardoso MC. Nat Commun. 2011;2:453. doi: 10.1038/ncomms1459. [DOI] [PMC free article] [PubMed] [Google Scholar]
- 16.Tsukamoto H, Fukudome K, Takao S, Tsuneyoshi N, Kimoto M. Int Immunol. 2010;22:271. doi: 10.1093/intimm/dxq005. [DOI] [PubMed] [Google Scholar]
- 17.Ulbrich MH, Isacoff EY. Nat Methods. 2007;4:319. doi: 10.1038/NMETH1024. [DOI] [PMC free article] [PubMed] [Google Scholar]
- 18.Shi X, Xu L, Yu J, Fang X. Exp Cell Res. 2009;315:2847. doi: 10.1016/j.yexcr.2009.05.023. [DOI] [PubMed] [Google Scholar]
- 19.Andreani V, Gatti G, Simonella L, Rivero V, Maccioni M. Cancer Res. 2007;67:10519. doi: 10.1158/0008-5472.CAN-07-0079. [DOI] [PubMed] [Google Scholar]
- 20.Davis MB, Vasquez-Dunddel D, Fu J, Albesiano E, Pardoll D, Kim YJ. Clin Cancer Res. 2011;17:3984. doi: 10.1158/1078-0432.CCR-10-3262. [DOI] [PMC free article] [PubMed] [Google Scholar]
- 21.Moyano DF, Goldsmith M, Solfiell DJ, Landesman-Milo D, Miranda OR, Peer D, Rotello VM. J Am Chem Soc. 2012;134:3965. doi: 10.1021/ja2108905. [DOI] [PMC free article] [PubMed] [Google Scholar]
- 22.Yang Y, Wolfram J, Boom K, Fang X, Shen H, Ferrari M. Cell Biochem Funct. 2012 doi: 10.1002/cbf.2905. [DOI] [PMC free article] [PubMed] [Google Scholar]
- 23.Zhang W, Jiang Y, Wang Q, Ma X, Xiao Z, Zuo W, Fang X, Chen YG. Proc Natl Acad Sci USA. 2009;106:15679. doi: 10.1073/pnas.0908279106. [DOI] [PMC free article] [PubMed] [Google Scholar]
Associated Data
This section collects any data citations, data availability statements, or supplementary materials included in this article.


