Summary
Cells of the osteoblast lineage affect homing, 1, 2 number of long term repopulating hematopoietic stem cells (HSCs) 3, 4, HSC mobilization and lineage determination and B lymphopoiesis 5-8. More recently osteoblasts were implicated in pre-leukemic conditions in mice 9, 10. Yet, it has not been shown that a single genetic event taking place in osteoblasts can induce leukemogenesis. We show here that in mice, an activating mutation of β-catenin in osteoblasts alters the differentiation potential of myeloid and lymphoid progenitors leading to development of acute myeloid leukemia (AML) with common chromosomal aberrations and cell autonomous progression. Activated β-catenin stimulates expression of the Notch ligand Jagged-1 in osteoblasts. Subsequent activation of Notch signaling in HSC progenitors induces the malignant changes. Demonstrating the pathogenetic role of the Notch pathway, genetic or pharmacological inhibition of Notch signaling ameliorates AML. Nuclear accumulation and increased β-catenin signaling in osteoblasts was also identified in 38% of patients with MDS/AML. These patients showed increased Notch signaling in hematopoietic cells. These findings demonstrate that genetic alterations in osteoblasts can induce AML, identify molecular signals leading to this transformation and suggest a potential novel pharmacotherapeutic approach to AML.
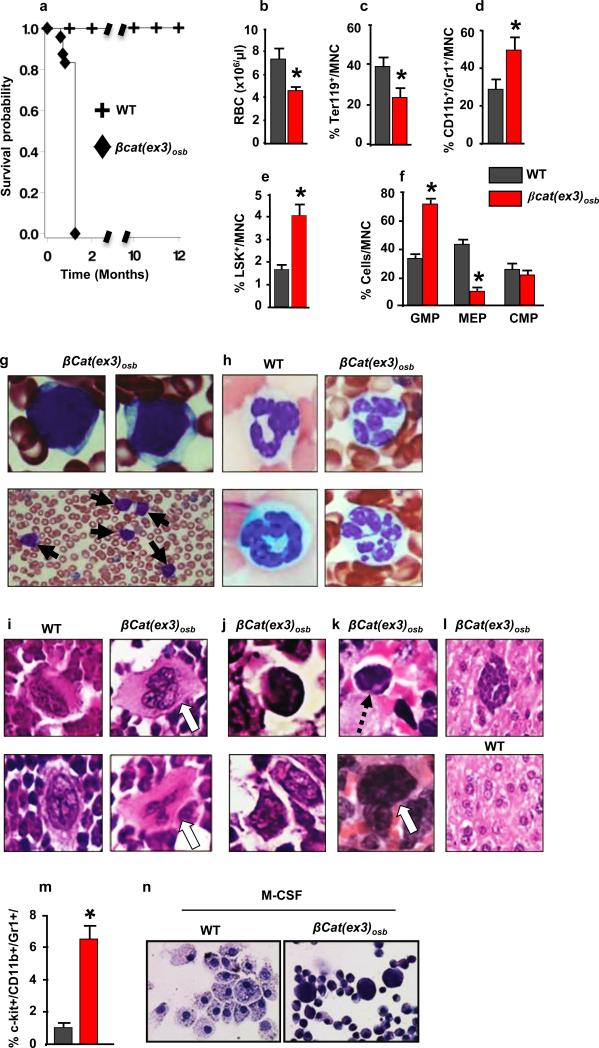
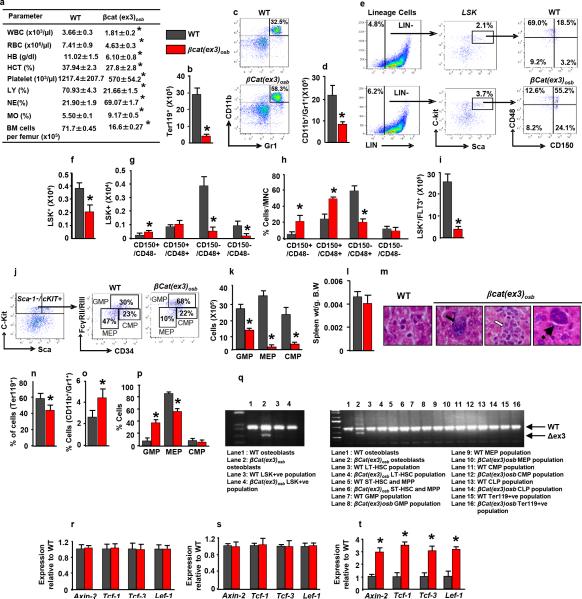
Mice expressing a constitutive active β-catenin allele in osteoblasts, (βcat(ex3)osb), are osteopetrotic11, and die before 6 weeks of age (Fig. 1a) of unknown reasons. Upon further examination βcat(ex3)osb mice were anemic at 2 weeks of age with peripheral blood monocytosis, neutrophilia, lymphocytopenia and thrombocytopenia (Extended Data Fig. 1a). Erythroid cells were decreased in the marrow and extramedullary hematopoiesis was observed in the liver (Fig. 1c and Extended Data Fig. 1b,l,m). Although the number of myeloid (CD11b+/Gr1+) cells decreased due to osteopetrosis, their relative percentage increased suggesting a shift in the differentiation of HSCs to the myeloid lineage (Fig. 1d and Extended Data Fig. 1c,d). The hematopoietic stem and progenitor cell (HSPC) population in the bone marrow (Lin-Sca+c-Kit+, LSK) cells decreased 2-fold in βcat(ex3)osb mice, but their percentage was 2-fold greater than in WT littermates (Fig. 1e and Extended Data Fig. 1e,f). The long term repopulating HSC progenitors (LT-HSCs), increased in numbers and percentage whereas the lymphoid-biased multipotential progenitors, LSK+/FLT3+, and the granulocyte/monocyte progenitors (GMP) (Extended Data Fig. 1g-j) decreased. The GMP percentage increased (Fig. 1f). Identical abnormalities were observed in the spleen of βcat(ex3)osb mice (Extended Data Fig. 1n-p). The mutation was introduced in osteoblasts but not in any cells of the hematopoietic compartment (Extended Data Fig.1q-t) of βcat(ex3)osb mice.
Figure 1. Anemia and myeloid lineage expansion in βcat(ex3)osb mice.
a, Lethality b, anemia c, decreased erythroid progenitors and increased percentage of d, monocytic/granulocytic, e, LSK, f, myeloid progenitor populations in the marrow and g, immature monocytic blasts and h, hypersegmented neutrophils in the blood (13-81% neutrophils and 12%-90% blasts). i, Bone marrow sections showing micro-megakaryocytes with hyperchromatic nuclei and j, blasts. k, In the spleen, cells with large nucleoli (dotted arrow) and dysplastic megakaryocytes (white arrow). l, Cluster of immature cells with atypical nuclear appearance in the liver. m, Increased percentage of undifferentiated imature myeloid cells in the bone marrow of βCat(ex3)osb mice. n, Lack of myeloid cell differentiation in βCat(ex3)osb bone marrow cells. N=8 mice per WT and 12 mice per βcat(ex3)osb groups. Results show a representative of five independent experiments, *p < 0.05 versus WT. Results are mean ± SD. MNC: mononuclear cells.
Extended Data Figure 1. Anemia, peripheral blood leukocytosis and monocytosis and deregulated hematopoiesis specific activation of β-catenin in osteoblasts of β-Cat(ex3)osb mice.
a, Hematopoietic parameters. White blood cells (WBC), Red blood cells (RBC), Hemoglobin (HB), Hematocrit (HCT), platelets, lymphocytes (LY), Neutrophiles (NE), Monocytes (MO) in 2 weeks old mice. b-k, In the bone marrow b, Erythroid cell numbers. c, Representative flow cytometry image showing monocytic/granulocytic (CD11b+/Gr1+) subset. d, Numbers of the CD11b+/Gr1+ subset. e, Distribution of LSK (Lineage-Sca+C-kit+) population. f, LSK numbers g, Frequency and h, Percentage of LT-HSCs and ST-HSCs. i, Numbers of LSK+/FLT3+ cells. j, Myeloid progenitor profile by CD34-versus-FcgRII/III analysis of electronically gated Lin–Sca-1–c-Kit+ bone marrow cells. k, Numbers of myeloid progenitor populations. l, Spleen weight. m, Extramedullar hematopoiesis in the liver of 3 weeks old βcat(ex3)osb mice indicated by megakaryocytes (solid arrows), myeloid (open arrows) and rare erythroid precursors (dotted arrows). Percentage of n, Ter119+, o, CD11b+/Gr1+ and p, myeloid progenitor populations in the spleen. q, PCR analysis of genomic DNA from osteoblasts and indicated hematopoieic populations from WT and βCat(ex3)osb mice. r-t, Real-Time PCR analysis of b-catenin targets in r, bone marrow CD45+CD34+CD31+ cells, s, spleen and t, bones. In a N=6, b-k, n-p N=8, l, m N=5, and r-t N=4 mice per group. Results are mean ± SD and show a representative from five (a-p) or 2 (q-t) independent experiments. *p < 0.05 versus WT. MNC: mononuclear cells.
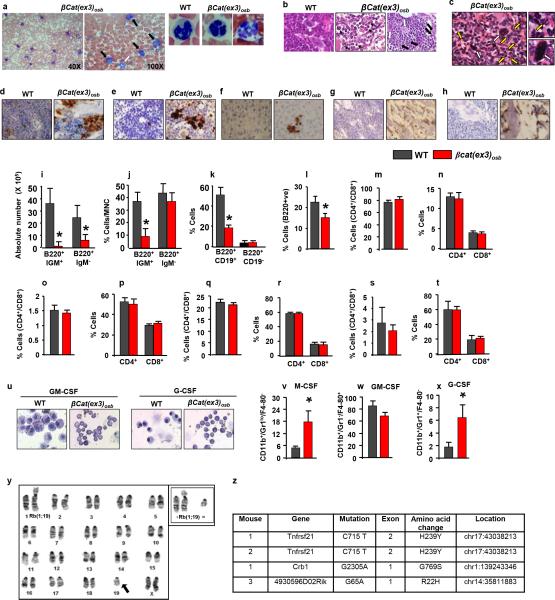
Blasts (12-90%) and dysplastic neutrophils (13-81%), were noted in the blood and there was dense and diffuse infiltration with myeloid and monocytic cells, blasts (30%-53% for n=12 mice) and dysplastic neutrophils in the marrow and spleen of βcat(ex3)osb mice (Fig. 1g-k, Extended Data Fig. 2a-c). In the liver, clusters of immature cells with atypical nuclear appearance were seen (Fig. 1l). The increase in immature myeloid cells was confirmed by staining with myeloid markers in bones, spleen and liver, (Extended Data Fig. 2d-h). Reduced B-lymphopoiesis without changes in T-cell populations was observed in βcat(ex3)osb mice (Extended Data Fig. 2i-t). Differentiation blockade was demonstrated by the presence of immature myeloid progenitors in βcat(ex3)osb marrow and differentiation cultures (Fig. 1m-n and Extended Data Fig. 2u-x). These cellular abnormalities fulfill the criteria of AML diagnosis in mice 12 with principle features of human AML 13, 14.
Extended Data Figure 2. Multi-organ infiltration with blasts and dysplastic cells and myeloid differentiation block in βCat(ex3)osb mice.
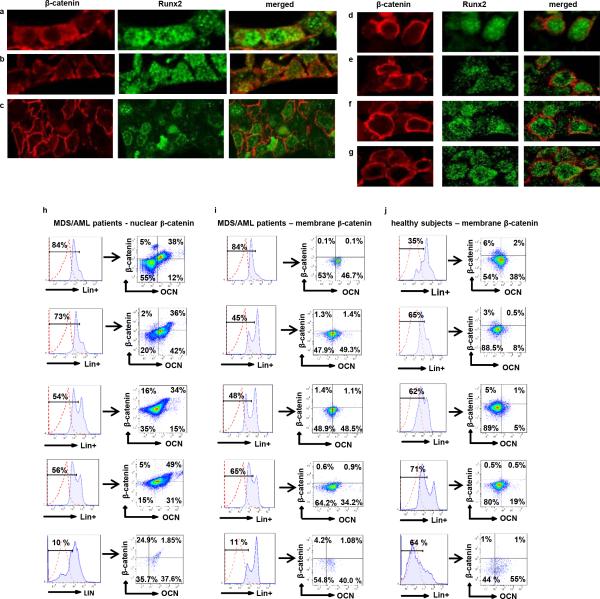
a, Blast infiltration (solid arrows) and neutrophil hypersegmentation (open arrow and magnified panels) in the blood of βCat(ex3)osb mice. Images at 40x or 100x. b, Blast infiltration (solid arrows) and micro-megakaryocytes with hyperchromatic nuclei (white arrows) in the bone marrow of βCat(ex3)osb mice. Images at 60X. c, Blast infiltration (solid arrows and magnified panel) and presence of dysplastic megakaryocytes (yellow arrows and magnified panel) in the spleen of βCat(ex3)osb mice. Image at 400X. d-f, Myeloperoxidase (MPO) staining of d, long bone e, spleen and f, liver showing massive invasion of myeloid cells. g, CD117 (C-kit) staining of bone sections showing CD117+ blasts in βCat(ex3)osb mice. h, CD13 staining of bone sections showing myeloid/monocytic infiltration in βCat(ex3)osb mice. In d-h images at 60X magnification. i-j, B-cell progenitors numbers in the i-j, bone marrow, k, spleen and l, lymph nodes.. m-t, Proportion of T-cells. u, Lack of myeloid cell differentiation in βCat(ex3)osb bone marrow cells following treatment with cytokines. v-x, Percentage of immature myeloid cells in ex vivo bone marrow cultures treated with cytokines. y. Robertsonian translocation between chromosomes 1 and 19 in 2 of 30 metaphases of the spleen of an 18-day old βcat(ex3)osb mouse. Inset shows the same abnormality in another cell. z, Whole-exome sequencing of myeloid malignancies (CD11b+/Gr1+) from 3 cat(ex3)osb mice and 3 germline normal (tail) samples.
In (i-x) N=6, mice per group. *p < 0.05 versus WT. Results are mean ± SD and show a representative of five (i-t) or three (u-x) independent experiments.
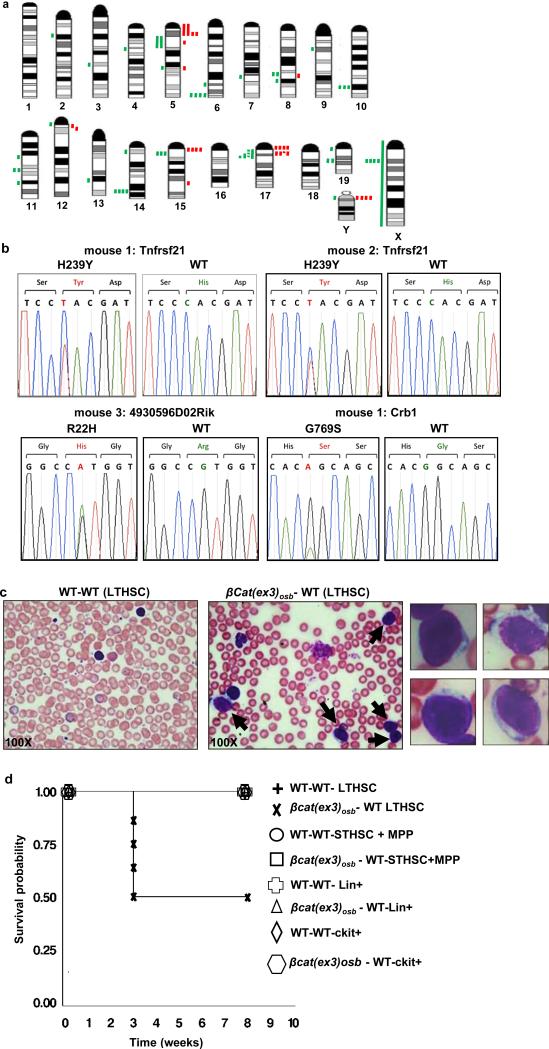
A clonal abnormality involving a Robertsonian translocation Rb(1;19) was identified in myeloid cells of the spleen of a βcat(ex3)osb mouse (Extended Data Fig. 2y). Recurrent numerical and structural chromosomal alterations were also detected in myeloid cells of the spleen of all mutant mice examined (Fig. 2a and Extended Data Table 1). Frequent abnormalities were detected in chromosome 5, the mouse ortholog of human chromosome 7q associated with common cytogenetic abnormalities in MDS/AML patients 15. Whole-exome sequencing identified 4 non-silent somatic mutations in myeloid cells from 3 βcat(ex3)osb mice (Fig 2b and Extended Data Fig. 2z), including a recurrent one in tnfrsf21 and a single somatic mutation in Crb1 previously reported in human AML,16 but which has insufficient statistical power to determine if it is a driver or passenger mutation. Hence, constitutive activation of β-catenin in osteoblasts facilitates clonal progression and is associated with somatic mutations in myeloid progenitors.
Figure 2. AML in βcat(ex3)osb mice.
a, Mouse chromosomal ideogram showing areas of genetic gain (red bars) and loss (green bars) identified by aCGH in βCat(ex3)osb mice. b, Sequence traces of somatic mutations in myeloid malignancies (CD11b+/Gr1+) from 3 βcat(ex3)osb mice. c, Blasts (12%-75%, solid arrows) in blood of sublethally irradiated CD45.1 WT mice transplanted with LT-HSCs from CD45.2 βcat(ex3)osb mice 4 weeks following transplantation. d, Lethality in WT mice transplanted with indicated hematopoietic populations from βcat(ex3)osb. N=7. Results show a representative of two independent experiments.
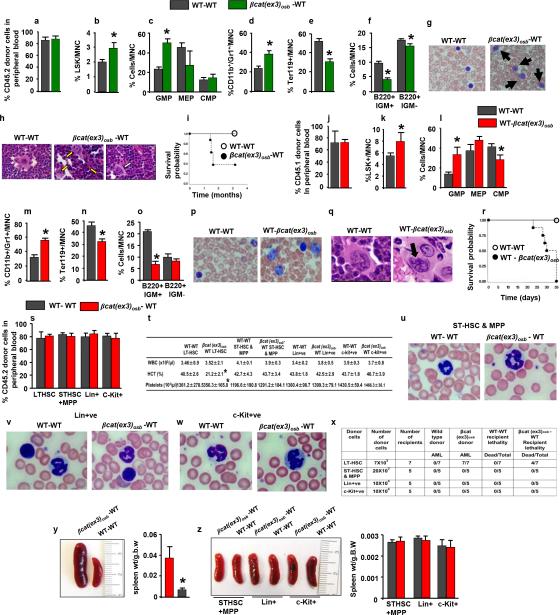
Transplantation of bone marrow cells from βcat(ex3)osb leukemic mice into lethally irradiated WT recipients induced all features of hematopoietic dysfunction, and AML observed in βcat(ex3)osb mice including blasts (15-80%) and dysplastic neutrophils (15-75%) in the blood and blasts (30-40%) and abnormal megakaryocytes in the marrow and early lethality (Extended Data Fig. 3a-i). Transplantation of WT bone marrow cells to lethally irradiated βcat(ex3)osb mice also resulted in AML with early lethality (Extended Data Fig. 3j-r). Transplantation of LT-HSCs, but not other hematopoietic populations, from βcat(ex3)osb mice to sublethally irradiated WT recipients resulted in AML with early lethality (Fig. 2c,d and Extended Data Fig. 3s-z) indicating that LT-HSCs are the leukemia-initiating cells (LICs). These results demonstrate that osteoblasts are the cells responsible for AML development in this model. Remarkably, HSCs of βcat(ex3)osb mice have acquired a permanent self-perpetuating genetic alteration that becomes independent of the initial mutation in osteoblasts.
Extended Data Figure 3. Cell autonomous AML development by bone marrow and LT-HSCs cells of βCat(ex3)osb mice.
a, Engraftment efficiency of CD45.2 βCat(ex3)osb bone marrow cells in lethally irradiated CD45.1 WT mice 7 weeks following transplantation. b-f, Percentage of indicated populations in bone marrow of transplanted mice. g, Blasts in blood (15-80%, solid arrows) of lethally irradiated CD45.1 WT mice transplanted with CD45.2 βCat(ex3)osb marrow cells 7 weeks following transplantation. h, Blasts (solid arrows) and dysplastic megakaryocytes (open arrow) in bone marrow of transplanted mice Images at 60x. i, Lethality curves. j, Engraftment efficiency of CD45.1 WT bone marrow cells in lethally irradiated CD45.2 βCat(ex3)osb mice. k-o, Increased percentage of k, LSK cells, l, myeloid progenitors, and m, CD11b+/Gr1+ cells and decreases in n, erythroid cells and o, B-lymphopoiesis in the bone marrow of transplanted mice. p, Blasts in the blood and q, bone marrow (solid arrows) of transplanted mice. Images were taken at o, 100x and p, 60x. r, Lethality curves. s, Engraftment efficiency of indicated bone marrow hematopoietic populations from 4-week old CD45.2 βCat(ex3)osb or wild type mice in sublethally irradiated CD45.1 WT mice after 4 weeks (for LT-HSCs, due to lethality) and 8 weeks (for other populations) of transplantation. t, Blood counts in wild type mice transplanted mice. u-w, Lack of blasts in the blood of wild type mice transplanted with indicated hematopoietic cells from βCat(ex3)osb mice. x, Disease development in wild type mice transplanted with indicated hematopoietic cells from βCat(ex3)osb mice. y, Splenomegaly in WT mice transplanted with LT-HSCs from βcat(ex3)osb. z, Spleen size and weight in WT mice transplanted with indicated hematopoietic populations from WT/βcat(ex3)osb mice. N=6 mice per group. Results are mean ± SD and show a representative of two independent experiments. *p < 0.05 versus WT- WT transplanted group.
All βcat(ex3)osb mice examined develop AML between 2 (40%) and 3.5 (60%) weeks of age. Livers of βcat(ex3)osb newborn mice show increased LSK cells and cells of the myeloid lineage, and a decrease in erythroid and B-lymphoid cells (Extended data Fig. 4a-j). Microhypolobated megakaryocytes, Pelger Huet neutrophils, seen in MDS and other congenital entities, and nuclear cytoplasmic asynchrony in the erythroid lineage were also seen in the liver and bone marrow of newborn βcat(ex3)osb mice while their spleens showed increased number of blasts and a shift towards the myeloid lineage (Extended Data Fig. 4k-m). These characteristics indicate deregulated hematopoiesis with neutrophil dyspoiesis at birth. Less than 20% blasts were seen in the marrow, consistent with a diagnosis of MDS with excess blasts (RAEB1/2). Differentiation blockade was not observed in newborn animals and fetal HSCs did not transfer the disease (Extended Data Fig. 4n-w) due to lack of HSC-osteoblast interaction in the fetal liver. These results, confirm that AML is induced by defective niche signals that are restricted to the bone marrow osteoblasts.
Extended Data Figure 4. Newborn βCat(ex3)osb mice show MDS but fetal HSCs from βCat(ex3)osb mice do not transfer AML.
a-e, Increased percentage of (a) LSK cells, (b) GMPs, and (c) CD11b+/Gr1+ cells and decreases in (d) erythroid cells and (e) B-lymphopoiesis in the liver of newborn (P1) βCat(ex3)osb mice. f-j, Increased percentage of (f) LSK cells, (g) GMPs, and (h) CD11b+/Gr1+ cells and decreases in (i) erythroid cells and (j) B-lymphopoiesis in the bone marrow of newborn (P1) βCat(ex3)osb mice. k, Liver, l, bone marrow and m, spleen of of newborn (P1) βCat(ex3)osb mice showing microhypolobated megakaryocytes (open arrows), Pelger Huet neutrophils (yellow arrows) or blasts (solid arrows) Images at 100x. n, Percentage of imature myeloid cells in the bone marrow of newborn mice. o-t, Flow cytometry and Giemsa-stained cytospins showing lack of changes in the percentage of immature myeloid cells in ex vivo cultures of bone marrow cells from P1 stage βCat(ex3)osb mice and treated with indicated cytokines. u, Engraftment efficiency of CD45.2 βCat(ex3)osb LSK cells obtained from the liver of embryonic day 18.5 embryos in sublethally irradiated CD45.1 WT mice. v, Normal peripheral blood measurements in transplanted mice. w, Lack of blasts in the blood of transplanted WT mice. Images at 100x. N=6 mice per group. Results are mean ± SD and represent at least two independent experiments. *p < 0.05 versus WT.
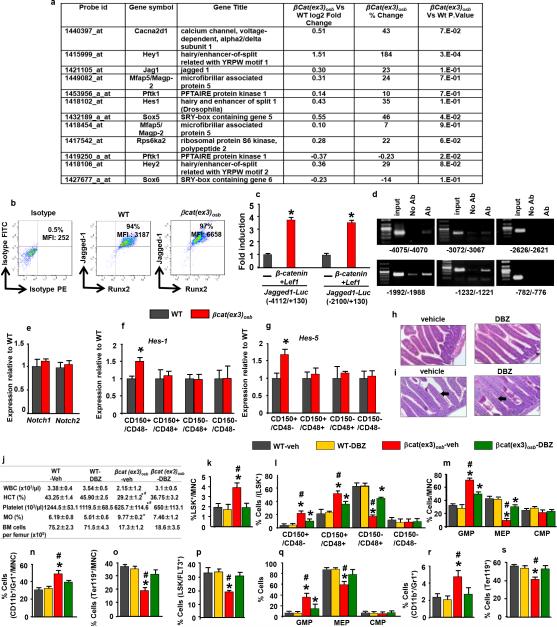
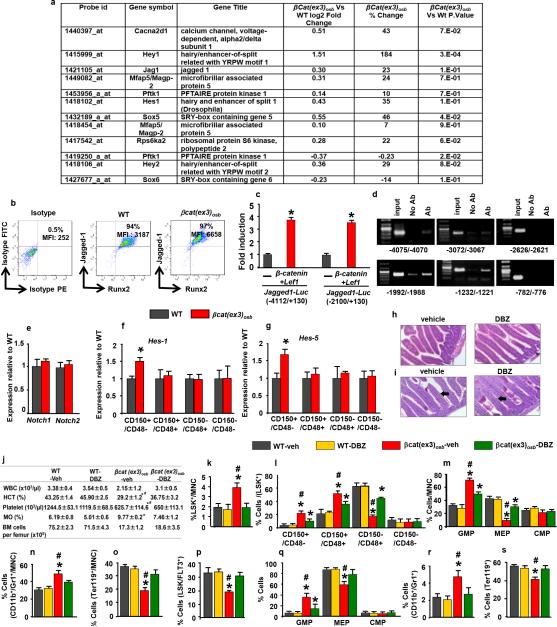
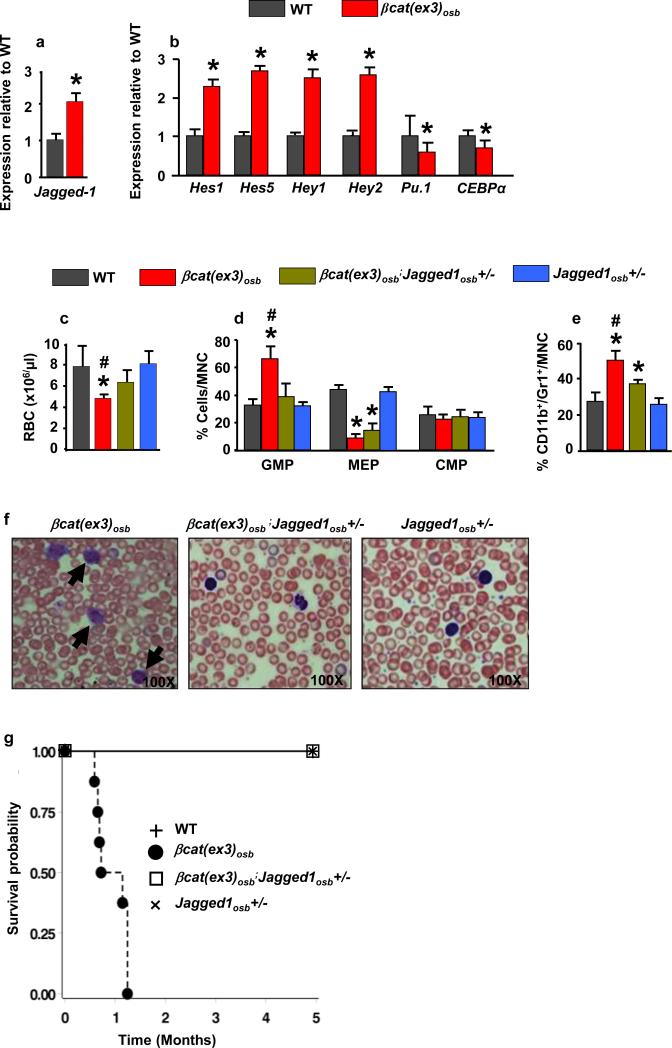
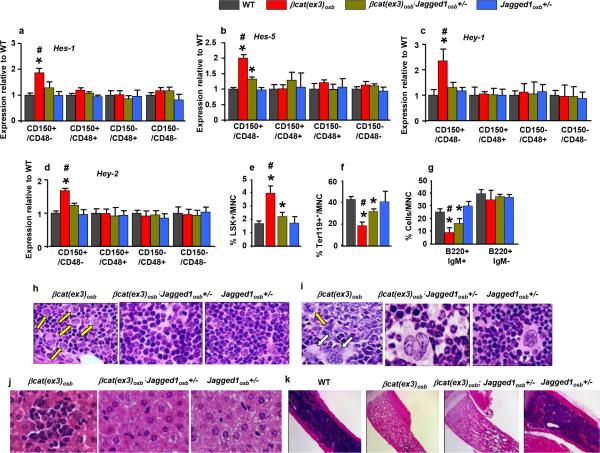
β-catenin target genes in osteoblasts that may regulate HSC fate were identified by microarray analysis. One gene, the Notch ligand Jagged-1, fulfilled 4 criteria: acts on adjacent cells, activates a pathway many targets of which are increased in the array, has been implicated in hematopoiesis and is regulated transcriptionally by β-catenin (Extended Data Fig. 5a-d and 17). Accordingly, Jagged-1 expression was increased in βcat(ex3)osb bones and expression of the Notch targets Hes1, Hes5, Hey1, Hey2 increased and Hes1 targets Cebpα and Pu.1 decreased in βcat(ex3)osb LSK cells of βcat(ex3)osb mice suggesting increased Notch signaling in this population (Fig. 3a,b and Extended Data Fig.5a,b,f-g). Notch1 and 2 expression was not affected (Extended Data Fig. 5e). Increased Notch signaling occurred specifically in the leukemia-initiating LT-HSCs without changes in the other LSK compartments (Extended Data Fig. 5f-g).
Extended Data Figure 5. Inhibition of increased Notch signaling normalizes blood counts and rescues hematopoietic defects in βCat(ex3)osb mice.
a, Microarray analysis of calvaria-derived osteoblasts from βCat(ex3)osb mice. AML and Notch-related genes in βCat(ex3)osb osteoblasts and with p<0.05 and fold change of ± 20% in one comparison. Genes which that are up- or down-regulated relative to WT are shown. b, Flow cytometry analysis of Jagged-1 expression in osteoblasts (MFI: mean fluorescent intensity). c, Luciferase activity in HEK293T cells co-transfected with β-Catenin, Lef1 and Jagged1-Luc reporter constructs (−4112/+130) and (−2100/+130). Results show fold induction over respective Jagged1-Luc reporter constructs. * p< 0.05 versus respective Jagged1-Luc. Results are mean ± SD. d, ChIP in primary osteoblasts using anti-β-catenin antibody. Primers spanned the putative TCF/LEF binding sites (indicated) on the Jagged-1 promoter. e, Expression of Notch1 and Notch2 in LSK+ cells. f-g, Expression of Notch targets in LSK+ subpopulations. i, Normal intestinal architecture and j, PAS staining showing lack of goblet cell (arrows) metaplasia in DBZ-treated mice. Images at 60x. k, Peripheral blood counts and bone marrow cellularity in wild type and βCat(ex3)osb mice treated daily with vehicle or DBZ (2μmol/kg body weight) for 10 days. l-p, Percentage of k, LSK cells, l, LSK+ subpopulations m, myeloid progenitors, n, CD11b+/Gr1+ population, o, erythroid cells. m, Percentage of erythroid cells and p, LSK+/FLT3+ population in the bone marrow. q-s, Percentage of q, myeloid progenitor populations, r, CD11b+/Gr1+ cells and s, erythroid cells in the spleen. In a N=3 mice per group and in b N=4 mice per group. In c,d results represent two independent experiments. In (e-g) N=4 mice per group, and *p < 0.05 versus WT. In (h-s) N=8 mice per group and *p < 0.05 versus WT and # p < 0.05 βCat(ex3)osb-vehicle versus DBZ-treated βCat(ex3)osb group. Results are mean ± SD and show a representative of two independent experiments.
Figure 3. Inactivation of Jagged-1 in osteoblasts prevents AML in βcat(ex3)osb mice.
Expression of a, Jagged-1 in bone, and b, Notch targets in LSK+ cells (n=4). Rescue of c, anemia, and proportions of d, myeloid and e, CD11b+/Gr1+ cells in the bone marrow of βCat(ex3)osb/Jagged1osb+/− mice. Normal f, blood histology and g, Survival of βcat(ex3)osb;Jagged1osb+/− mice. * p < 0.05 versus WT and # p < 0.05 βCat(ex3)osb versus βcat(ex3)osb;Jagged1osb+/− mice. N=8. Results show a representative of two independent experiments. Results are mean ± SD.
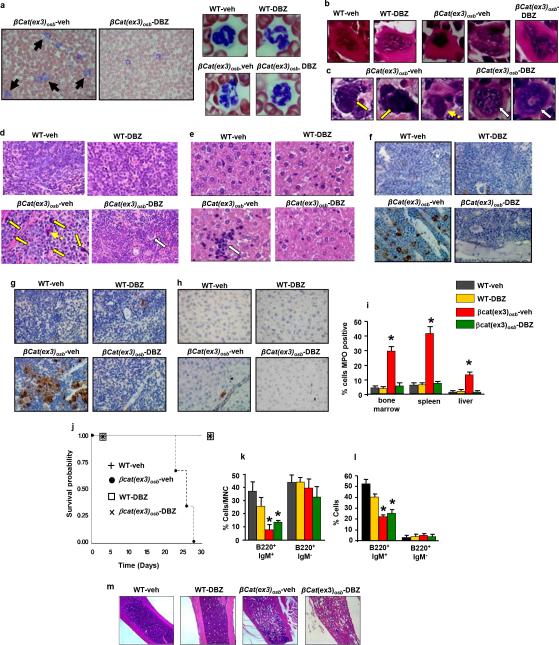
To determine if Jagged-1 in osteoblasts contributes to AML development in βcat(ex3)osb mice we removed one allele of Jagged-1 in osteoblasts (βcat(ex3)osb;Jagged1osb+/− mice). These genetic manipulation decreased Notch signaling is LSK cells, rescued anemia, and deregulation of HSC lineage differentiation and prevented AML development (Fig. 3d-f, Extended Data Fig. 6a-j). βcat(ex3)osb;Jagged1osb+/− mice survived and were healthy for the entire time they were observed, even though they remained osteopetrotic, (Fig.3g and Extended Data Fig. 6k). Similarly, pharmacological inhibition of Notch signaling with a γ-secretase inhibitor 18 reversed hematopoietic deregulation and myeloid expansion in blood, marrow and spleen and reversed AML in βcat(ex3)osb mice without affecting osteopetrosis (Extended Data Figs. 5h-s and 7), indicating that osteopetrosis is not enough to drive AML. These observations suggest that Notch signaling is required for AML development in βcat(ex3)osb mice and that chromosomal alterations may result from increased Notch signalling19. Alternatively, healthy HSCs in the endothelial and perivascular niche can multiply and outgrow leukemic HSCs in DBZ-treated βcat(ex3)osb mice. Jagged1 is required for leukemia induction; whether it is involved in leukemia maintenance with a therapeutic benefit, remains to be examined.
Extended Data Figure 6. Jagged-1 inactivation in osteoblasts prevents AML of βCat(ex3)osb mice.
a-d, Expression of Notch transcriptional targets in bone marrow LSK subpopulations. Rescue of changes in the proportions of e, LSK and f, erythroid cells in the bone marrow of βCat(ex3)osb/Jagged1osb+/− mice. g, Improvement of B-lymphopoiesis in βcat(ex3)osb;Jagged1osb+/− mice. Normal h, bone marrow, i, spleen and j, liver histology in βcat(ex3)osb;Jagged1osb+/− mice. k, Long bone sections. Images at 4X. In (a-d) N=4 and in (e-k) N-8 mice per group. *p < 0.05 versus WT and # p < 0.05 versus βcat(ex3)osb;Jagged1osb+/− mice. Results are mean ± SD and show a representative of three (a-d) and two (e-k) independent experiments.
Extended Data Figure 7. Inhibition of Notch signaling reverses AML in βCat(ex3)osb mice.
a, Lack of blasts (solid arrows) and, normal neutrophils (right panel) in blood of DBZ-treated βCat(ex3)osb mice. b-c, Normal megakaryocytes in b, the bone marrow and c, spleen and d, Normal spleen histology in DBZ-treated βCat(ex3)osb mice. Yellow arrows indicate abnormal cells with large nucleoli and dotted arrow indicates abnormal megakaryocytes in βCat(ex3)osb mice; white arrow indicates normal megakaryocytes in DBZ-treated βCat(ex3)osb mice. e, Lack of monocyte infiltration in the liver of DBZ-treated βCat(ex3)osb mice. Arrow indicates cluster of mononuclear cells. f-h, MPO staining of f, bone marrow g, spleen and h, liver. i, Percent of cells staining with MPO in the indicated tissues j, Increased survival in DBZ-treated βCat(ex3)osb mice. In a-b images taken at 100x magnification. In c-g images taken at 60X magnification. k-l, Proportion of B-cell populations in the k, bone marrow and l, spleen. m, Long bone sections. Images at 4X. N=6 mice per group. *p < 0.05 versus WT and # p < 0.05 βCat(ex3)osb-vehicle versus DBZ-treated βCat(ex3)osb group. Results are mean ± SD and show a representative from two independent experiments.
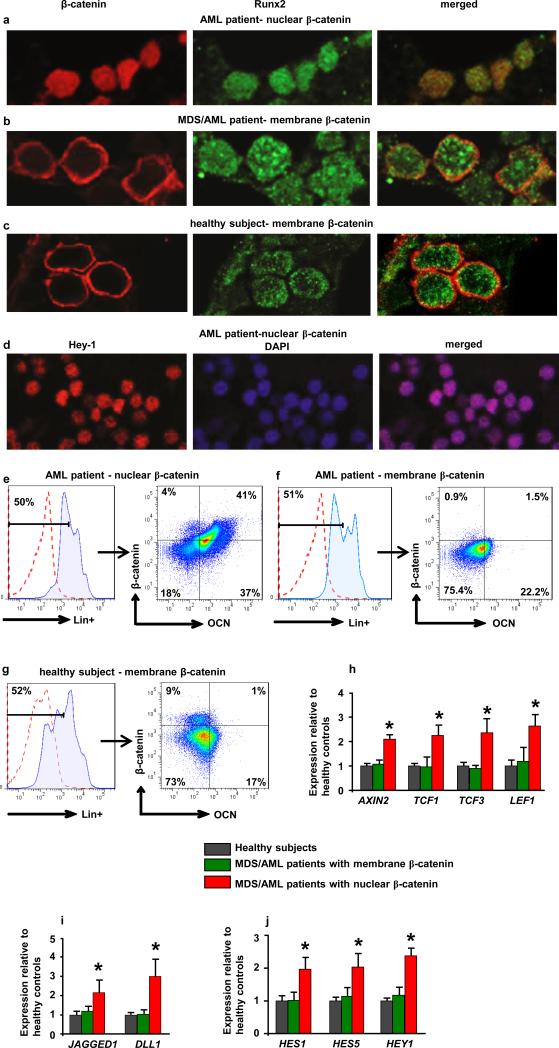
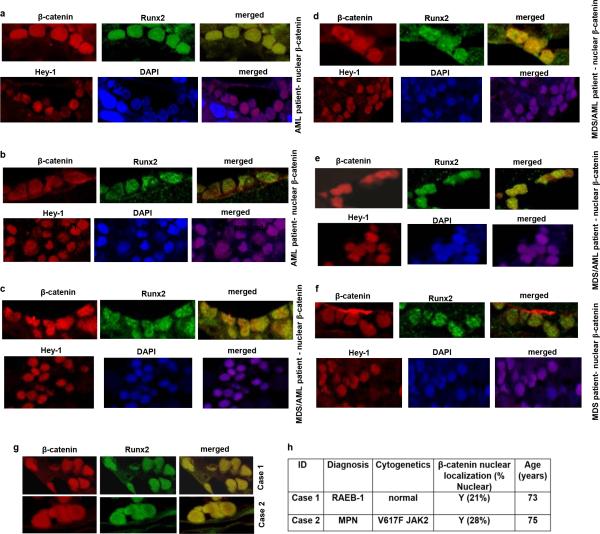
To assess the relevance of these findings to humans we examined activation of β-catenin signaling in bone marrow biopsies from MDS or AML patients. Forty-one out of 107 patients examined with all MDS subtypes, AML, or MDS that had transformed to AML (38.3%) showed nuclear localization of β-catenin in osteoblasts (Fig. 4a,b Extended Data Fig. 8a-h and 9h and Supplementary Table 1) but in none of the 56 healthy controls examined (Fig. 4c and Extended Data Fig. 9a-g,i,j). Myeloid and erythroid cells and megakaryocytes in all patients and healthy controls subjects showed membrane staining for β-catenin. Notch signaling was specifically activated only in patients with nuclear accumulation of β-catenin as indicated by Hey-1 nuclear staining in their hematopoietic cells (Fig. 4d and Extended Data Fig. 8a-f). Expression of all examined β-catenin target genes and JAGGED-1 and DLL-1 was upregulated over 2-fold in osteoblasts from MDS/AML patients with β-catenin nuclear accumulation in osteoblasts (Fig. 4h, i) but not in healthy controls. Notch activity was increased in hematopoietic cells from the same patients, but not healthy controls, as indicated by 2-fold increase in the expression of Notch transcriptional targets (Fig. 4j). It is possible that, aberrant β-catenin signalling in osteoblasts of these patients may be the consequence of hematopoietic clones remodelling the microenvironment as recently reported20. During screening assumed healthy controls, 2 individuals had nuclear β-catenin in osteoblasts. Re-evaluation showed that one patient developed MDS and the second an underlying MPN/MDS, a pre-AML condition with features of both a myeloproliferative neoplasm (MPN) and MDS (Extended Data Fig. 8g, h) suggesting a potential prognostic value.
Figure 4. Nuclear accumulation of β-catenin in osteoblasts and increased Notch signaling in human MDS/AML.
a-c, Double immunofluorecsence staining for β-catenin and Runx2 in bone marrow biopsies from a-b, MDS/AML patients and c, healthy subjects (60X). d, Nuclear accumulation of Hey-1 in patient shown in (a). e-g, Flow cytometry detecting nuclear/activated β-catenin. Plots show e, nuclear versus f, non-nuclear localization of β -catenin in osteoblasts from MDS/AML patients or g, healthy subjects as CD34-/Lin-OCN+ cells, (OCN: osteocalcin). In a-g, one representative from 107 patients and one representative from 56 healthy subjects. Increased expression of h, β-catenin targets and i, JAGGED-1 and DLL-1 in CD34−/Lin−OCN+ osteoblasts and j, Notch targets in CD34+/Lin+OCN− hematopoietic cells from MDS/AML patients or healthy subjects. p<0.05 versus patients with non-nuclear β-catenin in osteoblasts and healthy subjects. Results are mean ± SD. Results show a representative of two independent experiments with N= 3 for healthy subjects, 12 for MDS/AML patients with membrane localization of β-catenin and 11 for MDS/AML patients with nuclear β-catenin.
Extended Data Figure 8. Nuclear accumulation of β-catenin in osteoblasts and increased Notch signaling in 38.3 % of patients with MDS/AML; and identification of underlying pre-AML conditions by nuclear localization of β-catenin in osteoblasts.
a-f, Double immunofluorecsence staining with β-catenin and Runx2 in osteoblasts from bone marrow biopsies from 6 MDS/AML patients harboring nuclear accumulation of β-catenin in osteoblasts and showing nuclear accumulation of Hey1 in the corresponding patients (60X). g-h, During screening assumed healthy controls, 2 individuals were identified with nuclear β-catenin in their osteoblasts. Re-evaluation showed underlying hematologic disorder, Case 1: MDS RAEB-1, Case 2: Jak2 positive myelofibrosis. g, Double immunofluorecsence staining with β-catenin and Runx2 in osteoblasts from bone marrow biopsies of the 2 cases (60X). h, β-catenin cellular localization in cases 1 and 2 with associated cytogenetic abnormalities. NL: normal cytogenetics. In the 4th column percentages indicate osteoblasts with nuclear localization of β-catenin.
Extended Data Figure 9. Membrane accumulation of β-catenin in osteoblasts in 61.7 % of patients with MDS/AML and in healthy subjects and Nuclear accumulation of β-catenin in osteoblasts in 38.3 % of patients with MDS/AML identified by flow cytometry.
Double immunofluorecsence staining with β-catenin and Runx2 in osteoblasts from bone marrow biopsies from a-c, 3 MDS/AML patients and d-g, 4 healthy subjects harboring membrane localization of β-catenin in osteoblasts. h-j, Flow cytometry using a non-phospho β-catenin antibody detecting nuclear/activated β-catenin. Representative plots showing h, nuclear versus i, non-nuclear localization of β -catenin in osteoblasts from individual MDS/AML patients and, non-nuclear localization of β-catenin in osteoblasts from 5 healthy subjects as CD34−/Lin−OCN+ cells, (OCN, osteocalcin an osteoblast-specific protein used for isolation of live osteoblastic cells).
Notch activation promotes expansion of myeloid cells 21 and AMKL-like disease in mice 22. Other studies show that the Notch pathway may act as tumor suppressor in AML 23-25 . However, in these models, LICs are found in GMPs whereas in our model LICs are in LT-HSCs suggesting that different LICs can have distinct consequences. Additionally, increased Jagged-1 expression may not elicit identical outcomes as increased Notch signaling by all Notch receptors 26-28 and βcat(ex3)osb osteoblasts may stimulate additional signals that act in combination with Notch to induce mutations contributing to AML. Notch also has a role in T-ALL pathogenesis 29. but T-cell specific cooperative signals seem to be required to induce transformation 30.
The notion that osteolineage cells can induce myeloid malignancies was previously introduced10. Our observations that osteoblasts determine the appearance of cell-autonomous AML with 100 % penetrance and the molecular and genetic dissection of how this occurs in mice and humans demonstrate the role of the marrow niche as a determinant of hematological disorders. They may also be informative about MDS/AML pathogenesis in humans and expand the potential of new therapeutic applications.
Methods Summary
Mice
Generation of α1(I)Collagen-Cre [α1(I)Col-Cre], Catnb+/lox(ex3), βcat(ex3)osb and Jagged-1fl/fl mice has previously been reported. All the protocols and experiments were conducted according to the guidelines of the Institute of Comparative Medicine, Columbia University.
Patient samples
Bone marrow biopsies from patients with AML and MDS were consecutively obtained from 2000-2008 and reviewed under a research exempt waiver approved by the institutional review boards (IRB) of Memorial Sloan Kettering Hospital and Columbia University and Human Biospecimen Utilization Committee.
More details in Full Methods in Supplementary Information.
Methods
Animals
Generation of α1(I)Collagen-Cre [α1(I)Col-Cre], and Catnb+/lox(ex3) mice has previously been reported 31-33. Catnb+/lox(ex3) mice, express a β-catenin mutant allele in which exon 3, encoding all serine and threonine residues phosphorylated by glycogen synthase kinase 3β(GSK-3β) (Logan and Nusse, 2004), is flanked by loxP sites. Mice with osteoblast-specific constitute activation of β-catenin were generated by crossing Catnb+/lox(ex3) mice with α1(I)Col-Cre mice expressing Cre under the control of 2.3 kb of the proximal promoter of the mouse pro- α1(I)Collagen gene. The transgene is expressed at high levels in osteoblasts specifically 34. There is no expression in chondrocytes, condensed mesenchymal cells, perichondrial or periosteal fibroblasts, or any other type I collagen-producing cells, or other fibroblast-rich tissues such as muscle, heart or tendons. The resulting offspring, termed βcat(ex3)osb, express a constitutive active β-catenin allele in osteoblasts. Mice with osteoblast-specific deletion of Jagged-1 were generated by crossing previously described Jagged1fl/fl mice 35 with α1(I)Col-Cre mice. Genotyping was performed at weaning stage by PCR analysis of genomic DNA. In each experiment the mice used were of the same genetic background as they were all littermates. Female mice at 1 month of age were used for the bone histomorphometric analysis. βcat(ex3)osb mice lack teeth due to osteopetrosis and therefore were fed a normal powdered diet that contained all the required nutrients (20% protein, 3.0 ppm Folic Acid, 51 mcg/kg B12 from PicoLab Rodent Diet 20, Cat. Nu. 5053). Folate and B12 levels in their blood were normal (folate > 24 ng/ml and B12 > 1,000 pg/ml) confirming adequate intake of critical nutrients. Folate and B12 levels were measured by Antech Diagnostics using a chemiluminescence-based kit (Siemens). All the protocols and experiments were conducted according to the guidelines of the Institute of Comparative Medicine, Columbia University.
Patient samples
Bone marrow biopsies from patients with AML and MDS were consecutively obtained from 2000-2008 and reviewed under a research exempt waiver approved by the institutional review board (IRB) of Memorial Sloan Kettering Hospital and Human Biospecimen Utilization Committee. Bone marrow biopsies and aspirates obtained from Columbia University from patients with MDS and AML were stored in IRB-approved Tissue Repository at Columbia University Medical Center after informed consent. This study was conducted under protocol approval from the IRB for use of samples from the Tissue Repository.
Karyotype analysis
Metaphase chromosome preparations were prepared from cells obtained from spleen specimens from βcat(ex3)osb mice after overnight culture in complete RPMI medium using standard methods. Giemsa banding was performed and the images were captured using Cytovision Imaging system (Applied Imaging, Santa Clara, CA) attached to a Nikon Ecliplse 600 microscope. Twenty to 30 karyotypes were prepared from each sample and described using the standard chromosome nomenclature for mice.
Array comparative genomic hybridization (aCGH)
aCGH analysis was performed in the spleen of βcat(ex3)osb mice using the Mouse genome CGH 244A Platform (Agilent Technologies) according to the manufacturer's instructions. In brief, spleen DNA from wild type littermates was used as reference DNA. Genomic DNA was subjected to restriction digestion prior to labeling and purification (SureTag DNA labeling kit, Agilent Technologies). For each 244 K array, 2 μg of labeled DNA and 2 μg of germline reference DNA were labelled with Cy5 and Cy3, respectively. Differentially labeled test (tumor) DNA and normal reference DNA were hybridized simultaneously to normal chromosome spreads. Data extraction was conducted using the Agilent feature extraction software. Data files were analyzed using the Agilent DNA analytics software. Data were deposited in Gene Expression Omnibus (Accession Number GSE51690)
Whole-exome capture and massively parallel sequencing, sequence mapping and identification of tumor-specific variants
For three tumor and three unpaired normal samples, purified genomic DNA (3 μg) was enriched in protein-coding sequences using the SureSelect Mouse All Exon kit (Agilent Technologies) following standard protocols. The resulting target-enriched pool was amplified and subjected to paired-end sequencing (2×100 bp) by using HiSeq2000 sequencing instruments. Exome capture and sequencing procedures were performed at Agilent Technologies. Sequencing reads were mapped to the reference genome mm10 using the Burrows-Wheeler Aligner (BWA) alignment tool version 0.5.9 36. We identified sites that differed from the reference genome (called here variants) and constructed empirical priors for the distribution of variant frequencies in each sample independently. We obtained high-credibility intervals (posterior probability ≥1–10−5) for the observed frequency of the variants using the SAVI (Statistical Algorithm for Variant Identification) algorithm 37.
Variants were considered absent if found with a frequency between 0 and 2%, and were considered present if detected with a frequency above 15%. We chose 15% as a cut-off given its correspondence with the sensitivity threshold of direct Sanger sequencing. Variant total depth was required to be >10× and <300×. Segmenting variants that exist in one case only and absent in the other five cases identified regions of possible copy number aberrations. We removed the variants found in these regions. We also excluded all silent variants and those present in dbSNP database, and focused only on substitution mutations. Finally, in the tumor samples, we removed all variants found present in any of the normal samples.
The mutations were subjected to validation (present in tumor, absent in normal) by conventional Sanger-based re-sequencing analysis of PCR products obtained from tumor DNA using primers specific for the exon encompassing the variant. Data were deposited in Short Read Archive (Accession Number SRP031981).
Microarray
Total RNA was extracted from primary osteoblasts isolated from mouse calvaria using Trizol reagent (Invitrogen). Microarray analysis was performed using the GeneChip 3’ IVT Express kit and mouse genome 430 2.0 array gene chips (Affymetrix) according to the manufacturer's instructions. In brief aRNA was synthesized from 500 ng of RNA and was biotinylated followed by purification and fragmentation using the GeneChip 3’ IVT Express kit. Fragmented aRNA was hybridized to Affymetrix mouse genome 430 2.0 array gene chips. Following hybridization chips were scanned with a Genechip Scanner 3000 7G (Affymetrix). Data were normalized using the Mas5 method 38, and then log2 transformed. Data were deposited in Gene Expression Omnibus (Accession Number GSE43242) 39, Differential expression was analyzed using the LIMMA 40. We focused on about 20 genes which we selected in advance of the analysis. Genes were considered which either are active in AML, are amplified according to our CGH results, activate Notch, or whose transcription is induced by Notch. A significance cutoff of a raw p <0.05 was used, as is appropriate for small previously-determined genesets 41. Representative probesets of genes whose expression changed greater than ± 20% in at least one of the 2 mutants relative to WT appear in Supplementary Table 1.
Bone marrow transplantation
For bone marrow transplantation studies, adult, wild type B5.SJL (CD45.1) recipient mice (8 weeks of age) were lethally irradiated (10Gy, split dose) and were then transplanted with 1×10⁵ of total bone marrow cells from βcat(ex3)osb (CD45.2) or wild type B5.SJL (CD45.2) mice (4 weeks of age) by retro-orbital venous plexus injection. Engraftment efficiency in recipients was monitored by donor contribution of CD45.2+ cells using FACS analysis. For reverse experiment, because of the early lethality of βcat(ex3)osb mice,1×105 of total bone marrow cells from wild type B6.SJL (CD45.1) mice were transplanted into lethally irradiated (600 rads, split dose) newborn (P1) βcat(ex3)osb mice or wild type littermates by liver injections. Engraftment efficiency in recipients was monitored by donor contribution of CD45.1+ cells using FACS analysis. For HSC and progenitor transplantation studies, sublethally (5.5 Gy) irradiated wild type B5.SJL (CD45.1) recipient mice (8 weeks of age) were injected with fractionated donor bone marrow subsets isolated from βcat(ex3)osb (CD45.2) or wild type B5.SJL (CD45.2) mice (4 weeks of age). Engraftment efficiency in recipients was monitored by donor contribution of CD45.2+ cells using FACS analysis.
Treatment of animals with γ-secretase inhibitor
Two-week old βcat(ex3)osb mice or the wild type littermates were treated with vehicle, the γ-secretase inhibitor DBZ ((2S)-2-[2-(3,5-difluorophenyl)-acetylamino]-N-(5-methyl-6-oxo-6,7-dihydro-5H-dibenzo[b,-d]azepin-7-yl)-propionamide, 2 μmol/kg) daily by intraperitoneal injection for 10 days. DBZ is cell-permeable, selective, nontransition sate and noncompetitive inhibitor of the γ-secretase complex. DBZ was synthesized to >99.9% purity as assessed by LC/MS (Syncom) and suspended in a 0.5% Methocel E4M (wt/vol, Colorcon) and 0.1% (vol/vol) Tween-80 (Sigma) solution 42. Immediately before intraperitoneal injection, DBZ was sonicated for 2 minutes to achieve a homogenous suspension.
Hematological measurements and peripheral blood morphology
For hematological measurements, blood was collected by cardiac puncture. Peripheral blood cell counts were performed on a FORCYTE Hematology Analyzer (Oxford Science Inc.). For morphological assessment, peripheral blood smears were stained with Wright-Giemsa stain (Sigma-Aldrich) for 10 minutes followed by rinsing in dH2O for 3 minutes. Images were taken using a 60x objective on a Leica microscope outfitted with camera.
Real-time PCR
Total RNA was isolated from LSK or hematopoietic cells using RNAeasy micro Plus kit (Quiagen). Total RNA from bone marrow-free long bones was isolated using TRIzol reagent after removal of the periosteal layer. Quantitative real-time PCR was performed using the SYBR Green Master Mix (Bio-Rad) as previously described 33. β-Actin was used as endogenous control. Gene expression in LT-HSCs, ST-HSCs and MPPs was performed using the Power Syber Green Cells-to –CT kit (Ambion Life Technologies)
Reporter constructs and luciferase assays
The Jagged-1 promoter region carries multiple potential TCF/LEF binding sites (C/TCTTTG) located up to nucleotide −4075 (4075, −3072, −2626, −2578, −2343, −1992, 1957, −1566, −1221, −782). The mouse reporter constructs −4112/+130 and −2100/+130 for Jagged-1-luc were generated by PCR amplification of the corresponding fragments using mouse genomic DNA as template and subsequent subcloning into the BglII and KpnI-BglII sites of the pGL3Basic vector (Promega), respectively. Transient transfection assays were performed in HEK293T using Lipofectamine 2000 (Invitrogen) according to the manufacturer's instructions. Cells were seeded in 24 well plates at a density of 0.3×10⁵ cells/well. 24h later, cells were transfected with a total amount of 350ng of DNA containing 150ng reporter plasmid and 50 ng β-catenin and TCF-1 expression vectors. 5ng of pRL-CMV Renilla (Promega) was used as an internal control to normalize for transfection efficiency and equivalent amounts of DNA were achieved with pcDNA3 vector. Forty hours after transfection luciferase activity was determined using the Dual Luciferase Reporter Assay System (Promega) and quantified using Fluostar Omega (BMG Labtech Inc). Luciferase activity is presented as fold induction over basal conditions normalized to empty luciferase vector for identical experimental conditions.
Chromatin Immunoprecipitation (ChiP) assay
Primary osteoblasts were seeded in 10 cm dishes at a density of 5 ×10⁶. Cells were cross-linked with 1% formaldehyde for 10 min. Following Dounce homogenization, nuclei were collected and sonicated on ice to an average length of 0.5 kb. The samples were centrifuged and precleared with protein G in the presence of sonicated λDNA and bovine serum albumin for 2 h at 4 °C. One-tenth of the volume of supernatant was used as input, and the remaining volume was immunoprecipitated with β-catenin antibody and the immune complexes were collected by absorption to protein G-sepharose, washed, eluted from the beads and incubated for 5 h at 65 °C to reverse cross-links. After treatment with proteinase K, DNA was extracted with phenol-chloroform and precipitated with ethanol. Immunoprecipitated chromatin was analyzed by PCR using primers corresponding to TCF/LEF binding sites on the Jagged-1 promoter (−4075, −3072, −2626, −2578, −2343, −1992, −1957, −1566, −1221, −782). Putative binding elements were identified by using the TRANSFAC database. The products of the PCR amplifications were analyzed by agarose gel electrophoresis.
Antibodies and Flow Cytometry analysis
Freshly isolated bone marrow cells and spleen cells were resuspended in flow-staining buffer (PBS plus 2% FBS) and the primary conjugated antibodies were added. After 30 minutes incubation at 4°C, the cells were then washed twice before flow cytometry analysis. The following monoclonal antibodies conjugated with fluorescein isothiocyanate (FITC) , Allophycocyanin (APC) phycoerythrin (PE) , PE-Cy7, APC-CY7, Per-CPCY5.5, Pacific Blue, and Alexa 700 were used: CD117 (c-kit; 2B8), Sca-1 (D7), Mac-1α (M1/70), Gr-1(RB6-8C5), TER-119, (Ly-76) B220 (CD45R), CD19 (1D3), IgM (R6-60.2), CD3 (17A2), CD4 (RM4-5), CD8a (53-6.7), CD34 (RAM34), CD45 (30-F11), CD31 (MEC 13.3), CD16/CD32 (FcγRII/III; 2.4G2), CD135 (A2F10.1), CD150 (9D1), CD71 (C2), CD45.2 (104), CD45.1 (A20), F4/80. Non-phospho (Active) β-Catenin (S33/S37/T41) antibody, IL-7Rα (SB199), Jagged-1 (C-20) (Cell Signaling; D13A1). Seven-color flow cytometry acquisition was performed using a LSR II flow cytometer (Becton Dickinson) and analysis using FLO-JO software (Treestar, Inc). Cells were gated for size, shape and granularity using forward and side scatter parameters. The positive populations were identified as cells that expressed specific levels of fluorescence activity above the nonspecific auto fluorescence of the isotype control. Nonspecific binding was reduced by preincubation with unconjugated anti-FcRII/III (2.4G2). Osteoblasts from MDS/AML patients or healthy subjects were idemtified as CD34-/Lin-OCN+ cells, (OCN: osteocalcin an osteoblast-specific protein used for isolation of live osteoblastic cells). For Flow sorting bone marrow, spleen and thymus cells were resuspended in flow staining buffer at 1 × 10⁶/ml and labeled with the appropriate conjugated antibodies. After 30 minutes incubation, cells were washed twice using flow buffer. Flow sorting was performed using FACSAria (Becton Dickinson). Sorted populations were subsequently cultured or stored in RLT buffer at −80 °C for later extraction of RNA. Fluorescence intensity plots were presented in log scale. All flow cytometry data are representative of five independent experiments.
Clonogenic Assay
Bone marrow cells from 4-week old βcat(ex3)osb or wild type mice were cultured in DMEMα with 10% FBS in the presence of 10 ng/ml of GM-CSF or M-CSF or G-CSF for 7 days. An aliquot of the cells was used to prepare Cytospins and stained with Giemsa to identify blasts. A second aliquot was analyzed by flow cytometry for expression of F4/80, CD11b and Gr1.
Isolation and counting of osteoblasts from murine and human bone
The periosteal layer was removed from murine tibia and femurs, the remaining bone was crushed and washed to remove the bone marrow and bone pieces were digested with Collagenase type III. Osteopetrosis in βcat(ex3)osb mice does not allow the use of only endosteal bone due to dispersion in the marrow space of irregular trabecular units. Human bone biopsies were dissected into pieces and fat and clot was removed from bone chips and a 3 mm section was transferred into 500 μl αMEM with 1% Pen/Strep. Scissors were used to cut the bone chip into a slurry and then the slurry was digested in 500uL FBS-free αMEM (1% Pen/Strep) and 4mg/mL Collagenase type III (Worthington) for final concentration of 2mg/ml. After incubation for 1 hour with intermittent vortexing, slurry was frozen live for later use in 90% FBS with 10% DMSO. For flow cytometry analysis, osteoblasts were identified from the digested bone samples as a population of CD34−Lin−Ocn+ cells, where OCN (osteocalcin) is an osteoblast-specific, non-nuclear protein commonly used for isolation of live osteoblastic cells 43-45. For microarray analysis and for experiments in mice, all gene expression studies were repeated using calvaria-derived cells a population rich in committed osteoblast progenitors and routinely used as osteoblast-representative. Primary murine osteoblasts were prepared from calvaria of 2 day-old pups as previously described 46, 47. Mice calvaria were sequentially digested for 20, 40, and 90 min at 37°C in a modified minimal essential medium (GIBCO)–10% FBS containing 0.1 mg of collagenase P (Worthington) per ml and 0.25% trypsin (Gibco). Cells of the first two digests were discarded, whereas cells released from the third digestion were plated in a minimal essential medium–10% FBS.
Osteoblasts were counted in each human bone biopsy as defined by standard histomorphometry guidelines 48-50. The number of osteoblasts per mm of bone surface is calculated. The number of osteoblasts counted depends on the size of the sample and the bio-/pathophysiological characteristics of the individual and for this study, the size of the biopsy (1cm) allowed for counting of 30 osteoblasts per biopsy.
Histological analysis of human biopsies and murine bone, spleen and liver
Bone marrow biopsies were fixed overnight in 10% neutral formalin solution, decalcified embedded in paraffin and sectioned at 5 μm per standard laboratory protocol. Sections were stained for β-catenin using a monoclonal antibody (1:1000, BD Transduction Lab) or for Runx2 using a polyclonal antibody (1:100 dilution, Santa Cruz) or for Hey1 using a polyclonal antibody (1:300 dilution, Abcam) on an automated Ventana Discovery XT (Tuscon, AZ) platform according to manufacturer's instructions. Immune complexes formed were developed using a DAB Map Kit (Ventana, Tuscon, AZ). Murine long bones, spleen and liver were collected from one month old mice, fixed overnight in 10% neutral formalin solution, embedded in paraffin, sectioned at 5 μm, and stained with haematoxylin and eosin (H&E). For immunohistochemistry, specimens were incubated with CD-117 (C-kit; Abcam), CD13 (Santa Cruz) or Myeloperoxidase (MPO) antibodies after an antigen retrieval step and blocking of endogenous peroxidase with 3% H2O2. Sections were then incubated with biotinylated secondary antibody and immune complexes formed were detected using standard Avidin Biotin complex method.
Statistical analysis
All data are represented as mean ± standard deviation. Statistical analyses were performed using a one-way ANOVA followed by Student-Newman-Keuls test and a p value less than 0.05 was considered significant. Time-to-event analysis was used to assess medium survival time to death. Kaplan-Meier curves were generated to illustrate time to death, stratified by group status. Statistical significance of the between-group difference in the median time-to-endpoint was assessed by the log-rank test. Statistical analyses were performed using XLSTAT (2012.6.02, Addinsoft) and SAS (version 9.2; SAS institute, Inc, Cary North Carolina). A p value less than 0.05 was considered statistically significant.
Supplementary Material
Supplementary Table 1. Nuclear accumulation of β-catenin in osteoblasts of 38.29% MDS/AML patients. β-catenin cellular localization in patients with MDS, AML, and AML arising from prior MDS with associated cytogenetic abnormalities. NL: normal cytogenetics; NE: cytogenetics non-evaluable; ND: cytogenetics not determined. Percentages in parentheses in the 4th column indicate percentages of osteoblasts with nuclear localization of β-catenin; Y denotes nuclear localization of β-catenin in osteoblasts and N denotes membrane localization of β -catenin in osteoblasts. In the latter samples nuclear localization of β-catenin was not detected in any of the osteoblasts.
Acknowledgements
The authors are grateful to Dr. Makoto Taketo for providing the Catnb+/lox(ex3) mice, Drs. Riccardo Dalla-Favera and Gerard Karsenty for helpful discussions and critical reading of the manuscript, Dr. Marcel Van Den Brink for providing funding support, Don McMahon and Chiyuan A. Zhang for help with statistical analysis and Jayesh Sha, Foxwell N. Emmons, Irina Linkov and Janine Pichard for technical assistance. The histology and metabolic unit facility of the Diabetes and Endocrinology Research Center (DERC, NIDDK DK063608-07)), the Molecular Pathology facility of the Herbert Irving Cancer Center of Columbia University Medical Center for help with histological analysis and Drs Wendy Fantl and Gary Nolan for providing flow cytometry conditions for the Nuclear β-catenin antibody. This work was supported by the National Institutes of Health (R01 AR054447, and P01 AG032959 and R01 AR055931 to SK) and by the Division of Hematologic Oncology, Memorial Sloan Kettering Cancer Center, New York (to EB).
Footnotes
Author contributions
A.K. and S.K initiated the study and designed the experiments. A.K., J.S.M. and S.K analyzed the data. A.K. carried out most of the experimental work with the help of S.J.M, I.M and N.L. S.J.M performed the flow cytometry analysis. H.K., A.L. and R.R. performed whole-exome sequencing analysis. I.M. confirmed exome mutations. N.L. performed ICC and IFC. C.V.R. reviewed and discussed hematopoiesis data and bone marrow transplantations. G.B, D.P, and J.T.-F. performed histology in mouse samples. J.T.-F. and D.P. performed histology in human samples. A.R, S.M., N.G., J.T.-F. and E.B. provided human AML and MDS samples and reviewed and discussed human bone marrow and bone biopsy data. M.V. performed G-banding karyotype analysis. R.F. analyzed microarray data. A.K. and S.K. wrote the manuscript. S.K. directed the research. All authors discussed and commented on the manuscript.
Author information
Microarray and aCGH data were deposited in Gene Expression Omnibus (Accession Numbers GSE43242, GSE51690) and exome sequencing data were deposited in Short Read Archive (Accession Number SRP031981). The authors declare no competing financial interests.
Supplementary Information
Supplementary Information includes 1 Table
References
- 1.Heissig B, et al. Recruitment of stem and progenitor cells from the bone marrow niche requires MMP-9 mediated release of kit-ligand. Cell. 2002;109:625–637. doi: 10.1016/s0092-8674(02)00754-7. [DOI] [PMC free article] [PubMed] [Google Scholar]
- 2.Shiozawa Y, et al. Human prostate cancer metastases target the hematopoietic stem cell niche to establish footholds in mouse bone marrow. J Clin. Invest. 2011;121:1298–1312. doi: 10.1172/JCI43414. [DOI] [PMC free article] [PubMed] [Google Scholar]
- 3.Calvi LM, et al. Osteoblastic cells regulate the haematopoietic stem cell niche. Nature. 2003;425:841–846. doi: 10.1038/nature02040. [DOI] [PubMed] [Google Scholar]
- 4.Zhang J, et al. Identification of the haematopoietic stem cell niche and control of the niche size. Nature. 2003;425:836–841. doi: 10.1038/nature02041. [DOI] [PubMed] [Google Scholar]
- 5.Mayack SR, Wagers AJ. Osteolineage niche cells initiate hematopoietic stem cell mobilization. Blood. 2008;112:519–531. doi: 10.1182/blood-2008-01-133710. [DOI] [PMC free article] [PubMed] [Google Scholar] [Retracted]
- 6.Wu JY, et al. Osteoblastic regulation of B lymphopoiesis is mediated by Gs{alpha}-dependent signaling pathways. Proc. Natl. Acad. Sci. U. S. A. 2008;105:16976–16981. doi: 10.1073/pnas.0802898105. [DOI] [PMC free article] [PubMed] [Google Scholar]
- 7.Zhu J, et al. Osteoblasts support B-lymphocyte commitment and differentiation from hematopoietic stem cells. Blood. 2007;109:3706–3712. doi: 10.1182/blood-2006-08-041384. [DOI] [PubMed] [Google Scholar]
- 8.Chan CK, et al. Endochondral ossification is required for haematopoietic stem-cell niche formation. Nature. 2009;457:490–494. doi: 10.1038/nature07547. [DOI] [PMC free article] [PubMed] [Google Scholar]
- 9.Walkley CR, et al. A microenvironment-induced myeloproliferative syndrome caused by retinoic acid receptor gamma deficiency. Cell. 2007;129:1097–1110. doi: 10.1016/j.cell.2007.05.014. [DOI] [PMC free article] [PubMed] [Google Scholar]
- 10.Raaijmakers MH, et al. Bone progenitor dysfunction induces myelodysplasia and secondary leukaemia. Nature. 2010;464:852–857. doi: 10.1038/nature08851. [DOI] [PMC free article] [PubMed] [Google Scholar]
- 11.Glass DA, et al. Canonical wnt signaling in differentiated osteoblasts controls osteoclast differentiation. Dev. Cell. 2005;8:751–764. doi: 10.1016/j.devcel.2005.02.017. [DOI] [PubMed] [Google Scholar]
- 12.Kogan SC, et al. Bethesda proposals for classification of nonlymphoid hematopoietic neoplasms in mice. Blood. 2002;100:238–245. doi: 10.1182/blood.v100.1.238. [DOI] [PubMed] [Google Scholar]
- 13.Sternberg A, et al. Evidence for reduced B-cell progenitors in early (low-risk) myelodysplastic syndrome. Blood. 2005;106:2982–2991. doi: 10.1182/blood-2005-04-1543. [DOI] [PubMed] [Google Scholar]
- 14.Van de Loosdrecht AA, et al. Identification of distinct prognostic subgroups in low- and intermediate-1-risk myelodysplastic syndromes by flow cytometry. Blood. 2008;111:1067–1077. doi: 10.1182/blood-2007-07-098764. [DOI] [PubMed] [Google Scholar]
- 15.Raza A, Galili N. The genetic basis of phenotypic heterogeneity in myelodysplastic syndromes. Nat. Rev Cancer. 2012;12:849–859. doi: 10.1038/nrc3321. [DOI] [PubMed] [Google Scholar]
- 16.Genomic and epigenomic landscapes of adult de novo acute myeloid leukemia. N. Engl. J Med. 2013;368:2059–2074. doi: 10.1056/NEJMoa1301689. [DOI] [PMC free article] [PubMed] [Google Scholar]
- 17.Estrach S, Ambler CA, Lo CC, Hozumi K, Watt FM. Jagged 1 is a beta-catenin target gene required for ectopic hair follicle formation in adult epidermis. Development. 2006;133:4427–4438. doi: 10.1242/dev.02644. [DOI] [PubMed] [Google Scholar]
- 18.Real PJ, et al. Gamma-secretase inhibitors reverse glucocorticoid resistance in T cell acute lymphoblastic leukemia. Nat. Med. 2009;15:50–58. doi: 10.1038/nm.1900. [DOI] [PMC free article] [PubMed] [Google Scholar]
- 19.Baia GS, et al. Notch activation is associated with tetraploidy and enhanced chromosomal instability in meningiomas. Neoplasia. 2008;10:604–612. doi: 10.1593/neo.08356. [DOI] [PMC free article] [PubMed] [Google Scholar]
- 20.Schepers K, et al. Myeloproliferative neoplasia remodels the endosteal bone marrow niche into a self-reinforcing leukemic niche. Cell Stem Cell. 2013;13:285–299. doi: 10.1016/j.stem.2013.06.009. [DOI] [PMC free article] [PubMed] [Google Scholar]
- 21.Delaney C, et al. Notch-mediated expansion of human cord blood progenitor cells capable of rapid myeloid reconstitution. Nat. Med. 2010;16:232–236. doi: 10.1038/nm.2080. [DOI] [PMC free article] [PubMed] [Google Scholar]
- 22.Mercher T, et al. The OTT-MAL fusion oncogene activates RBPJ-mediated transcription and induces acute megakaryoblastic leukemia in a knockin mouse model. J Clin. Invest. 2009;119:852–864. doi: 10.1172/JCI35901. [DOI] [PMC free article] [PubMed] [Google Scholar]
- 23.Lobry C, et al. Notch pathway activation targets AML-initiating cell homeostasis and differentiation. J Exp. Med. 2013;210:301–319. doi: 10.1084/jem.20121484. [DOI] [PMC free article] [PubMed] [Google Scholar]
- 24.Klinakis A, et al. A novel tumour-suppressor function for the Notch pathway in myeloid leukaemia. Nature. 2011;473:230–233. doi: 10.1038/nature09999. [DOI] [PMC free article] [PubMed] [Google Scholar]
- 25.Kannan S, et al. Notch activation inhibits AML growth and survival: a potential therapeutic approach. J Exp. Med. 2013;210:321–337. doi: 10.1084/jem.20121527. [DOI] [PMC free article] [PubMed] [Google Scholar]
- 26.Krebs LT, et al. Notch signaling is essential for vascular morphogenesis in mice. Genes Dev. 2000;14:1343–1352. [PMC free article] [PubMed] [Google Scholar]
- 27.Kumano K, et al. Notch1 but not Notch2 is essential for generating hematopoietic stem cells from endothelial cells. Immunity. 2003;18:699–711. doi: 10.1016/s1074-7613(03)00117-1. [DOI] [PubMed] [Google Scholar]
- 28.Mancini SJ, et al. Jagged1-dependent Notch signaling is dispensable for hematopoietic stem cell self-renewal and differentiation. Blood. 2005;105:2340–2342. doi: 10.1182/blood-2004-08-3207. [DOI] [PubMed] [Google Scholar]
- 29.Lobry C, Oh P, Aifantis I. Oncogenic and tumor suppressor functions of Notch in cancer: it's NOTCH what you think. J Exp. Med. 2011;208:1931–1935. doi: 10.1084/jem.20111855. [DOI] [PMC free article] [PubMed] [Google Scholar]
- 30.Grabher C, von BH, Look AT. Notch 1 activation in the molecular pathogenesis of T-cell acute lymphoblastic leukaemia. Nat. Rev Cancer. 2006;6:347–359. doi: 10.1038/nrc1880. [DOI] [PubMed] [Google Scholar]
- 31.Dacquin R, Starbuck M, Schinke T, Karsenty G. Mouse alpha1(I)-collagen promoter is the best known promoter to drive efficient Cre recombinase expression in osteoblast. Dev. Dyn. 2002;224:245–251. doi: 10.1002/dvdy.10100. [DOI] [PubMed] [Google Scholar]
- 32.Harada N, et al. Intestinal polyposis in mice with a dominant stable mutation of the beta-catenin gene. EMBO J. 1999;18:5931–5942. doi: 10.1093/emboj/18.21.5931. [DOI] [PMC free article] [PubMed] [Google Scholar]
- 33.Rached MT, et al. FoxO1 expression in osteoblasts regulates glucose homeostasis through regulation of osteocalcin in mice. J. Clin. Invest. 2010;120:357–368. doi: 10.1172/JCI39901. [DOI] [PMC free article] [PubMed] [Google Scholar]
- 34.Rossert J, Eberspaecher H, de CB. Separate cis-acting DNA elements of the mouse pro-alpha 1(I) collagen promoter direct expression of reporter genes to different type I collagen-producing cells in transgenic mice. J Cell Biol. 1995;129:1421–1432. doi: 10.1083/jcb.129.5.1421. [DOI] [PMC free article] [PubMed] [Google Scholar]
- 35.Kiernan AE, Xu J, Gridley T. The Notch ligand JAG1 is required for sensory progenitor development in the mammalian inner ear. PLoS. Genet. 2006;2:e4. doi: 10.1371/journal.pgen.0020004. [DOI] [PMC free article] [PubMed] [Google Scholar]
- 36.Li H, Durbin R. Fast and accurate long-read alignment with Burrows-Wheeler transform. Bioinformatics. 2010;26:589–595. doi: 10.1093/bioinformatics/btp698. [DOI] [PMC free article] [PubMed] [Google Scholar]
- 37.Tiacci E, et al. BRAF mutations in hairy-cell leukemia. N. Engl. J Med. 2011;364:2305–2315. doi: 10.1056/NEJMoa1014209. [DOI] [PMC free article] [PubMed] [Google Scholar]
- 38.Hubbell E, Liu WM, Mei R. Robust estimators for expression analysis. Bioinformatics. 2002;18:1585–1592. doi: 10.1093/bioinformatics/18.12.1585. [DOI] [PubMed] [Google Scholar]
- 39.Barrett T, et al. NCBI GEO: mining millions of expression profiles--database and tools. Nucleic Acids Res. 2005;33:D562–D566. doi: 10.1093/nar/gki022. [DOI] [PMC free article] [PubMed] [Google Scholar]
- 40.Smyth GK. Linear models and empirical bayes methods for assessing differential expression in microarray experiments. Stat. Appl. Genet Mol. Biol. 2004;3 doi: 10.2202/1544-6115.1027. Article3. [DOI] [PubMed] [Google Scholar]
- 41.Simon RM, et al. In: Class Comparison in Design and Analysis of DNA Microarray Investigations. Dietz K, M.G.K.K.J.S.A.T., editors. Springer; New York: 2003. pp. 65–94. [Google Scholar]
- 42.van Es JH, et al. Notch/gamma-secretase inhibition turns proliferative cells in intestinal crypts and adenomas into goblet cells. Nature. 2005;435:959–963. doi: 10.1038/nature03659. [DOI] [PubMed] [Google Scholar]
- 43.Eghbali-Fatourechi GZ, et al. Circulating osteoblast-lineage cells in humans. N. Engl. J Med. 2005;352:1959–1966. doi: 10.1056/NEJMoa044264. [DOI] [PubMed] [Google Scholar]
- 44.Rubin MR, et al. Parathyroid hormone stimulates circulating osteogenic cells in hypoparathyroidism. J Clin. Endocrinol. Metab. 2011;96:176–186. doi: 10.1210/jc.2009-2682. [DOI] [PMC free article] [PubMed] [Google Scholar]
- 45.Manavalan JS, et al. Circulating osteogenic precursor cells in type 2 diabetes mellitus. J Clin. Endocrinol. Metab. 2012;97:3240–3250. doi: 10.1210/jc.2012-1546. [DOI] [PMC free article] [PubMed] [Google Scholar]
- 46.Ghosh-Choudhury N, Harris MA, Feng JQ, Mundy GR, Harris SE. Expression of the BMP 2 gene during bone cell differentiation. Crit. Rev. Eukaryot. Gene Expr. 1994;4:345–355. doi: 10.1615/critreveukargeneexpr.v4.i2-3.30. [DOI] [PubMed] [Google Scholar]
- 47.Rached MT, et al. FoxO1 is a positive regulator of bone formation by favoring protein synthesis and resistance to oxidative stress in osteoblasts. Cell Metab. 2010;11:147–160. doi: 10.1016/j.cmet.2010.01.001. [DOI] [PMC free article] [PubMed] [Google Scholar]
- 48.Parfitt AM, et al. Bone histomorphometry: standardization of nomenclature, symbols, and units. Report of the ASBMR Histomorphometry Nomenclature Committee. J. Bone Miner. Res. 1987;2:595–610. doi: 10.1002/jbmr.5650020617. [DOI] [PubMed] [Google Scholar]
- 49.Parfitt AM. The physiologic and clinical significance of bone histomorphometric data in Bone histomorphometry: techniques and interpretation. In: Recker RR, editor. CRC Press; Boca Raton: 1983. pp. 143–223. [Google Scholar]
- 50.Recker RR, et al. Issues in modern bone histomorphometry. Bone. 2011;49:955–964. doi: 10.1016/j.bone.2011.07.017. [DOI] [PMC free article] [PubMed] [Google Scholar]
Associated Data
This section collects any data citations, data availability statements, or supplementary materials included in this article.
Supplementary Materials
Supplementary Table 1. Nuclear accumulation of β-catenin in osteoblasts of 38.29% MDS/AML patients. β-catenin cellular localization in patients with MDS, AML, and AML arising from prior MDS with associated cytogenetic abnormalities. NL: normal cytogenetics; NE: cytogenetics non-evaluable; ND: cytogenetics not determined. Percentages in parentheses in the 4th column indicate percentages of osteoblasts with nuclear localization of β-catenin; Y denotes nuclear localization of β-catenin in osteoblasts and N denotes membrane localization of β -catenin in osteoblasts. In the latter samples nuclear localization of β-catenin was not detected in any of the osteoblasts.


