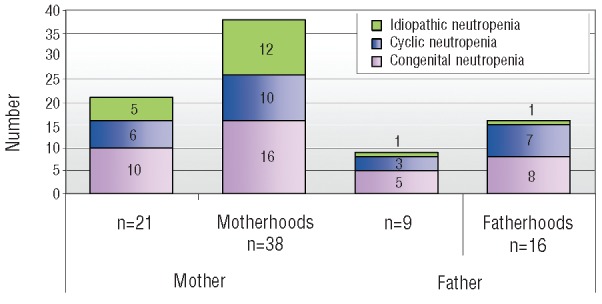
Figure 1.

Distribution of mother- and fatherhood by neutropenia subtype. Congenital neutropenia in purple; cyclic neutropenia in blue and idiopathic neutropenia in green. The first two columns of the figure show the total number of pregnant women (column 1) and the number of reported pregnancies (column 2) for those women. The third column indicates the number of fathers and the fourth column the number of fatherhoods.
