Abstract
Background
Convection enhanced delivery (CED) is a technique using infusion convection currents to deliver therapeutic agents into targeted regions of the brain. Recently, CED is gaining significant acceptance for use in gene therapy of Parkinson’s disease (PD) employing direct infusion into the brain. CED offers advantages in that it targets local areas of the brain, bypasses the blood-brain barrier (BBB), minimizes systemic toxicity of the therapeutics, and allows for delivery of larger molecules that diffusion driven methods cannot achieve. Investigating infusion characteristics such as backflow and morphology is important in developing standard and effective protocols in order to successfully deliver treatments into the brain. Optimizing clinical infusion protocols may reduce backflow, improve final infusion cloud morphology, and maximize infusate penetrance into targeted tissue.
Purpose
The purpose of the current study was to compare metrics during ramped-rate and continuous-rate infusions using two different catheters in order to optimize current infusion protocols. Occasionally, the infusate refluxes proximally up the catheter tip, known as backflow, and minimizing this can potentially reduce undesirable effects in the clinical setting. Traditionally, infusions are performed at a constant rate throughout the entire duration, and backflow is minimized only by slow infusion rates, which increases the time required to deliver the desired amount of infusate. In this study, we investigate the effects of ramping and various infusion rates on backflow and infusion cloud morphology. The independent parameters in the study are: ramping, maximum infusion rate, time between rate changes, and increments of rate changes.
Methods
Backflow was measured using two methods: i) at the point of pressure stabilization within the catheter, and ii) maximum backflow as shown by video data. Infusion cloud morphology was evaluated based on the height-to-width ratio of each infusion cloud at the end of each experiment. Results were tabulated and statistically analyzed to identify any significant differences between protocols.
Results
The experimental results show that CED rampedrate infusion protocols result in smaller backflow distances and more spherical cloud morphologies compared to continuous-rate infusion protocols ending at the same maximum infusion rate. Our results also suggest internal-line pressure measurements can approximate the time-point at which backflow ceases.
Conclusion
Our findings indicate that ramping CED infusion protocols can potentially minimize backflow and produce more spherical infusion clouds. However, further research is required to determine the strength of this correlation, especially in relation to maximum infusion rates.
Keywords: Backflow, Convection-enhanced delivery, Direct Brain Infusion, Parkinson’s Disease, Ramped-rate Infusion Protocol, Continuous-rate Infusion Protocol
Introduction
Convection enhanced delivery (CED) is an advanced technique used to distribute therapeutic agents into targeted regions of the brain.1 Fluid convection is produced by maintaining small pressure gradients throughout the infusion process. This technique has been shown to be superior to simple diffusion-driven administration of therapeutics.2 CED is poised to positively impact broad areas of cerebral oncology3 and restorative neuroscience, including: Parkinson’s disease (PD), Alzheimer’s disease, and Epilepsy. PD alone affects approximately 1% of the population over 60 years of age in industrialized countries.
Recently CED is gaining significant acceptance in treatment of PD. Current PD therapy may reduce symptoms, primarily through the use of dopaminergic agonists, but delivery is primary limited due to the inability of these agents to penetrate the blood-brain barrier (BBB).4 The development of techniques that involve bypassing the BBB to deliver dopaminergic-restoring medications, including CED, is desired.5 Direct brain infusion via CEDhas the additional benefit of reducing systemic toxicity of the therapeutics.6
During a CED procedure, a predetermined volume of infusate is delivered over a defined amount of time through a neurocatheter to the target. In the prototypical infusion, the infusate is symmetrically delivered in a spherical distribution pattern.4 Occasionally, the infusate refluxes proximally up the cathetertip, a phenomenon known as backflow [Figure 1]. The potential for undesired effects is minimized if backflow can be prevented or contained within the target region.7 A major goal of our CED physics is to characterize and engineer methods to eliminate this phenomenon. Another challenge encountered during CED infusions is the time required to deliver the desired amount of infusate. Slow infusion rates as low as 0.5 μL/min have been reported to avoid backflow in rats, but the total volume of infusion was low.8 Historically, infusions were performed at a constant rate throughout the duration of the infusion as sophisticated pump control mechanisms were not yet translated in the field.
Fig. 1:
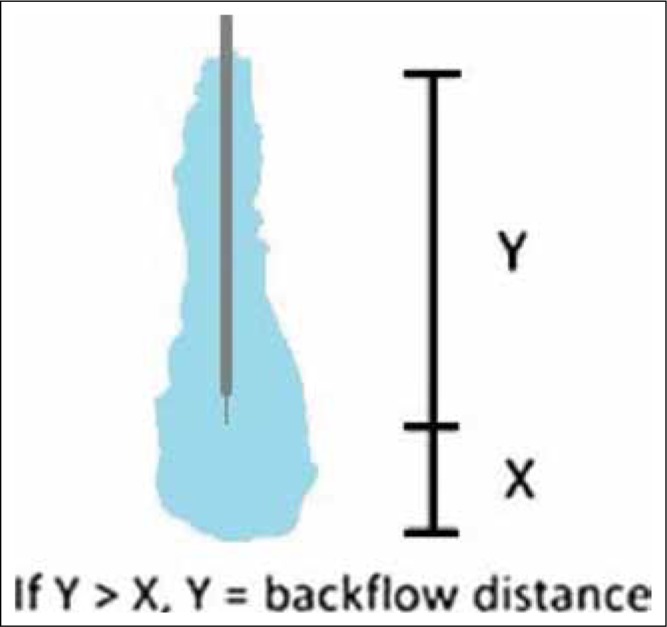
Backflow measurement method. Backflow distance is measured from the tip of the catheter along the catheter-gel interface.
A previous study has shown it may be efficacious to perform ramped-rate CED infusions with an end infusion rate of 5 μL/min, suggesting that higher infusion rates with acceptable levels of backflow are possible and could significantly reduce the duration of the infusion.9 Although a predetermined step-ramp technique has been proposed, no specific protocol that consistently optimizes CED has been developed.4 Our studies are directed at providing insight into CED protocols and their use.
Results from previous experiments suggest a relationship between backflow and infusion rate.10 We therefore proposed an investigation designed to test the hypothesis that ramped-rate infusions improve important metrics of infusions to create protocols for practical clinical use. Optimized clinical infusion protocols may reduce backflow, improve final infusion cloud morphology, and maximize infusate penetration into targeted tissue.
The primary objective of this study was to compare backflow distances and infusion cloud morphology between ramped-rate and continuous-rate protocols. We hypothesize that ramped-rate infusion protocols will result in smaller backflow compared to continuous-rate protocols with the same maximum infusion rates, and smaller ramp increments will also contribute to smaller backflow. We also hypothesize that ramped-rate infusion protocols produce the most symmetrical spherical end-infusion cloud morphology.
Methods
Gel infusion experiments were performed over a period of 3 weeks at the University of Wisconsin – Madison in the September of 2011 by a single individual. All the infusion experiments were recorded with a high definition video camera. Data was subsequently collected and analyzed using Adobe Photoshop® and Microsoft Excel.
Overall Experimental Design
Previously used clinical protocols have ended with final infusion volumes of 50, 75, 150, and 300 μL.9 We have chosen 30 μL, 75 μL, and 300 μL as final volumes to span the range of studied infusion volumes. Continuous-rate infusions were performed at rates of 1 μL/min, 5 μL/min, or10 μL/min until predetermined infusion volumes were reached. Ramped-rate infusions were performed with initial rates of 0 μL/min and increased at increments of 0.01 μL or0.2 μL. Table 1 and 2 show the ramped-rate and continuous-rate infusions protocols performed, organized by rates of infusion and final volumes respectively. Figure 6 graphically represents the time, volume, and rate of infusion of each infusion protocol. Three infusions were performed per protocol for a total of 33 infusions.
Table 1: Results for infusions performed using the VT catheter. Data includes backflow (pressure-based and video-based) and heightto-width ratios. Mean values and standard deviations are calculated whenever possible for all protocols and expressed as (mean ± SD). N/A indicates the measurement was either impossible to perform or was obstructed in some fashion. Time indicates, for ramped-rate infusions, the time spent at each infusion rate. For continuous-rate infusions, time indicates the total infusion duration.
| VT Catheter | Infusion Rates (μL/ min) |
Final Infusion Volume (μL) |
Size of rate changes (μL/ min) |
Time | Backflow (mm) | Morphology | |
|---|---|---|---|---|---|---|---|
| Pressure-based | Video-based | Height:Width Ratio | |||||
| Ramped Protocols | 5 | 75 | 0.2 | 60 sec | N/A | 2.6 ±1.7 | 1.3 ±0.2 |
| 0.01 | 3 sec | ||||||
| 10 | 300 | 0.2 | 60 sec | 1.6 ±0.8 | 1.0 ±0.1 | ||
| 0.01 | 3 sec | ||||||
| Continuous Protocols | 1 | 30 | N/A | 30 min | 1.2 ± 1.6 | 2.7 ±2.1 | 1.4 ±0.5 |
| 75 | 25 min | ||||||
| 300 | 50 min | ||||||
| 5 | 30 | 6 min | 3.6 ± 1.0 | 4.0 ±1.3 | 1.5 ±0.3 | ||
| 75 | 15 min | ||||||
| 10 | 30 | 3 min | 4.3 ± 1.8 | 4.0 ±1.7 | 1.6 ±0.5 | ||
| 300 | 30 min | ||||||
Table 2: Comparison of groups of data. Continuous-rate infusion protocols were compared against the continuous 1 μL/min protocol and ramped-rate infusion protocols at the identical maximum infusion rate. A 1-tailed student’s t-test was performed for unequal variances and p-values are given for backflow and morphology data. Significant differences are highlighted in pink.
| Characteristics | Comparison | P-value | ||
|---|---|---|---|---|
| Backflow | Pressure-based | 1 μL/min | 5 μL/min | 0.141 |
| 1 μL/min | 10 μL/min | 0.066 | ||
| Video-based | 1 μL/min | 5 μL/min | 0.086 | |
| 1 μL/min | 10 μL/min | 0.096 | ||
| 5 μL/min | Ramped | 0.079 | ||
| 10 μL/min | Ramped | 0.007 | ||
| Morphology | Height-to-width ratio | 1 μL/min | 5 μL/min | 0.256 |
| 1 μL/min | 10 μL/min | 0.207 | ||
| 5 μL/min | Ramped | 0.062 | ||
| 10 μL/min | Ramped | 0.018 | ||
Fig. 6:
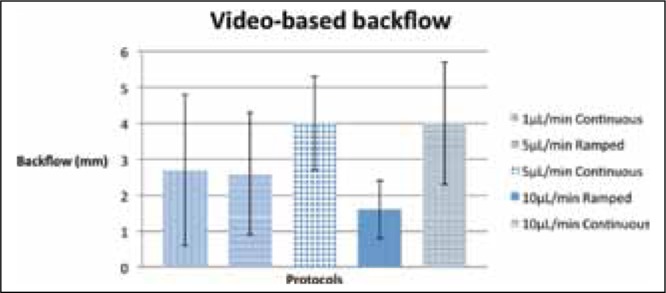
Graph showing the maximum backflow (video-based) for different protocols. Error bars indicate standard deviation.
Catheter and equipment specification
The equipment used in the study include a Pressure Monitor (Engineering Resources Group, Pembroke Pines, FL), Navigus Trajectory Guide (Medtronic Corp, Minneapolis, MN), and PHD2000 MRI Syringe pump (Harvard Apparatus, Holliston, MA). The catheter used was a valve-tip (VT) catheter (Engineering Resources Group, Pembroke Pines, FL).
The VT catheter has a single endport stepped design with a retractable silica stylet running within the entire length of the 3-foot tubing and catheter apparatus. The fused silica shaft has an outer diameter (OD) 0.65 mm and an inner diameter (ID) 0.32 mm. The polyamide tip has an OD 0.36 mm and an ID 0.25 mm and extends 3 mm from the end of the silica shaft. The VT catheter employs a valve feature at the tip to prevent endport occlusion and tissue from entering the catheter during placement.
Preparation of materials, equipment and computer program
All infusions were performed in 0.2% agarose gel with a 0.017% bromophenol blue tracker dye, both prepared as previously published.10 The preparation of the equipment and catheter, as well as the computer program used to control the infusion rates, was also carried out as previously published.
Catheter insertion and infusion technique
The catheter was inserted into the gel as previously reported.10 Specifically, it was introduced into the gel using a remote introducer. The stylet in the VT catheter was advanced approximately 0.5 mm beyond the catheter tip to close the valve, preventing tissue from entering the endport. Once inserted in the gel, the stylet was retracted approximately 3 mm to open the valve. Catheter insertions were performed over a period of approximately 5 seconds. After the catheter was properly inserted and the internal pressure had stabilized, the pressure monitoring system was calibrated and the infusion process was started [Figure 2].
Fig. 2:
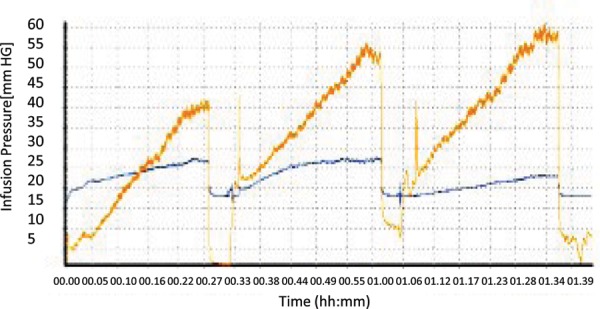
Infusion pressure output measured in mmHg versus time during the infusion for the SF and VT catheters. Pressure stabilization is represented by the plateaus in the pressure graphs.
Upon reaching the programmed infusate volume, the infusion pump automatically stopped. Pressure stabilization was reached before additional infusions were performed by advancing the catheter an additional 20 mm into the gel. The process of insertion was then repeated until 3 infusions per gel were completed. After the final infusion, approximately 10 minutes elapsed before the catheter was removed from the gel.
Backflow measurement
Two methods were used to measure backflow based on pressure and video. Pressure-based backflow was measured based on recorded pressure data and backflow was measured at the point when the rate of change in internal measured pressure became zero. For ramped-rate infusions, internal pressure was constantly changing due to the programmed rate changes; hence this method was not applied to ramped-rate protocols. Video-based backflow was measured manually on the computer monitor using Adobe Photoshop® at the point when video data indicated infusate expansion had stopped.
Infusion morphology measurement
Infusion cloud morphology was determined based on the measured height to width ratio of the infusion clouds immediately at the end of the infusion. Images were extracted from the video data and analyzed in Adobe Photoshop®. Measurements were taken manually on the computer monitor and height-width ratios were calculated as a method of quantifying infusion cloud morphology.
Statistical analysis
Statistical means and standard deviations were calculated (t-test for unequal variances). P-values were calculated to identify any statistically significant differences in backflow and cloud morphology between the protocols using a 1-tailed t-test, while a 2-tailed t-test calculated the p-values comparing backflow between the 2 systems of measurement (pressure-based and video-based).
Results
A total of 33 infusions were performed in 11 agarose gels: 21 continuous-rate infusions and 12 ramped-rate infusions. Infusion protocols are displayed in Figure 3. The results are summarized in Tables 1 and 2.
Fig. 3:
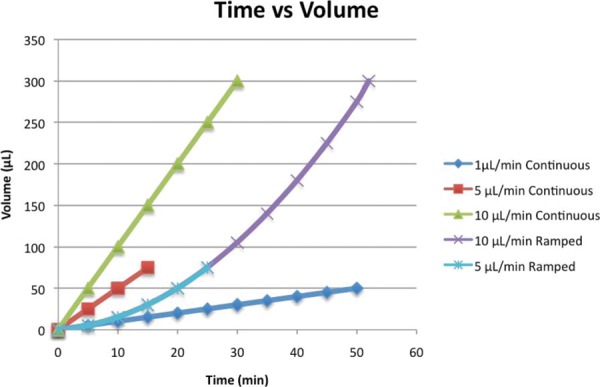
Graph representing infusion volume over time of experimental infusion protocols. Infusion rate is represented by slope of the line at any given time point. Ramped rates with increment changes of 0.01 μL/min and 0.2 μL/min are represented by the same line as they are nearly congruent.
Comparing Backflow in Continuous-rate and Ramped-rate Infusions
To first verify that infusion rates influence backflow, the pressure-based backflow measurements for continuous-rate infusions were compared. Continuous-rate infusions ending at 1 μL/min exhibited a mean pressure-based backflow of 1.2 mm, while those at 5 μL/min and 10 μL/min exhibited backflows of 3.6 mm and 4.3 mm respectively [Table 1]. A similar trend was observed in mean video-based backflow measurements. Infusions ending at 1 μL/min resulted in a mean video-based backflow of 2.7 mm, while those at 5 μL/min and 10 μL/min resulted in mean video-based backflows of 4.0 mm. The p-values are insignificant for pressure-based backflows (0.141 comparing 1 μL/min and 5 μL/min, and 0.066 comparing 1 μL/min and 10 μL/min) and video-based backflows (0.086 comparing 1 μL/min and 5 μL/min, and 0.096 comparing 1 μL/min and 10 μL/min). However, previous studies suggest a possible correlation between infusion rates and backflow, our analyses also indicate a positive trend.
In general, continuous-rate infusion protocols exhibited greater backflow than ramped-rate protocols with equal maximum infusion rates. The mean video-based backflow for continuous-rate infusions at 5 μL/minwas 4.0 mm, while the mean video-based backflow for ramped-rate infusions ending at 5 μL/min was 2.6 mm. For infusions ending at 10 μL/min, continuous-rate protocols demonstrated a mean video-based backflow of 4.0 mm while ramped-rate protocols demonstrated a mean video-based backflow of 1.6 mm. The difference between video-based backflows for continuous-rate and ramped-rate protocols is strongly significant for infusions ending at 10 μL/min (p = 0.007, Table 2).
Comparing Infusion Cloud Morphology in Continuous-rate and Ramped-rate Infusions
To determine if infusion rates impact end-infusion cloud morphology, the height-to-width ratios of infusion clouds produced by continuous-rate protocols at varying infusion rates were compared [Figure 4]. Infusions ending at 1 μL/min, 5 μL/min, and 10 μL/min produced height-width ratios of 1.4 mm, 1.5 mm, and 1.6 mm respectively. Though the p-values are again insignificant (0.256 comparing 1 μL/min and 5 μL/min, and 0.207 comparing 1 μL/min and 10 μL/min), the data was organized by maximum infusion rates for consistency (see backflow analysis, above).
Fig. 4:
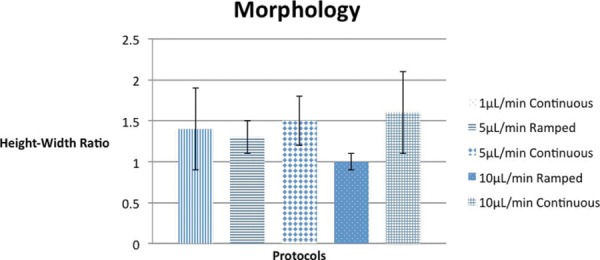
Graph showing the end-infusion morphology for different protocols, as measured by height-to-width ratio of the end-infusion cloud. Error bars indicate standard deviation.
Based on cloud morphology data [Table 1] ramped-rate infusions produced more spherical infusion clouds than continuous-rate infusions. The mean height-to-width ratio for ramped-rate infusions ending at 5 μL/min was 1.3 mm, while that for continuous-rate infusions at the same rate was 1.5 mm. For infusions ending at 10 μL/min, the mean height-to-width ratios for ramped-rate and continuous-rate protocols were 1.0 mm and 1.6 mm respectively. The difference between height-to-width ratios for continuous-rate and ramped-rate protocols is again significant for infusions ending at 10 μL/min (p = 0.018, table 2).
Comparing Pressure-based vs Video-based Backflow Measurement Systems
To evaluate the method of internal-line pressure monitoring in estimating backflow, the measurements of backflow recorded using these two methods were compared in continuous-rate infusion protocols. For infusions at 1 μL/min, mean pressure-based backflow recorded was 1.2 mm and mean video-based backflow was 2.7 mm (table 1). For infusions at 5 μL/min, pressure-based and video-based backflows were 3.6 mm and 4.0 mm respectively, while infusions at 10 μL/min demonstrated those backflows at 4.3 mm and 4.0 mm respectively. The differences between pressure-based and video-based systems of measurement were all insignificant [Table 3], with p-values of 0.920, 0.528, and 0.821 for 1 μL/min, 5 μL/min, and 10 μL/min infusions respectively.
Table 3: Comparison of pressure-based and video-based backflow measurements. Backflow measurements for continuousrate infusions were analyzed using a 2-tailed t-test for unequal variances.Significant differences are highlighted.
| Comparison | Infusion Rates | P-value | |
|---|---|---|---|
| Pressure-based | Video-based | 1 μL/min | 0.920 |
| 5 μL/min | 0.528 | ||
| 10 μL/min | 0.821 | ||
Discussion
Ramped-rate vs. Continuous-rate Infusion Protocols
Infusions performed using our neurocatheter indicate that ramped-rate infusion protocols produce statistically significant smaller backflows than continuous-rate infusion protocols provided themaximum infusion rate is sufficient large (10 μL/min in our experiments). Similarly, infusion cloud height-to-width are more spherical than continuous-rate infusion clouds.
The smaller backflow measurements and more spherical infusion clouds created using ramped-rate infusion protocols may be due to the initial low rates of infusion at the beginning of the infusion, allowing the catheter-gel interface to form a tighter bond. Another possibility is that the additional time at low infusion rates may allow for a change in pore fraction in the surrounding tissue providing a larger area for pressurized convection currents to dissipate their energy, which increases infusate penetration and reduces backflow. It is important to bear in mind that agarose gel does not completely model all of the aspects of brain tissue and other physics of infusion properties have yet to be characterized.
The statistically significant differences in mean backflow measurements between continuous-rate and ramped-rate infusion protocols suggest a consistent trend, but the large error bars indicate significant variation between individual infusions [Figures 5 and 6]. This variation, represented by the large standard deviations, highlights one of the challenges in developing CED protocols to produce minimal backflow and consistent infusion clouds.
Fig. 5:
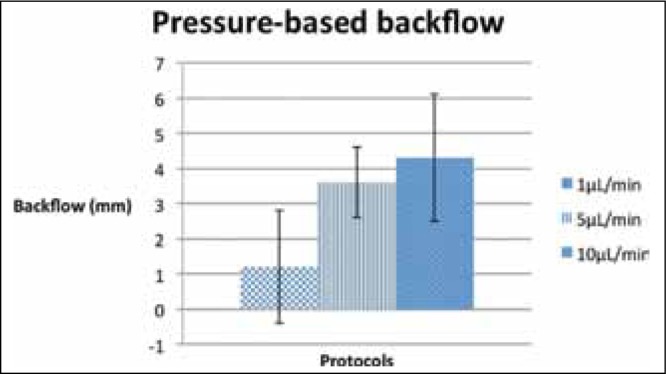
Graph showing the relationship between continuous-rate infusion rates and backflow measurements. Error bars indicate standard deviation.
Pressure-basedvs Video-based Backflow Measurements
Our results suggest that backflow and its cessation can be determined using internal-line pressure measurements. We have previously shown that pressure readings in continuous-rate infusions can approximate the time-point at which backflow ceases to increase. In theory, backflow in ramped-rate infusions could be estimated in a similar fashion by monitoring the instantaneous rate of change in internal-line pressure.
As direct visualization of therapeutic delivery cannot be performed in real-time, pressure readings could be a viable method of monitoring infusions to maximize infusion rates while minimizing backflow. Furthermore, software that utilizes a closed-loop feedback system to automatically optimize infusion rates while simultaneously monitoring backflow via changes in internal-line pressure could be designed. The program could monitor any changes in internal-line pressure that are inconstant with the infusion rate and adjust the latter appropriately, maximizing infusion rates without increasing backflow.
Conclusions
We have shown that ramping CED infusion protocols can potentially minimize backflow and produce infusion clouds with a more spherical morphology. However, further investigation is required to determine the strength of this correlation, especially with respect to maximum infusion rates. We have also suggested a novel use for pressure monitoring systems in CED, which would allow for real-time changes in infusion rate to maximize delivery rate while minimizing backflow.
Acknowledgements
The authors acknowledge financial support from the Kinetics Foundation, Los Altos, CA and helpful discussion from Therataxis, Inc, Baltimore, MD.
Footnotes
This article complies with International Committee of Medical Journal editor’s uniform requirements for manuscript.
Competing interests: None
Source of Funding: Kinetics Foundation, Los Altos, CA
References
- 1.Bobo RH, Laske DW, Akbasak A et al. Convection-enhanced delivery of macromolecules in the brain. Proc Natl Acad Sci U S A. 1994;91(6):2076–80. doi: 10.1073/pnas.91.6.2076. [DOI] [PMC free article] [PubMed] [Google Scholar]
- 2.Raghavan R, Mikaelian S, Brady M et al. Fluid infusions from catheters into elastic tissue: I. Azimuthally symmetric backflow in homogeneous media. Phys Med Biol. 2010;55(1):281–304. doi: 10.1088/0031-9155/55/1/017. [DOI] [PubMed] [Google Scholar]
- 3.Rogawski MA. Convection-enhanced delivery in the treatment of epilepsy. Neurotherapeutics. 2009;6(2):344–51. doi: 10.1016/j.nurt.2009.01.017. [DOI] [PMC free article] [PubMed] [Google Scholar]
- 4.Lam MF, Thomas MG, Lind CR et al. Neurosurgical convection-enhanced delivery of treatments for Parkinson’s disease. J Clin Neurosci. 2011;18(9):1163–7. doi: 10.1016/j.jocn.2011.01.012. [DOI] [PubMed] [Google Scholar]
- 5.Bankiewicz KS, Eberling JL, Kohutnicka M et al. Convection-enhanced delivery of AAV vector in parkinsonian monkeys; in vivo detection of gene expression and restoration of dopaminergic function using pro-drug approach. Experimental neurology. 2000;64(1):2–14. doi: 10.1006/exnr.2000.7408. [DOI] [PubMed] [Google Scholar]
- 6.Debinski W, Tatter SB. Convection-enhanced delivery to achieve widespread distribution of viral vectors: Predicting clinical implementation. Curr Opin Mol Ther. 2010;12(6):647–53. [PubMed] [Google Scholar]
- 7.Raghavan R, Brady M. Predictive models for pressure-driven fluid infusions into brain parenchyma. Phys Med Biol. 2011;56(19):6179–204. doi: 10.1088/0031-9155/56/19/003. [DOI] [PMC free article] [PubMed] [Google Scholar]
- 8.Morrison PF, Chen MY, Chadwick RS et al. Focal delivery during direct infusion to brain: role of flow rate, catheter diameter, and tissue mechanics. Am J Physiol. 1999;277(4 Pt 2):R1218–29. doi: 10.1152/ajpregu.1999.277.4.R1218. [DOI] [PubMed] [Google Scholar]
- 9.Richardson RM, Kells AP, Rosenbluth KH et al. Interventional MRI-guided putaminal delivery of AAV2-GDNF for a planned clinical trial in Parkinson’s disease. Molecular therapy: the journal of the American Society of Gene Therapy. [Research Support, N.I.H., Extramural Research Support, Non-U.S. Gov’t] 2011;19(6):1048–57. doi: 10.1038/mt.2011.11. [DOI] [PMC free article] [PubMed] [Google Scholar]
- 10.Sillay K, Schomberg D, Hinchman A et al. Benchmarking the ERG valve tip and MRI Interventions Smart Flow neurocatheter convection-enhanced delivery system’s performance in a gel model of the brain: employing infusion protocols proposed for gene therapy for Parkinson’s disease. J Neural Eng. 2012;9(2):026009. doi: 10.1088/1741-2560/9/2/026009. [DOI] [PubMed] [Google Scholar]
- 11.White E, Bienemann A, Malone J et al. An evaluation of the relationships between catheter design and tissue mechanics in achieving high-flow convection-enhanced delivery. J Neurosci Methods. 2011;199(1):87–97. doi: 10.1016/j.jneumeth.2011.04.027. [DOI] [PubMed] [Google Scholar]
- 12.San Sebastian W, Richardson RM, Kells AP et al. Safety and tolerability of MRI-guided convection-enhanced delivery of AAV2-hAADC with a novel delivery platform in non-human primate striatum. Human gene therapy. 2011 Oct 21; doi: 10.1089/hum.2011.162. [DOI] [PMC free article] [PubMed] [Google Scholar]
- 13.Chen ZJ, Broaddus WC, Viswanathan RR et al. Intraparenchymal drug delivery via positive-pressure infusion: experimental and modeling studies of poroelasticity in brain phantom gels. IEEE Trans Biomed Eng. 2002;49(2):85–96. doi: 10.1109/10.979348. [DOI] [PubMed] [Google Scholar]


