Abstract
Background
Convection enhanced delivery (CED) is emerging as a promising infusion toolto facilitate delivery of therapeutic agents into the brain via mechanically controlled pumps. Infusion protocols and catheter design have an important impact on delivery. CED is a valid alternative for systemic administration of agents in clinical trials for cell and gene therapies. Where gel and ex vivo models are not sufficient in modeling the disease, in vivo models allow researchers to better understand the underlying mechanisms of neuron degeneration, which is helpful in finding novel approaches to control the process or reverse the progression. Determining the risks, benefits, and efficacy of new gene therapies introduced via CED will pave a way to enter human clinical trial.
Purpose
The objective of this study is to compare volume distribution (Vd)/ volume infused (Vi) ratios and backflow measurements following CED infusions in ex vivo versus in vivo non-human primate brain tissue, based on infusion protocols developed in vitro.
Methods
In ex vivo infusions, the first brain received 2 infusions using a balloon catheter at rates of 1 μL/min and 2 μL/min for 30 minutes. The second and third brains received infusions using a valve-tip (VT) catheter at 1 μL/min for 30 minutes. The fourth brain received a total of 45 μL infused at a rate of 1 μL/min for 15 minutes followed by 2 μL/min for 15 minutes. Imaging was performed (SPGR FA34) every 3 minutes. In the in vivo group, 4 subjects received a total of 8 infusions of 50 μL. Subjects 1 and 2 received infusions at 1.0 μL/min using a VT catheter in the left hemisphere and a smart-flow (SF) catheter in the right hemisphere. Subjects 3 and 4 each received 1 infusion in the left and right hemisphere at 1.0 μL/min.
Results
MRI calculations of Vd/Vi did not significantly differ from those obtained on post-mortem pathology. The mean measured Vd/Vi of in vivo (5.23 + /-1.67) compared to ex vivo (2.17 + /-1.39) demonstrated a significantly larger Vd/Vi for in vivo by 2.4 times (p = 0.0017).
Conclusion
We detected higher ratios in the in vivo subjects than in ex vivo. This difference could be explained by the extra cellular space volume fraction. Studies evaluating backflow and morphology use in vivo tissue as a medium are recommended. Further investigation is warranted to evaluate the role blood pressure and heart rate may play in human CED clinical trials.
Keywords: Convection enhanced delivery (CED), Neurocatheter, Non-human primate, Volume distribution volume infused ratio (Vd/Vi), Backflow
Introduction
High flow micro infusion and its impact on tissue penetration and related pharmacodynamics is well documented in previous ex vivo studies. Perusal of NIH infusion model reveals how to measure uniformity in the medium, proving the roles of flow rate, catheter diameter, targeted tissue, and backflow during focal delivery and direct infusion to the brain. Hadaczeket el al have stated that fluid circulation within the CNS through the perivascular space is the primary mechanism of distributing administered therapeutic agents by CED.1 Raghavan and Brady have underlined direct infusions of biological therapeutic agents into brain parenchyma.1-5 However, variations in discrete brain areas and cytoarchitectural precincts within the brain is conducive for uncertain response to fluid flow and pressure. Two main remaining inquiries of significance to consider are i) infusion-induced interstitial expansion and ii) upgraded elucidation of the diffusion tensor of a particle limited to the interstitial spaces.
CED is considered as an emerging and promising infusion tool to facilitate delivery of macromolecules that could not otherwise penetrate the blood brain barrier (BBB) and more precise volumes of therapeutic agents into the brain via mechanically controlled pumps.5,6,7,8 Infusion protocols and catheter design have an important impact on delivery, and CED is a valid alternative employed for systemic administration of agents in clinical trials. CED infusion performance in agarose gel has previously been benchmarked using an agarose gel model while testing methods of delivery of multiple spherical payloads to fill a non-spherical target, a process that may influence treatment.9,10 In addition, ramped infusion protocols using an open endport infusion catheter in gels have been published.11,12 Specific performance characteristics of the infusion catheter proposed, including measurements of Vd/Vi ratios, backflow distance, and cloud morphology, indicate CED as a viable method for infusion.
Where gel and ex vivo models are insufficient in modeling the disease, in vivo models allow researchers to better understand the underlying mechanisms of neuron degeneration, which is helpful in finding novel approaches to control and reverse the progression of PD (Figure 1). The future of cell and gene therapies warrant additional investigation of the use of ex vivo non-human primate (NHP) and human cadaveric tissue. Furthermore, the introduction of gene vectors into animal models via CED to determine the risks, benefits, and efficacy of the therapeutic agent will pave a way to the human clinical trial phase.
Fig. 1:
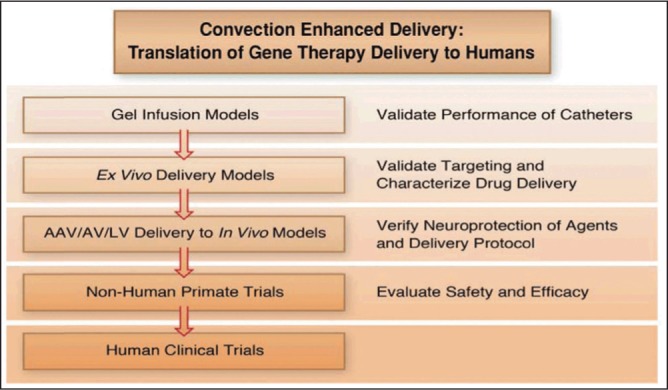
Convection enhanced delivery: A method of choice for gene-based therapy trials and translation to humans.13
Fig. 2:
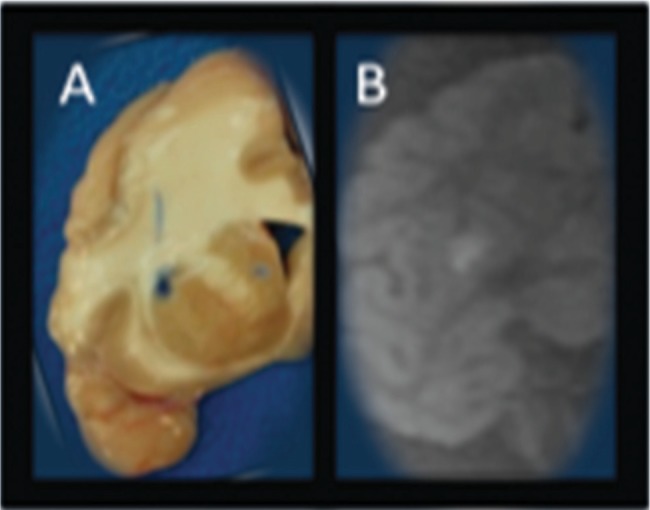
Ex vivo Cynomolgus (Macacafascicularis) Putamenal CED, 30 ul, 0.017% BPB/2 mMol Gd. Volume ofdistribution measured on pathologicalphotograph (A) displayed adjacent to 1.5T MRI (B) obtained with GE six-channelflexible transmit/receive coils used forhuman stereotaxy prospective iMRIstereotaxy. 1.5T MRI image quality limitedby relative 1/8x NHP cranial volume, however, successfully quantifies infusatecatheter reflux and volume of distribution prospectively.
Fig. 3:
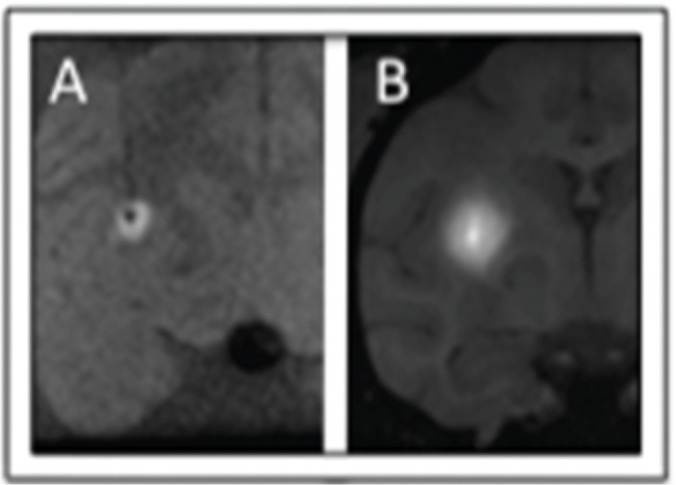
Ex vivo (A, 1.5T, 6-ch T/R flexcoil) and in vivo (B, 3.0T, 3” T/R loop coil) rCED infusions with similar technique. The Vd/Vi average ratio measured: in vivo (5.23 + /-1.67) compared to ex vivo (2.17 + /-1.39) was significantly larger by 2.4 times(p = 0.0017). These results support the hypothesis that an active cardiac-drivenperivascular pump improves distribution in CED.
Methods
2.1. Veterinary Care of animals used: The University of Wisconsin Medical School has an AAALAC accredited, USDA approved animal facility with full-time veterinarians and trained animal handlers. All procedures and care are coordinated and approved through University of Wisconsin School of Medicine and Public Health Animal Care and Use committee (ACUC) and the Veterinarians at the Research Animal Resource Center to ensure that proper guidelines are followed.
2.2. Ex vivo experiments: Infusions were performed in 4 non-human primate brains (Cynomolgus (Macacafascicularis; Ex1, Ex2, Ex3, Ex4) were obtained from the Wisconsin National Primate Research Center. All these brains received 30 ml, 0.017% BPB/2 mMolGd via putamenal CED.
The first brain received 2 infusions using a balloon catheter at rates of 1μL/min and 2μL/min for 30 minutes. The second and third brains received infusions using a valve-tip (VT) catheter at 1 µL/min for 30 minutes using advancement and retraction protocols [8]. The fourth brain received a total of 45 µL infused at a rate of 1 µL/min for 15 minutes immediately followed by 2 µL/min for 15 minutes. Imaging was performed (SPGR FA34) every 3 minutes during the infusions. Volume of distribution measured on pathological imaging picture displayed adjacent to 1.5T MRI obtained with GE six-channel flexible transmit/receive coils used for human stereotaxy prospective iMRIstereotaxy. 1.5T MRI image quality limited by relative 1/8x NHP cranial volume, however, successfully quantifies infusate catheter reflux and volume of distribution prospectively. The details of brains (Table 1a), infusion volume, location, and catheter type (Table 1b) are presented below.
Table 1a: Ex vivo brains.
| Number | Brain ID# | Animal number |
|---|---|---|
| Ex1 | 11C136 | r03103 |
| Ex2 | 11C144 | rh2287 |
| Ex3 | 11C145 | r00005 |
| Ex4 | 11C161 | Rhas05 |
Table 1b: Ex vivo infusion volume, location, catheter type.
| Number | Location | Volume | Catheter |
|---|---|---|---|
| Ex1 | Right | 30 min @ 1 μL/min | VT |
| Left #1 | 30 min @ 1 μL/min | VT | |
| Left#2 | 30 min @ 1 μL/min | VT | |
| Left #3 | 30 min @ 1 μL/min | VT | |
| Ex2/Ex3 | Right #1 | 30 min @ 1 μL/min | VT |
| Left #1 | 30 min @ 1 μL/min | VT | |
| Right #2 | 30 min @ 1 μL/min | VT | |
| Left #2 | 30 min @ 1 μL/min | VT | |
| Ex4 | Right #1 | 15 min @ 1 μL/min, 15 min @ 2 μL/min |
balloon |
| Left #1 | 15 min @ 1 μL/min, 15 min @ 2 μL/min |
balloon |
2.3. In in vivo experiments: Four non-human primate subjects (In 1 male, In 2 female, In 3 female, In 4 male) were received from Wisconsin National Primate Research. The age of these four subjects varied as 5.2, 8.3, 8.6, 11.3 years, respectively. Also, the weights ranged from 4.0, 3.44, 3.16, 13.24 kg, respectively. All four subjects received a total of 8 infusions of 50 µL each infusion. Subjects 1 and 2 received infusions at 1.0 µL/min using a VT catheter in the left hemisphere and a smart-flow (SF) catheter in the right hemisphere. Subjects 3 and 4 each received 1 infusion in the left hemisphere at 1.0 µL/min and 1 in the right hemisphere using the UCSF 3.0R ramped protocol. Post mortem pathology slices were photographed to document end infusion distribution. Non-human primate age, gender, and weight are presented in Table 2a and infusion volume, location, catheter type are listed in Table 2b.
Table 2a: Nonhuman primates age, gender and weight.
| Number | Animal ID# | Age (years) | Gender | Weight (kg) |
|---|---|---|---|---|
| In1 | CY0444 | 5.2 | Male | 4.0 |
| In2 | CY0301 | 8.3 | Female | 3.44 |
| In3 | CY0297 | 8.6 | Female | 3.16 |
| In4 | CY0293 | 11.3 | Male | 13.24 |
Table 2b: In vivo infusion volume, location, catheter type.
| Number | Location | Volume | Catheter |
|---|---|---|---|
| In1 | Right | 50 min @ 1 μL/min | VT |
| In1 | Left | UCSF 3.0R | SF |
| In2 | Right | UCSF 3.0R | SF |
| In2 | Left | 50 min @ 1 μL/min | VT |
| In3 | Right | UCSF 3.0R | SF |
| In3 | Left | 50 min @ 1 μL/min | VT |
| In4 | Right | UCSF 3.0R | SF |
| In4 | Left | 50 min @ 1 μL/min | VT |
Backflow and infusion morphology measurements were compared with the Vd/Vi ratios of the ex vivo and in vivo trials with 1) iterative MRI and 2) pathology slice measurements to calculate the Vd/Vi ratios. MRI calculations of Vd/Vi did not significantly differ from those obtained on post-mortem pathology.
Analysis
Back flow measurements from the tip of the catheter to the top of the cloud were taken at each MRI scan in which there was visible infusate. Vd/Vi: Vd was derived from the equation 4/3*pi*r^3 by measuring the radius of the infusion cloud, from the tip of the catheter to the edge of the infusion cloud. Volume infused was monitored with the pressure readings. Vd/Vi was then calculated by finding the quotient of the two volumes. Pressure recordings were monitored throughout the infusion.
Statistics
All statistics were conducted with a two-variable t-test in which all p-values below 0.05 were considered significant.
Results
In ex vivo experiments, real time MRI guided CED (rCED, 1.5T, SPGR FA34 Q5 min, line pressure monitoring, 15–30 ml @ 1 ml/min) infusions were performed in 4 non-human primate (NHP) brains with VT catheter. Vd/Vi ratio was 2.17 + /- 1.39. Ex vivo backflow observed ranged from 3.24 to 9.15 mm following different infusions.
In in vivo experiments, rCED (3.0T, SPGR FA34, Q5 min) infusions were performed in 4 non-human primate (NHP) brains with VT and SF catheter. The mean measured Vd/Vi ratio of in vivo (5.23 + /-1.67) compared to ex vivo (2.17 + /-1.39) demonstrated a significantly larger Vd/Vi for in vivo by 2.4 times (p = 0.0017). In vivo backflow observed ranged from 1.8 to 5.1 mm following different infusions Ex vivo vs. in- vivo Vd/Vi mismatch: As expected, in vivo infusions resulted in a larger Vd/Vi than ex vivo infusions (2.4x, p<0.05, supporting the perivascular pump hypothesis and the hypothesis that change in extra cellular space occur post mortem. Pathology slices were obtained to correlate MRI infusion cloud size with BPB pathology.
Ex-vivo infusions performed with 95 mm Valve-tip (VT) catheter or 95 mm Baloon catheter inflated (BCi) or deflated as a control (BCd) are shown in Table 3. In vivo infusions performed with UCSF protocol using Valve-tip (VT) catheter or SmartFlow catheter in Table 4.
Table 3: Ex-vivo infusions performed with 95 mm Valve-tip (VT) catheter or 95mm Baloon catheter inflated (BCi) or deflated as a control (BCd).
| Subject | Infusion | Catheter | Target Volume | Rate | Backflow (mm) | Vd/Vi (μl/μl) | Images |
|---|---|---|---|---|---|---|---|
| Ex1 | 1 | VT | 30 μl | 1 μl/min | 3.9 | 1.1 | 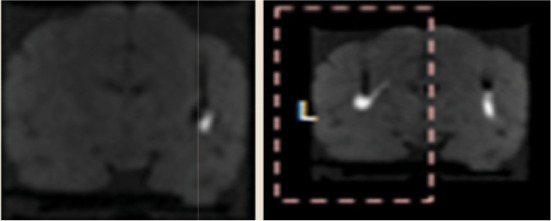 |
| 2 | 2.3 | 1.4 | |||||
| 3 | 2.3 | 1.8 | |||||
| 4 | 4.3 | 1.3 | |||||
| Ex2 | 5 | 1.8 | 0.1 | 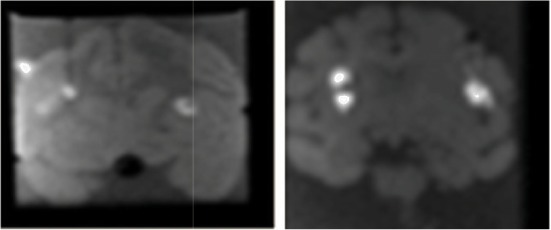 |
|||
| 6 | 2.1 | 0.8 | |||||
| 7 | 3.2 | 0.6 | |||||
| 8 | 2.3 | 1.3 | |||||
| Ex3 | 9 | 3.6 | 3.3 | 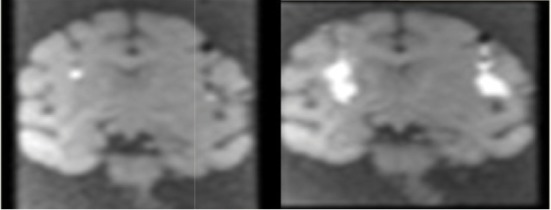 |
|||
| 10 | 3.6 | 2.1 | |||||
| 11 | 2.3 | 1.6 | |||||
| 12 | 2.0 | 1.5 | |||||
| Ex4 | 13 | BCd | 45 μl | 15 min @ 1μl/min 15 min @ 2 μl/min | 5.1 | 1.7 | 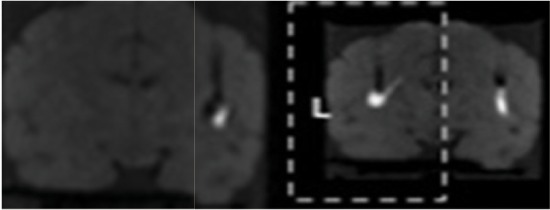 |
| 14 | BCi | 2.7 | 1.3 |
Table 4: In vivo infusions performed with UCSF protocol using Valve-tip (VT) catheter or SmartFlow catheter.
| Subject | Infusion | Catheter | Target Volume | Rate | Backflow (mm) | Vd/Vi (μl/μl) | Images |
|---|---|---|---|---|---|---|---|
| In1 | 1-R (Left side of the screen) | VT | 9.15 | 8.31 | 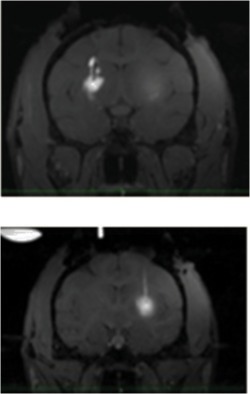 |
||
| 1-L (right of the screen) | SF | 3.60 | 4.67 | ||||
| In2 | 1-R (Left side of the screen) | SF | 6.25 | 3.87 | 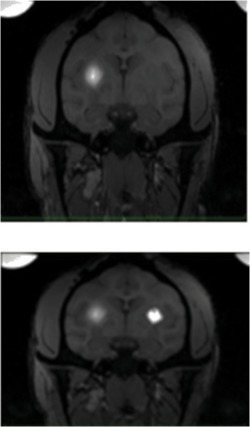 |
||
| 1-L (right side of the screen) | VT | 3.24 | 3.87 | ||||
| In3 | 1-R (left side of the screen) | SF | 6.03 | 4.67 | 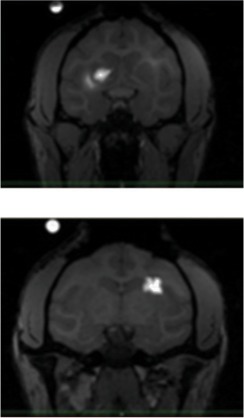 |
||
| 1-L (right side of the screen) | VT | 3.82 | 7.73 | ||||
| In4 | 1-R (left side of the screen) | SF | 3.71 | 3.71 | 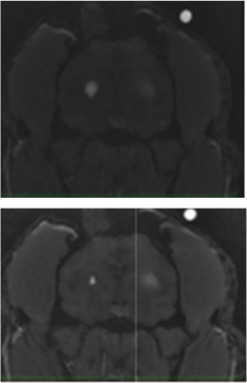 |
||
| 1-L (right side of the screen) | VT | 4.98 | 4.98 |
Discussion
Previous efforts in benchmarking CED catheter performance enhance translation of brain infusion techniques to the spinal cord. Disparate infusion catheter designs are readily benchmarked in an agarose gel model of the brain to validate first principles of CED infusion systems.14 Infusion strategies such as techniques for the delivery of multiple spherical payloads to fill a non-spherical targetare also readily evaluated in agarose gel with real-time video recording and inline pressure monitoring.15 Recent published ramped infusion protocols using an open endportinfusion catheter were replicated in gels and found to be viable.16,17 These results in an agarose gel model of brain suggest that specific performance characteristics of an infusion catheter proposed for CED were in line with benchmark data when backflow, infusion cloud morphology, and volume of distribution were compared, thus providing confirmation that proposed CED techniques appear promising for eventual clinical application. Independent confirmation of proposed protocols is important to establish optimal devices and protocols designed for human clinical trials employing CED and the agarose gel model can help refine first principles and prepare for tissue-based application.
In the present study, we observed significant differences between backflow rates in ex vivo and in vivo infusion models employing the CED method. Backflow ranged from 1.8 to 5.1 mm in ex vivo subjects and was significantly less than the 3.9 to 8.3 mm backflow in in vivo subjects. Employing protocols with higher infusion rates yielded enhanced backflow both in ex vivo and in vivo experiments. Comparing backflow of VT and SF catheter, the latter resulted in more backflow, possibly due to the greater diameter of the SF catheter. These findings corroborate to backflow observed by Morrison et al.2 Backflow association with catheter geometry and infusion rate is reported.18 We hypothesized in our agarose gel model that lack of detection of increased backflow during transitions to higher flow rates was due to the fact that the backflow was less than the radius of the infusion cloud.9 Other factors known to impact backflow are shear modulus and hydraulic conductivity, which are difficult to model and thus make direct backflow comparisons between gel and brain tissue challenging.19 Raghavan and associates used a porcine model to accomplish infusions of a saline solution of the magnetic resonance marker gadodiamide into brain parenchyma and paved an efficient way to monitor infusate distribution.19 These findings, in addition to the MRI data, facilitated the quantification of the spreading of the volume fraction of the interstitium primarily in white matter of the brain exhibiting infusion edema.
Because it is predicted that CED is only capable of infusing into extra-cellular space, changes in extra-cellular space post-mortem could be responsible for the observed difference in the Vd/Vi between ex-vivo and in-vivo experiments. Vd/Vi ratios relate primarily to the pore fraction of the material. In an agarose model of the brain, we have validated that though these ratios may be comparable, the mechanism by which diffusion of the infusate through the medium might fluctuate.9 However, Vd/Vi ratios can be used as a reference to validate our methods and use of gel surrogates in preparation for in vivo and clinical trials. The results from two noteworthy studies in the recent past employing standard protocols for infusion into non-human primate putamen reported Vd/Vi ratios of 3.3 ± 0.3 (n = 17).20,11 These findings were different from our reported Vd/Vi ratio of 5.23 + 1.67 (n = 8) in vivo and 2.17 + 1.39 (n = 8) ex vivo. Both ex vivo and in vivo results varied significantly (p = 0.0017).
CED is currently limited by suboptimal methodologies for monitoring the delivery of therapeutic agents that allow procedural optimization to meet standards of therapeutic efficacy, including improved understanding of diffusion within the brain after completion of CED infusions.21 Practical use of CED for distribution of micro dosages may not consider the questions of fluid flow and pressure responses that vary in different regions of the brain.22 Further engineering technology may address issues of tissue damage as a consequence of brain shift. Complications involved during bore hole craniotomy procedures, where air immediately rushes into the subdural space between brain and skull causing movement of the tissue relative to the skull.23,24
The electrode is implanted into the shifted brain and when the brain shifts back to its original position, the implanted electrode shifts with it, creating displacement of the electrode. A similar study based on 12 patients experiencing brain shift while considering effects on other treatments and future treatments was previously performed.24 Brain shift and subsequent electrode displacement and deformation may occur in all patients undergoing DBS as a treatment option. Brain shift may have greater detrimental effects on future treatments, especially those performed in the supine position and those administered with a rigid catheter instead of a flexible electrode with proposed infusion times measured in hours.24 A nonlinear poroelasticity-based treatment may confine the fluid flow and drug transport to the interstitial space.4 Microdialysis use may effectively target the major genes responsible for dopamine synthesis and processing and provide alternative options for gene delivery.25
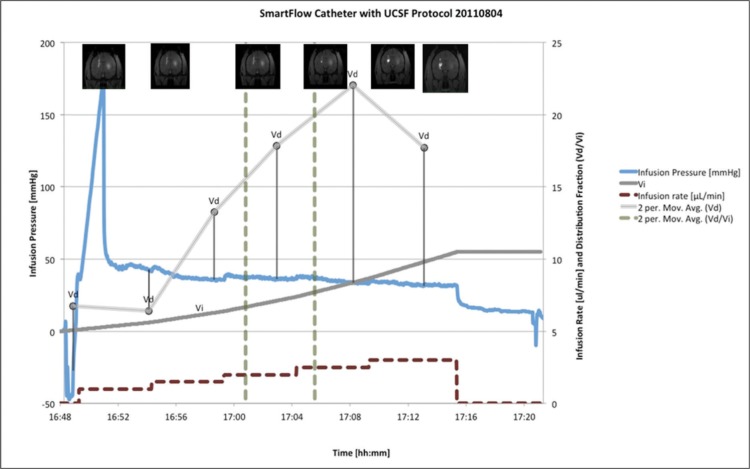
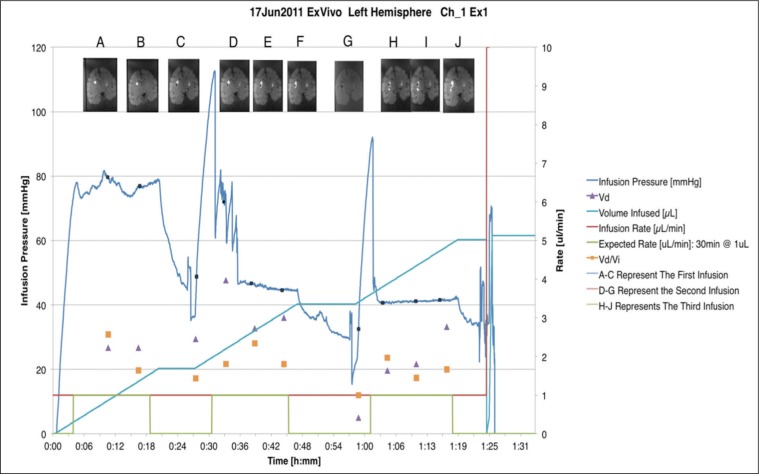
In our in vitro, ex vivo, and in vivo models, pressure readings correlated with changes in the infusion rate. Infusion pressure monitoring is of practical significance while detecting catheter endport occlusions, also known as initial infusion pressure spikes (figure 4). Also, it is helpful to identify possible glitches with the CED assembly line including leaks, air bubbles and improper pump setting. For example, the stylet may not have been retracted prior to the beginning of the second infusion, resulting in a higher pressure recording. In an agarose gel model experiment, abnormal pressure readings were detected where the ferrule had been found leaking.9,10 Also, pressure measurements are sensitive to air pockets within the line tubing and may result in performance deviations.9,10 Using pressure readings to detect real-time changes in infusion progress may eventually allow closed-loop feedback systems to be employed to maximize infusion rates while maintaining optimal infusate distribution.
Fig. 4:
SmartFlow catheter with UCSF Protocol
Fig. 5:
Ex vivo infusion pressure using VT catheter
In vivo animal models have been used for investigating both the progression of PD and treatment efficacy. When gel and ex vivo models are not sufficient, modeling the disease in animals allows researchers to better understand the underlying mechanisms of neuron degeneration helpful in finding novel approach to control and reverse the progression. The introduction of gene vectors into animal models and determining the risks, benefits, and efficacy of therapeutic agent will pave the way for human clinical trials. NHP models are of substantial significance for understanding of disease pathophysiology mechanisms leading towards potential therapeutic treatment.15, 26
Conclusion
We detected a higher Vd/Vi ratio in the in vivo subjects than in the ex vivo. It is theorized that the difference in Vd/Vi measurements between ex vivo and in vivo tissues could be explained by the extra cellular space volume fraction. After cell death, the extra cellular space is reported to decrease due to natural decay and dehydration resulting in stiffer brain tissue. Studies evaluating backflow and morphology using in vivo tissue as a medium are recommended. Furthermore, the study is limited by the smaller volume of brain tissue in non-human primates, suggesting the results might differusing larger infusate volumes in human brains. These results are consistent with an emerging understanding of the role of the perivascular pump in CED. Further investigation is warranted to evaluate the role blood pressure and heart rate may play in human CED clinical trials.
The efficacy of pharmacological and non-pharmacological neuroprotective therapeutic agents could be enhanced significantly by adopting neuroimaging practices as substitute. Recent developments in the field of neuroprotective mediated therapeutic interventions using gene-based therapy to modify the progression of PD have been discussed in a comprehensive review.13 The researchers are engaged in developing new strategies by employing emerging animal models of transgene viral vectors, target validation of CED with MRI, and testing efficacy of novel therapeutic agents using new designs of clinical trials.27,28
Acknowledgements
We acknowledge the Kinetics Foundation (Los Altos, CA) for financial support, Therataxis (Baltimore, MD), and Engineering Resources Group (Pembroke Pines, FL) for scientific and technical support. Special thanks are due to Dr. Robert J Dempsey, Chairman, Department of Neurological Surgery, for constant encouragement, support and facility in the laboratories.
Footnotes
The article complies with International Committee of Medical Journal editor’s uniform requirements for manuscript.
Conflict of Interests: None
Source of funding: Kinetics Foundation
References
- 1.Morrison PF, Laske DW, Oldfield EH et al. High-flow microinfusion: tissue penetration and pharmacodynamics. Am. J. Physiol. 1994;266(1 Pt 2):R292–305. doi: 10.1152/ajpregu.1994.266.1.R292. [DOI] [PubMed] [Google Scholar]
- 2.Morrison PF, Chen MY, Oldfield EH et al. Focal delivery during direct infusion to brain: role of flow rate, catheter diameter, and tissue mechanics. Am. J. Physiol. 1999;277:R1218–29. doi: 10.1152/ajpregu.1999.277.4.R1218. [DOI] [PubMed] [Google Scholar]
- 3.Hadaczek P, Bankiewicz K, Tamas L et al. The perivascular pump driven by arterial pulsation is a powerful mechanism for the distribution of therapeutic molecules within the brain. J. YMTHE. 2006;04007:4C. doi: 10.1016/j.ymthe.2006.02.018. [DOI] [PMC free article] [PubMed] [Google Scholar]
- 4.Raghavan R, Brady M. Predictive models for pressure-driven fluid infusions into brain parenchyma. Phys. Med. Biol. 2011;56:6179–6204. doi: 10.1088/0031-9155/56/19/003. [DOI] [PMC free article] [PubMed] [Google Scholar]
- 5.Bobo RH, Laske DW, Oldfield EH et al. Convection-enhanced delivery of macromolecules in the brain. Proc. Natl. Acad. Sci. USA. 1994;91:2076–80. doi: 10.1073/pnas.91.6.2076. [DOI] [PMC free article] [PubMed] [Google Scholar]
- 6.Ratliff JK, Oldfield EH. Convection-enhanced delivery in intact and lesioned peripheral nerve. J. Neurosurg. 2001;95:1001–11. doi: 10.3171/jns.2001.95.6.1001. [DOI] [PubMed] [Google Scholar]
- 7.Sillay K, Hinchman A, Akture E et al. Convection enhanced delivery to the Brain: preparing for gene therapy and protein delivery to the Brain for functional and restorative Neurosurgery by understanding low-flow neurocatheter infusions using the Alaris® system infusion pump. Annals of Neurosciences. 2013;2013;20(2):52–58. doi: 10.5214/ans.0972.7531.200205. [DOI] [PMC free article] [PubMed] [Google Scholar]
- 8.Schomberg D, Wang A, Marshall H et al. Ramped-rate vs continuous-rate infusions: An in vitro comparison of convection enhanced delivery protocols. Annals of Neurosciences. 2013;20(2):59–64. doi: 10.5214/ans.0972.7531.200206. [DOI] [PMC free article] [PubMed] [Google Scholar]
- 9.Sillay K, Schomberg D, Hinchman A et al. Benchmarking the ERG Valve tip and MRI interventions Smart Flow neurocatheter convection-enhanced delivery system’s performance in a gel model of the brain: employing infusion protocols proposed for gene-based therapy for Parkinson’s disease. J. Neurol. Eng. 2012a;9 doi: 10.1088/1741-2560/9/2/026009. [DOI] [PubMed] [Google Scholar]
- 10.Sillay K, Hinchman A, Kumbier L et al. Strategies for the delivery of multiple collinear infusion clouds in convection-enhanced delivery in the treatment of Parkinson’s disease. Stereotact Funct Neurosurg. 2013;91(3):153–61. doi: 10.1159/000345270. [DOI] [PubMed] [Google Scholar]
- 11.Richardson RM, Kells AP, Oldfield EH et al. Interventional MRI-guided putaminal delivery of AAV2-GDNF for a planned clinical trial in Parkinson’s disease. Mol. Ther. 2011;19:1048–1057. doi: 10.1038/mt.2011.11. [DOI] [PMC free article] [PubMed] [Google Scholar]
- 12.Emborg ME, Joers V, Alexander A et al. Intra-operative intracerebral MRI-guided navigation for acurate targeting in non-human primates. Cell Transplant. 2010;2010;19:1587–97. doi: 10.3727/096368910X514323. [DOI] [PMC free article] [PubMed] [Google Scholar]
- 13.Miranpuri GS, Kumbier L, Hinchman A et al. Gene-based therapy of Parkinson’s Disease: Translation from animal model to human clinical trial employing convection enhanced delivery. Annals of Neurosciences. 2012;17(3):133–146. doi: 10.5214/ans.0972.7531.190310. [DOI] [PMC free article] [PubMed] [Google Scholar]
- 14.Bensadoun RJ, Deglon N, Aebischer P et al. Lentiviral vectors as gene delivery system in the mouse midbrain cellular and behavioral improvements in a 6-OHDA model of Parkinson’s disease using GDNF. Exp. Neurol. 2000;164:15–24. doi: 10.1006/exnr.2000.7409. [DOI] [PubMed] [Google Scholar]
- 15.Kordower JH, Emborg ME, Marina E et al. Neurodegeneration prevented by lentiviral vector delivery of GDNF in primate models of Parkinson’s disease. Science. 200;290(5492):767–773. doi: 10.1126/science.290.5492.767. [DOI] [PubMed] [Google Scholar]
- 16.Kordower JH, Bloch J, Aebischer P et al. Lentiviralgene transfer to the nonhuman primate brain. Exp. Neurol. 1999;160:1–16. doi: 10.1006/exnr.1999.7178. [DOI] [PubMed] [Google Scholar]
- 17.de Almeida LP, Deglon L, Zala D et al. Neuroprotective effect of a CNTF-expressing lentiviral vector in the quinolinic acid rat model of Huntington disease. Neurobiol. dis. 2001;8:433–48. doi: 10.1006/nbdi.2001.0388. [DOI] [PubMed] [Google Scholar]
- 18.Raghavan R, Brady M, Rodríguez PMI et al. Convection-enhanced delivery of therapeutics for brain disease, and its optimization. Neurosurg. Focus. 2006;20(4): doi: 10.3171/foc.2006.20.4.7. [DOI] [PubMed] [Google Scholar]
- 19.Raghavan R, Brady M, Chen Z et al. Quantifying Fluid Infusions and Tissue Expansion in Brain. doi: 10.1109/TBME.2011.2128869. IEEE Trans Biomed Eng. 2011;58(8) doi: 10.1109/TBME.2011.2128869. [DOI] [PubMed] [Google Scholar]
- 20.Emborg ME, Moirano J, Raschke J et al. Response of aged parkinsonian monkeys to in vivo gene transfer of GDNF. Neurobiol. Dis. 2009;36:303–311. doi: 10.1016/j.nbd.2009.07.022. [DOI] [PMC free article] [PubMed] [Google Scholar]
- 21.Sampson JH, Brady M, Friedman AH et al. Colocalization of gadolinium-diethylene triamine pentaacetic acid with high-molecular-weight molecules after intracerebral convection-enhanced delivery in humans. Neurosurgery. 2011;69:668–67629. doi: 10.1227/NEU.0b013e3182181ba8. [DOI] [PMC free article] [PubMed] [Google Scholar]
- 22.Valles F, Fiandaca MS, Christine CW et al. Qualitative imaging of adeno-associated virus serotype 2-human aromatic L-amino acid decarboxylase gene-based therapy in a phase I study for the treatment of Parkinson disease. Neurosurgery. 2010;67:1377–1385. doi: 10.1227/NEU.0b013e3181f53a5c. [DOI] [PubMed] [Google Scholar]
- 23.van den Munckhof P, Contarino MF, Schuurman PR et al. Postoperative curving and upward displacement of deep brain stimulation electrodes caused by brain shift. Neurosurgery. 2010;67:49–53. discussion 53–44. doi: 10.1227/01.NEU.0000370597.44524.6D. [DOI] [PubMed] [Google Scholar]
- 24.Sillay KA, Kumbier LM, Ross C et al. Perioperative brain shift and deep brain stimulating electrode deformation analysis: implications for rigid and non-rigid devices. Annals of Biomedical Engineering. 2013;41(2):293–304. doi: 10.1007/s10439-012-0650-0. [DOI] [PMC free article] [PubMed] [Google Scholar]
- 25.Lewis TB, Glasgow JN, David TC et al. Transduction of brain dopamine neurons by adenoviral vectors is modulated by CAR expression: rationale for tropism modified vectors in PD gene-based therapy. PLoS One. (5) 2010;17(9):12672. doi: 10.1371/journal.pone.0012672. [DOI] [PMC free article] [PubMed] [Google Scholar]
- 26.Dass B, Kladis T, Chu Y et al. RET expression does not change with age in the substantianigra pars compacta of rhesus monkeys. Neurobiol. Aging. 2006;27:857–861. doi: 10.1016/j.neurobiolaging.2005.04.002. [DOI] [PubMed] [Google Scholar]
- 27.Fiandaca MS, Forsayeth JR, Dickinson PJ et al. Image-guided convection-enhanced delivery platform in the treatment of neurological diseases. Neurotherapeutics: the journal of the Amer. Soc. Expl. Neuro. Therapeutics. 2008;5:123–127. doi: 10.1016/j.nurt.2007.10.064. [DOI] [PMC free article] [PubMed] [Google Scholar]
- 28.Rosenbluth KH, Bankiewicz KS, Bringas J . J Mag Res Imaged. Wiley Periodicals, Inc.; 2012. Evaluation of Pressure-Driven Brain Infusions in Nonhuman Primates by Intra-operative 7 Tesla MRI. [DOI] [PMC free article] [PubMed] [Google Scholar]


