Abstract
Background
The electrical properties of agarose gel, namely impedance and capacitance, are relatively unexplored. Agarose gels are used as in vitro models in studies across numerous disciplines, including imaging, radiotherapy, infusion, and neurosurgery.
Purpose
In this study, we seek to characterize the impedance response of low concentration agarose gels by relating the gel concentrations to Nyquist Plot phase in order to establish a baseline with which to modify the response of the gel to simulate that of in vivo brain tissue. This information is relevant to areas such as deep brain stimulation, and could have a significant impact on in vitro model design for such studies in the future.
Methods
Ten agarose gels spanning four different concentrations were subjected to impedance spectroscopy using a Model 3387 DBS electrode. Phase angles were calculated and Cartesian Nyquist plots generated from the data.
Results
Results suggest that an inverse relationship exists between agarose gel concentration and phase angle. In addition, the results indicate that agarose gel reasonably emulates a constant phase element, which portrays the electrode-electrolyte interface impedance of some equivalent circuit models of brain tissue.
Conclusion
The data shows that agarose gel is a suitable substrate for a deep brain stimulation in vitro model, but requires modification. In the future, we plan to utilize this data to determine the modifications necessary in the current agarose gel model to make it scientifically applicable to studies of both deep brain stimulation and infusion due to their overlapping variables.
Keywords: Agarose gel, Impedance, Resistance, Reactance, Deep Brain Stimulation, Brain infusion, In vitro model, Phase angle, Nyquist Plot, Electrode
Introduction
Agarose gels are used as in vitro models in studies across numerous disciplines, including imaging,1 radiotherapy, infusion, and neurosurgery.2 Low concentration agarose gel, between 0.2% and 0.6%, has been employed as an in vitro model of the physical characteristics of the human brain, partly because they have been shown to accurately emulate the poroelasticity of the brain, a primary factor in its usefulness as a model for infusion studies.3,4 However, a few have attempted to characterize the electrical properties of such gels, such as impedance, the opposition of a material to current flow, or capacitance, the ability of a material to store charge. These electrical properties are poised to significantly impact bench and clinical restorative neuroscience areas such as Deep Brain Stimulation (DBS). Agarose gel has been neglected until now as a possibility for DBS studies, possibly due to the idea that they best served infusion studies, and that in vivo methods are considered most conclusive for DBS studies. As previously available neurostimulators have demonstrated, knowing the impedance of an implanted electrode and its electrical interaction with the surrounding tissue, in this case through the relationship between voltage-controlled stimulation and impedance, is important to patient safety.5 Investigators are actively utilizing in vitro models of the brain to characterize electrode impedance response; however, current models for studies involving capacitance and impedance recapitulate electrical features but not physical features of the brain, such as poroelasticity. Wei and Grill as well as Mercanzini et al. used phosphate buffered saline (PBS) solutions as the in vitro model for their impedance measurements on DBS electrodes.6, 7 Gimsa et al used an electrolyte solution with other culture media such as fetal calf serum to compare the impedance responses of different rat DBS electrodes.8 Some models are not in vitro and instead purely mathematical. For example, Bedard and Destexhe created a mathematical model for measurements of the brain that does not rely on the assumption of resistive uniformity in extracellular medium, an assumption they argued is invalid.9 Some are difficult to describe as in vitro, such as the computer-simulated axisymmetric finite-element model (FEM) used by Butson et al. to evaluate the effects of varying tissue properties on the DBS electrode-tissue interface impedance and the volume of tissue activated (VTA).10 In vitro gel models that do exist for the purpose of impedance measurement still rely to some extent on the use of live tissue. Frampton et al used an alginate hydrogel culture containing LRM55 astroglial cells to characterize the reactive cellular response of brain tissue.11 All of these models address impedance and capacitive elements but fail to incorporate the physical elements of the brain, primarily poroelasticity, portrayed so well by low concentration agarose gels.
We surmise that low concentration agarose gels could be modified to serve as a more complete in vitro model of the brain, incorporating both physical and electrical characteristics. The first objective of this study is to characterize the impedance response of low concentration agarose gels in order to establish a precedence, or baseline, for its eventual modification into a comprehensive model. Stated differently, we must understand the electrical properties of agarose gel in order to discover what must be changed or added to make the model scientifically viable for studies involving electrical properties of the brain. The creation of a more complete in vitro model would be valuable, allowing for studies to draw more realistic correlations between the model and brain tissue, increasing the accuracy and potential real-world application of these studies. Such a model lies in the domain of future work, and hence its overview has been confined to the discussion.
In order to characterize the impedance of agarose gel, three scientifically and medically relevant low concentrations (0.1%, 0.2%, 0.6%) and one higher outlying concentration (2%) were selected and analyzed with impedance spectroscopy using a DBS electrode to generate Cartesian Nyquist plots. Nyquist plots graph negative reactance, or imaginary impedance, on the y-axis and resistance, or real impedance, on the x-axis with increasing frequency toward the origin. Overall impedance can be calculated using a2 + b2 = c2, where a and b are imaginary and real impedance in ohms, and c is overall impedance in ohms. The phase of each plot, or the angle between the x-axis and a linear best fit of the data, was calculated in order to investigate the mathematical relationship between phase and agarose gel concentration, if any. This is the second objective of this study. Recording the phase also provides a measure with which to judge significant differences in the Nyquist plots of the different gel concentrations. A mathematical relation between phase and gel concentration would be very useful in comparing other in vitro models to agarose gel. A Nyquist plot can be generated using impedance spectroscopy for a given material or tissue in vivo, and the phase could then be correlated to a specific agarose gel concentration for use as an in vitro model. Such a relationship would be useful to any study wishing to use a simple and economical agarose in vitro impedance model in place of a material or tissue that is expensive to cultivate, produce, or, for whatever reason, difficult to use.
Nyquist plots have precedence in the characterization of impedance measured from a DBS electrode. Gimsa et al used a Nyquist plot to characterize the impedance response in vitro of an S75-Pt/Ir electrode in various salt solutions.8 Williams et al. utilized Nyquist plots to characterize the impedance response of rat brain tissue in vivo over a number of days using tungsten electrode arrays.12 Lempka et al. used Nyquist plots to describe the impedance response of DBS electrodes in the thalami of rhesus macaque (Figure 11) and in various equivalent circuit models they constructed (Figure 10).13 In this study, Cartesian Nyquist plots will be used to characterize the impedance response of varying agarose gel concentrations using a Medtronic model 3387 DBS electrode.
Fig. 11:
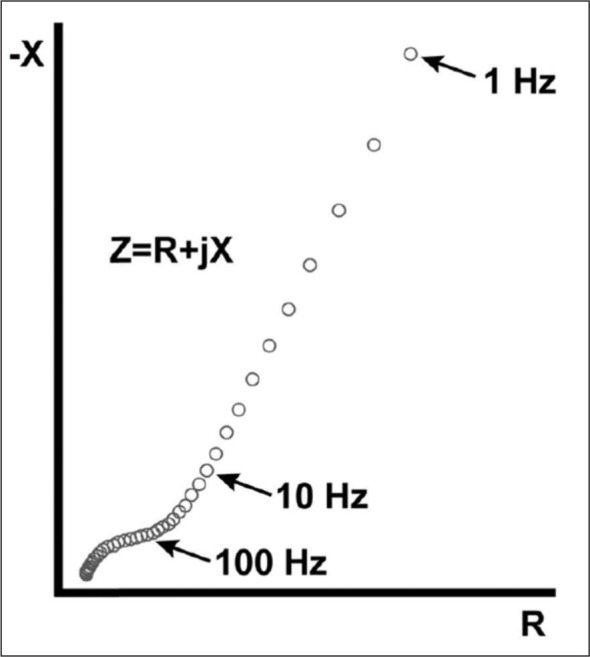
Nyquist plot showing the impedance response of the brain of rhesus macaque (Lempka et al., 2009).
Fig. 10:
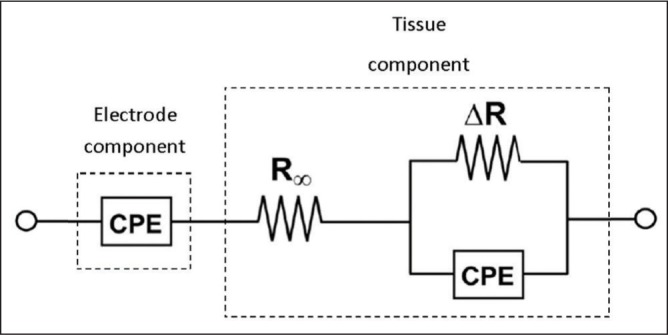
Adapted from Lempka et al. (2009), this is a diagram of the equivalent circuit model determined to produce an impedance response that closely matched in vivo impedance spectroscopy data on the brain of rhesus macaque. The CPE models the electrode component, while the rest of the circuit models the tissue component. Together, they produce a curve similar to that seen in Figure 11.
Methods
Three 0.1% agarose gels, three 0.2% gels, three 0.6% gels, and one 2% gel were prepared using a procedure previously described in appendix A of Sillay et al. (2012) by changing the amount of agarose powder added. Gels were stored in a refrigerator for 24 hours prior to testing. 1X PBS solution (0.0067M PO4 ) was also prepared as a control. A Medtronic (MSP, MN) model 3387 quadrapolar deep brain stimulating electrode was implanted into the gel, the geometry for which can be seen in Figure 1 and Table 1. A Medtronic Nexframe Stereotactic System, mounted to a modified gel sample cover, was used to direct the electrode into the gel and provide stability (Figure 2). A two-electrode model was used with electrode 0 of the Medtronic electrode as the working electrode and a tin-coated copper wire as the reference electrode, depicted in Figure 3 and Figure 4. The two-electrode method of measurement is well established in a number of research studies on DBS, and hence was repeated here.6,12–14 Measurements of real impedance and reactance were taken immediately after implantation using an AUTOLAB Potentiostat/Galvanostat 12 at 30 frequencies varying from 10 Hz to 100 kHz logarithmically by applying a 25 m V sine wave. These measurements were repeated 10 times for each gel and the PBS. A statistical power analysis was performed on pilot work with the gels (not shown) using an online application and it was determined that seven trials for each concentration would be necessary to reach a power of at least 80%; the number of trials for each concentration in this study well exceeds this amount.15
Fig. 1:
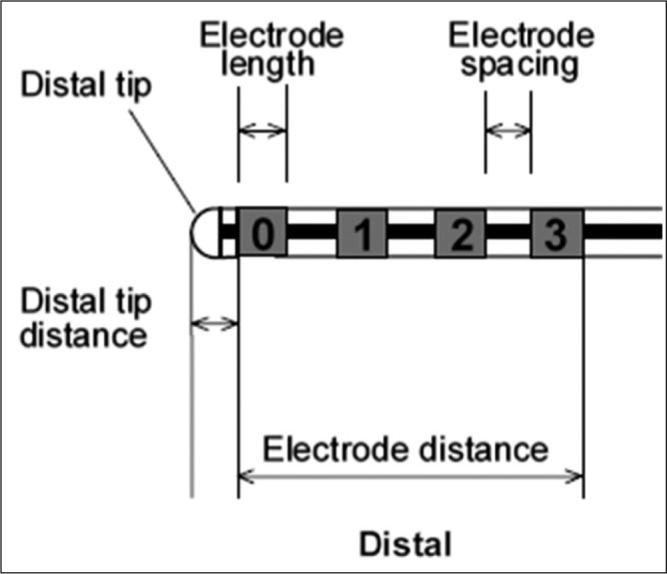
Distal end of the Medtronic Model 3387 DBS electrode, taken from the manual (Medtronic, 2010). All measurements were taken using the electrodes marked by the numbers in this figure.
Table 1: Device specificationsa for lead Models 3387 and 3389.
| Description | Model 3387 | Model 3389 |
|---|---|---|
|
a All measurements are approximate. b Electrical resistance is proportional to lead length. | ||
| Connector | Quadripolar, in-line | Quadripolar, in-line |
| Shape | Straight | Straight |
| Conductor resistanceb | <100 Ω | <100 Ω |
| Length | 10–50 cm | 10–50 |
| Diameter | 1.27 mm | 1.27 mm |
| Distal end Number of electrodes Electrode shape Electrode length Electrode spacing Electrode distance Distal tip distance |
4 Cylindrical 1.5 mm 1.5 mm 10.5 mm 1.5 mm |
4 Cylindrical 1.5 mm 0.5 mm 7.5 mm 1.5 mm |
| Proximal end Lead contact length Lead contact spacing Lead contact distance Stylet handle length |
2.3 mm 4.3 mm 16.6 mm 40.1 mm |
2.3 mm 4.3 mm 16.6 mm 40.1 mm |
Fig. 2:
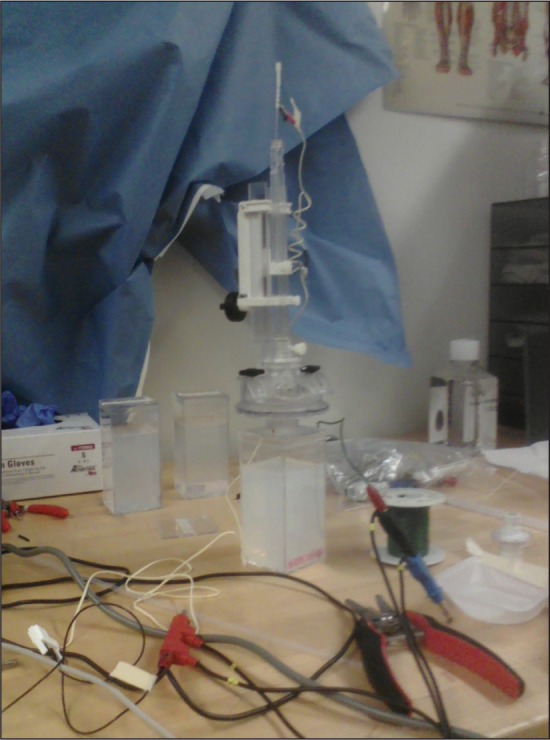
Depiction of the setup for impedance measurements. The gel sample is in a plastic container with a Medtronic Nexframe Stereotactic System mounted to the cover.
Fig. 3:
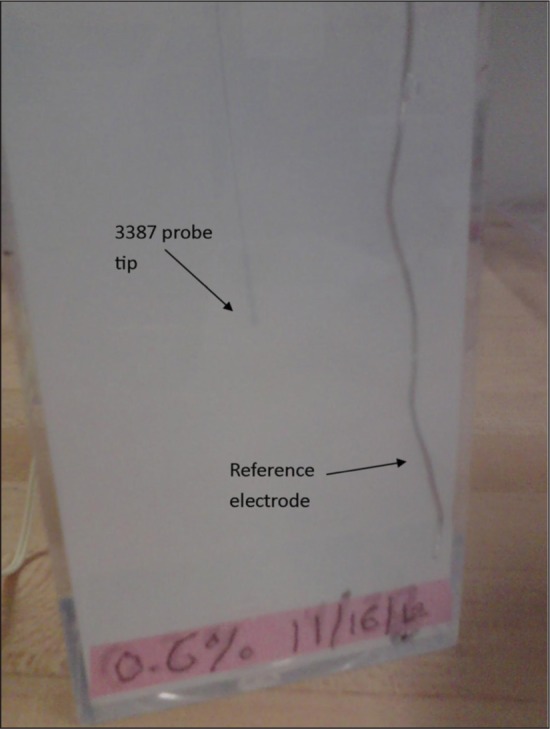
Depiction of electrode positioning for the impedance measurements between electrode 0 (the working electrode on the probe tip) and a ground wire (the reference electrode). Care was taken to ensure that the probe tip was inserted through the center of the gel sample while the ground wire was placed at a corner of the sample container.
Fig. 4:
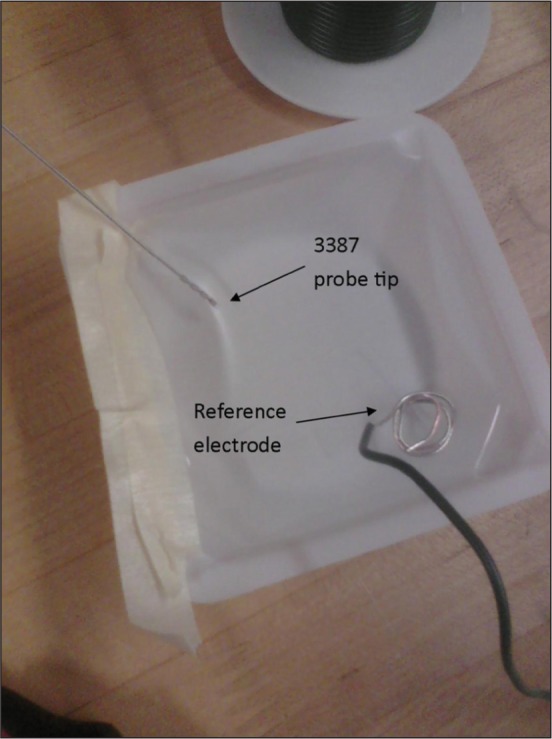
Depiction of impedance measurements between electrode 0 and a ground wire in PBS. Care was taken to ensure that the working electrode was suspended in PBS, not touching the weigh boat.
The same methods were also used to collect impedance data with electrode 0 as the reference electrode and electrode 1 as the working electrode. This data could have relevance in the operating room, where inter-electrode, or bipolar, impedance data are collected on DBS patients in this manner. 10 trials each of a 0.2% gel, a 0.6% gel, and the PBS were collected. The gels were refrigerated 72 hours prior to testing.
Nyquist plots were constructed in Microsoft Excel. For the measurements between electrode 0 and the ground wire, all trials for each gel concentration and the PBS were averaged for data analysis, consolidating the data, as seen in Figure 5.
Fig. 5:
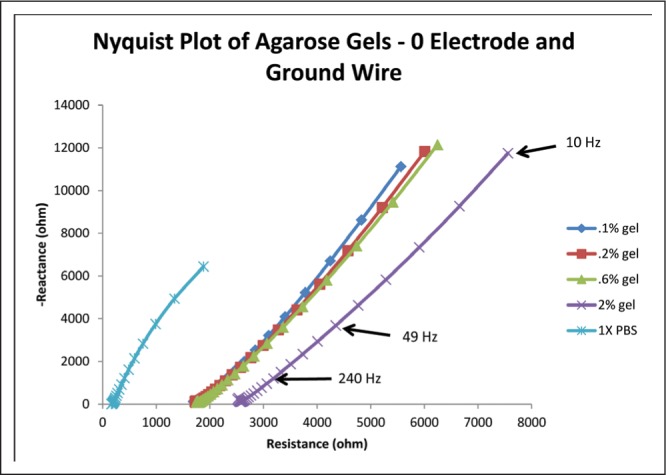
Graph of average impedance response of the gels and the PBS control between electrode 0 and a ground wire.
Excel was also used to produce linear best fit curve data for the Nyquist plots, from which phase and R2 were derived and collected. Phase is simply the angle between the x-axis and the line, and hence can be found by taking the inverse tangent of the slope.16 R2 data was collected using Excel. In addition, phase angle and agarose gel concentration were plotted against one another and best fit equations were derived (Figure 6 and 7).
Fig. 6:
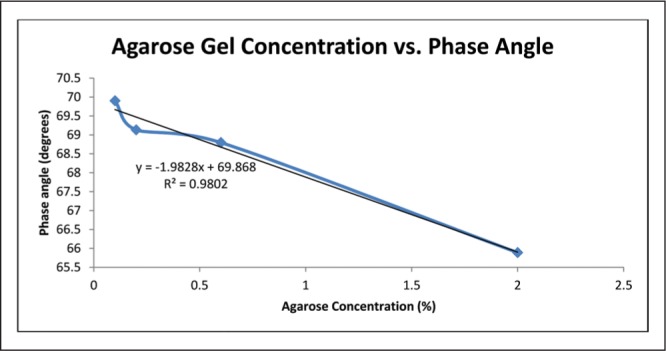
Graph of agarose gel concentration vs. phase with a linear best fit applied. Data for this graph utilized the impedance measurements between electrode 0 and a ground wire. Impedance measurements between electrode 0 and 1 were not included.
Fig. 7:
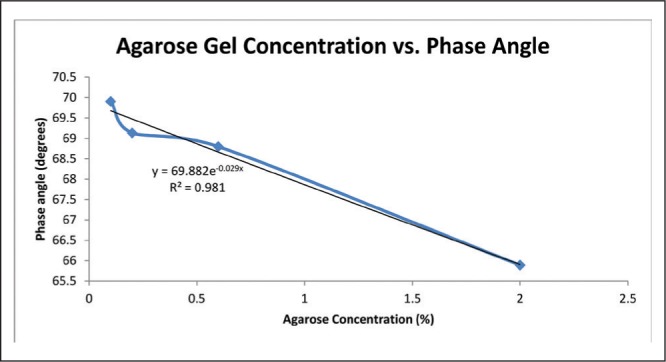
Graph of agarose gel concentration vs. phase with an exponential best fit applied. Data for this graph utilized the impedance measurements between electrode 0 and a ground wire. Impedance measurements between electrode 0 and 1 were not included.
The same process was used for the impedance measurements between electrodes 0 and 1, minus the plot of phase vs. gel concentration (Figure 8).
Fig. 8:
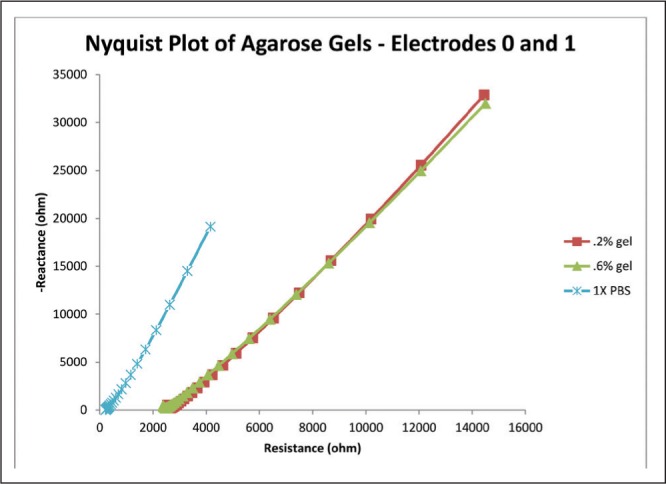
Graph of the average impedance response between electrodes 0 and 1 for the selected gels and the PBS control.
Results
Impedance between electrode 0 and ground wire (monopolar impedance)
As evidenced by Figure 5, resistance tends to increase with increasing agarose concentration for this monopolar measurement condition. The curves for the gels are fairly linear, except at high frequencies, when they appear to be more parabolic with positive concavity. Despite this, linear best fit lines for all agarose gel curves had R2 values above 0.99, indicating a very close fit. For contrast, the linear fit for the PBS had an R2 value of 0.987. The close linear fit of the gel curves suggests that the impedance response of agarose gel models a constant phase element, which is used to portray the electrode-electrolyte interface impedance in some equivalent circuit models of brain tissue. An explanation of this and its implications has been confined to the discussion.
As evidenced by Figure 6, as agarose concentration increases, phase angle decreases. Despite the anomaly at 0.2% agarose concentration, the linear fit for the data was quite close, with an R2 value above 0.98. This means that the equation of the fit line, y = − 1.9828x + 69.868, where x is agarose concentration in % and y is the phase angle in degrees, should be a relatively accurate mathematical relationship. For comparison, the phase angle of the averaged PBS trials was much higher at 76.138 degrees.
Impedance between electrodes 0 and 1 (bipolar impedance)
Evidenced by Figure 8, the curves for the gel concentrations closely match and are difficult to distinguish. Again, the curves for the gels have a close linear fit, with R2 values above 0.996. For contrast, the linear fit for the PBS had an R2 value of 0.9952.
Phase angles for the 0.2% gel and the 0.6% gel were 69.565 and 68.79 degrees, resp ectively. Phase angle for the PBS was higher at 78.054 degrees.
Discussion
Impedance between electrode 0 and ground (monopolar impedance) and equivalent circuit models
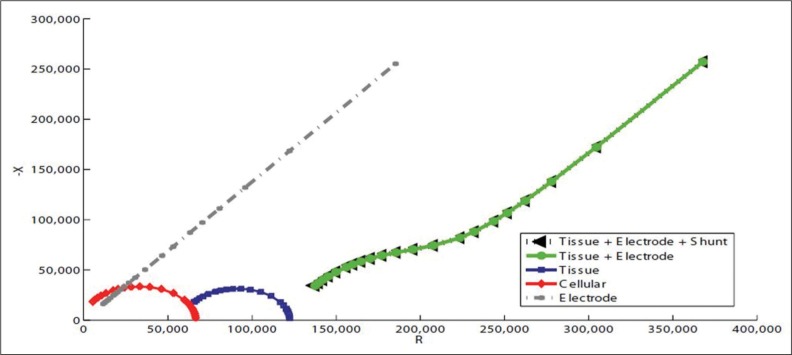
When discussing DBS, there are two primary sources of impedance that contribute to the impedance response of the brain. The electrode-electrolyte interface impedance, commonly shortened to “electrode impedance,” is characterized by a linear Nyquist plot. The tissue impedance is characterized by a parabolic curve with negative concavity close to the origin. Putting these two sources together yields a curve that is parabolic at high frequencies and linear at lower frequencies (Figure 9). It is this curve that is considered to be an accurate portrayal of the impedance response of the brain. The “cellular” impedance response will be ignored for the purposes of this discussion as it is considered to be part of the tissue impedance response.12
Fig. 9:
Taken from Williams et al. (2007), this Nyquist Plot depicts the electrode and tissue components of the overall brain impedance response. Note the similarity between the “tissue + electrode” curve and Figure 11.
In order to characterize the brain’s impedance response without resorting to in vivo methods, many studies develop or use equivalent circuit models in hardware17 or software,10 which utilize capacitive and resistive elements configured to produce a realistic impedance model of the brain. Figure 10 depicts the circuit model deemed most accurate of the ones tested by Lempka et al.13 CPE stands for “constant phase element,” which is simply a linear Nyquist plot, exactly like the “electrode” curve in Figure 9. Therefore, it makes sense that a CPE is all that is required to model the electrode impedance. This is why the linear nature of the agarose gels in this experiment is significant. Agarose gels reasonably model CPEs, which means that agarose gels alone reasonably model the electrode-electrolyte interface impedance. For the development of a comprehensive in vitro model, encompassing the physical and electrical characteristics of the brain, the agarose gels need merely be modified to include the tissue component as well. Discussion of this research element has been confined to the future work section.
Mathematical relation of phase and concentration
The linear nature of the relationship between agarose concentration and phase allows for the proper selection of an agarose gel concentration as an in vitro model for an in vivo material based on its phase angle. Assuming that the in vivo material has a fairly linear Nyquist plot under testing conditions similar to those of this experiment, the appropriate concentration of agarose gel could be subbed in its place using the equation. The phase angle for the 0.2% gel was lower than expected, and is the only point that skews an otherwise linear curve (Figure 6). It is also possible that the curve is actually asymptotic and the phase for 0.6% gel was higher than it should be. An exponential best fit was applied to the data to test this possibility, and a slightly higher R2 value was achieved, but upon observation of the graph, the fit line still appears linear (Figure 7).Using only four concentrations of gel provided a few data points with which to characterize phase based on concentration, so the true nature of any supposed relationship is still unanswered. The mathematical relation between phase and agarose concentration deserves further exploration. Sufficient evidence is provided here supporting the trend of decreasing phase angle with increasing agarose concentration, but more concentrations should be involved in future work in order to more accurately define the relationship.
It is interesting to note the decreasing phase as resistance increases. Observing Figure 5, the phase angle for the PBS is about 76 degrees, the highest phase angle on the chart. As we move laterally toward the remaining curves, we see that as the resistance is increasing, the phase angle is decreasing, with 2% gel measuring about 66 degrees. The 0.1%, 0.2%, and 0.6% gels are clustered around 69–70 degrees, but Figure 6 shows that they still follow the trend just described. This suggests that agarose gel concentrations have a relationship with both phase angle and resistance, which brings to light another identifying factor for differentiating agarose gels.
Impedance between electrodes 0 and 1 (bipolar impedance)
Although the gel impedance response under this bipolar measurement condition was also linear in nature with comparable phase angles, Figure 13 reveals that impedance under this measurement condition was larger than that of the monopolar measurement condition. This finding is in agreement with previous work concerning bipolar vs. monopolar impedance.5,10 Because current travels through very little of the gel (electrodes 0 and 1 are only 1.5 mm apart), this would imply that the impedance of the electrode material itself is higher than that of agarose gel since bipolar impedance was larger. However, there are many other factors to consider before drawing this conclusion, including the conductivity of the reference electrode in the monopolar measurement condition, conductivity of the leads in both measurement conditions, previous usage of the electrode in other trials, and the volume of gel material affected when the current passed in both measurement conditions. These electrodes are designed to be nonresistant to current, so it seems very likely that one or more of these factors may be significantly skewing the results. It is hypothesized that one of the most significant factors contributing to the low resistance of the monopolar measurement condition is the high amount of surface area of the reference electrode in contact with the gel material (Figure 3). By allowing more paths for current to travel, this could significantly lower the impedance of the monopolar condition. Even though the findings agree with previous works, more research is warranted before any conclusions can be drawn about the impedance of the electrode itself compared to agarose gel.
Fig. 13:
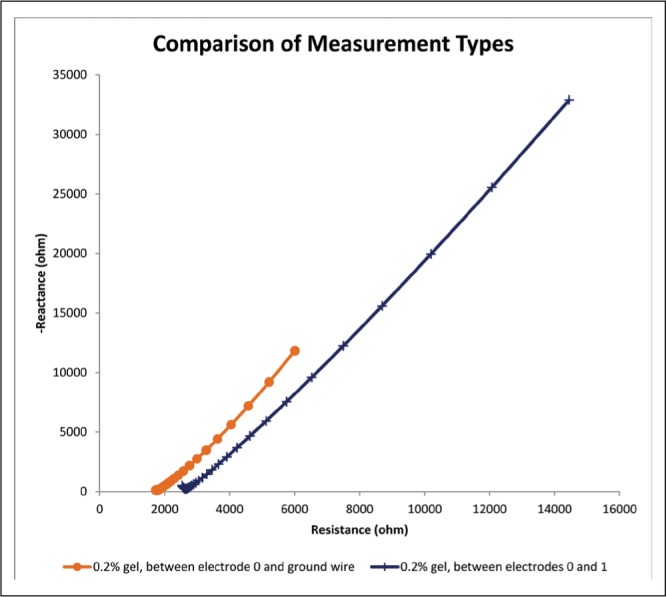
This graph depicts impedance spectra for 0.2% gels in both measurement conditions. Notice the much higher magnitudes of both resistance and reactance in the bipolar measurement condition as compared to the monopolar measurement condition.
Limitations
Much research on the impedance response of electrodes in brain tissue has been performed and is in agreement that impedance and resistance generally decrease with increasing frequency to a point and that clinically relevant impedance measurements at around 130 Hz vary from 500 to 1500 ohms. 5,6,12,13,14 Results from this experiment for the gels at 127 Hz fall at least 1000 ohms above that range, depending on agarose concentration and the measurement condition. PBS, for the impedance measurements between electrodes 0 and 1, read 821 Hz, which highlights why it is currently a common in vitro model for DBS. Variations in the impedance measured can be explained by a number of factors including frequency range of the data, the model used, the electrodes used, the method of measurement, and the time duration of the experiment. More research is warranted to determine how the impedance of agarose gel can be lowered to more clinically relevant levels, but it is surmised that methods described in the future work section for introducing the “tissue” component to the gel may lower impedance as a side effect.
It has been noted that the impedance of chronically implanted electrodes greatly increases within a few days after implantation in vivo. Lempka et al, Williams et al. attribute this to changes in the tissue surrounding the electrode.12,13 The immune response designates the electrodes as foreign to the body. As a result, a dense, fibrous, more resistive tissue begins to encase the electrodes, increasing the impedance. In the comprehensive model, this increase in impedance over time should be able to be modeled by increasing or decreasing the concentrations of any additives to the agarose gel that give it the accurate impedance response. That way, electrodes can be tested indirectly at the higher impedances characteristic of chronically implanted electrodes. Yet, since agarose does not have an immune response, electrodes implanted over time cannot be directly tested with an agarose model, which presents a significant limitation.
Relevance and Comparisons to Other Work
In order to assess the comparability between this study and other disparately sized electrode studies, electrode surface areas and overall impedance measurements at 1 kHz were assessed. Electrode surface area for this macroelectrode study is about 5.99 square millimeters (Medtronic 3387 DBS electrode, 1.5 mm, 1.27 diameter), calculated using data from Figures 1 and 2. This calculation is shown in Equation Set 1. Overall impedance at 1.172 kHz was 3186.27 ohms for the bipolar measurement condition and 1964.64 ohms for the monopolar measurement condition (calculated via Pythagorean theorem from Figure 13). For Williams et al. the microelectrode surface area in contact with the S1 cortical barrel region of the rat brain varied from 0.112 square millimeters to 0.143 square millimeters, depending on the depth of insertion. 12,18 This calculation is shown in Equation Set 2. In vivo microelectrode impedance measured around 100,000 ohms at 1 kHz immediately after implantation.12 For Lempka et al. the microelectrode surface area in contact with the ventral thalamus and subthalamic nucleus of the rhesus macaque brain was about 1.18 square millimeters.13 This calculation follows the same logic as Equation Set 1 and hence is not shown. In vivo impedance measured about 3500 ohms at 1 kHz immediately after implantation. The impedance per unit area for each study was calculated as a comparative measure, which was 532.4 ohms/square millimeter for this study if we consider the bipolar condition, about 698,000 ohms/square millimeter for Williams et al. if we assume that maximum surface area is in contact with the brain, and about 2971 ohms/square millimeter for Lempka et al.12,13 These data are more succinctly reported in Table 2. These numbers are vastly different, but a number of factors contribute to this. First, microelectrode arrays were used in Williams et al. a completely different electrode type. Lempka et al. is much more comparable to this study possibly due to their use of a scaled down clinically relevant electrode, similar to this study’s Medtronic model 3387 in material but not in size. It is interesting to note that despite their different sizes, the measured impedances for these two electrode types are very comparable, especially if we consider that the 3186.27 ohms reported for this experiment is a low estimate of 1 kHz impedance because it was actually taken at 1.172 kHz. Also, it is already known that agarose gel by itself is not an accurate model for the brain’s electrical characteristics, so it is difficult to compare this study to study done by Williams et al. or Lempka et al. due to their use of rat brain and monkey brain, respectively. Location within the brain could have a substantial effect as well; in vivo brain tissue is not homogenous like agarose, and hence could exert different impedance values depending on location and/or insertion depth. Lastly, the arrays used in Williams et al. (2007) were made of tungsten wires, while the 3387 electrodes and custom electrodes used by Lempka et al. (2009) are Platinum-Iridium. This could have substantially contributed to the lower impedances observed in this study and in Lempka et al. (2009) since Pt-Ir electrodes are known to offer less resistance to current than tungsten (Science Products).
Table 2: A summary of impedance comparisons between this study and others.
| Reference | Electrode Type | Mammal and insertion location | Contact surface area (mm2) | 1 kHz impedance (ohms) | Impedance/unit surface area (ohms/mm2) |
|---|---|---|---|---|---|
| Williams et al. (2007) | Microelectrode tungsten array | Hooded Long Evan Rat: S1 cortical barrel | 0.112–0.143 | ≈100,000 | 698,000 (if maximum contact surface area) |
| Lempkaet al. (2009) | custom Pl/Ir microelectrode | Rhesus macaque: ventral thalamus and subthalamic nucleus | 1.18 | ≈3500 | 2971 |
| This work | Medtronic model 3387 | Agarose | 5.99 | (@ 1.172 kHz) 3186.27 (bipolar) | 532.4 |
A significant obstacle in comparing DBS electrode studies of this nature is the issue of frequency, its relation to the measurements being performed, and the variants of these measurements in different materials. A “stereotypical” brain impedance response, as displayed by Figure 11 or by the “tissue + electrode” curve of Figure 9, is characterized by a parabolic curve with negative concavity at high frequencies and a straight line with positive slope at low frequencies. However, this curve may not be displayed if one selects a frequency range outside of or overlapping with the range in which this response occurs. This “ideal” range in which the desired response occurs can vary greatly with the medium being tested. For example, in Williams et al. (2007), this ideal range was 100-2000 Hz in the rat brain. In Lempka et al. (2009), this ideal range was much wider, spanning from 1 Hz to 10 kHz. This makes it difficult to compare the studies based on measurements at a given frequency, and further complicates the issue of the relevance of such studies in humans, whether in vitro or in vivo.
Future Work
In this study, we establish a baseline, or control, for the impedance response of simple agarose gels. In subsequent work, we plan to modify these gels so that their Nyquist plot data resembles that of the monkey brain tissue found in Lempka et al., Figure 11).13 Characterization of monkey brain tissue can be reasonably extrapolated to human brain tissue, so Lempka et al. provides a “goal” for the Nyquist plots of our agarose gels. Notice the similarity between Figure 11 and the “tissue + electrode” curve of Figure 9. If the agarose gel Nyquist plots can be made by whatever additives to match those of the monkey brain by introducing the tissue component, it can be reasonably inferred that a comprehensive model has been formed as long as the poroelasticity of the model has not been compromised by any additions to the gel.
The presence of this comprehensive model could be useful to both infusion and DBS studies, each of which currently have their own in vitro models with characteristics tailored to their purposes rather than to the mammalian brain. Although not seemingly related to infusion and not included in current in vitro infusion models, the electrical impedance of brain tissue could affect the design of infusion equipment and protocols of the future. Infusate distributions, depending on the structure and polarity of the infusate, may be affected by electrical charge in the brain in addition to poroelasticity, a phenomenon that a comprehensive model could characterize on top of typically studied infusion parameters such as infusion pressure and backflow along the catheter. Concerning DBS, the poroelasticity and consistency of the brain, which are not included in current in vitro DBS models, could have a profound effect on DBS electrode design and insertion protocols. Previous studies have shown that the insertion end of a device implanted in the brain should have the smallest possible diameter and a rounded tip so as to limit tissue disruption but maintain structural stability.19 This factor could be implemented and tested in DBS electrodes using agarose gels. A comprehensive model could be employed to understand both the impedance response of an electrode as well as its practicality concerning insertion and removal. Current in vitro models for both types of studies, DBS and infusion, do not include the components necessary to answer these questions or investigate these possibilities. A comprehensive model would allow for such variables to be addressed, improving the accuracy and clinical application of studies utilizing the model and hence allowing for more realistic correlations to be made between the model and actual brain tissue. For experimental accuracy and applicability to medical use in humans, in vivo methods will still provide the most relevant results, but any research project that does not require or cannot afford in vivo methods can benefit from a more realistic in vitro model.
Many methods have been proposed to create agarose gels that more closely model the impedance response of human neuronal tissue by introducing the tissue impedance component. The gel already has a “tissue component” of its own, but it does not display the negative concavity at high frequencies that we seek and seems only to contribute to the ability of the gel to model a CPE (Figure 14). All methods proposed below are based on the hypothesis that in order for a realistic impedance response to be observed, more separation of charge must occur within the gel, representing the capacitive element of the lipid bilayer of cells, as seen in Figure 12. It is believed that this will introduce the tissue component to the impedance response of the gel, which, together with the gel’s existing constant phase element characteristics, will make for a fully comprehensive model. One such method involves introducing microbeads into the gel during the gelation phase of the preparation procedure. The purpose of the beads is to hold a charge different from that of the agarose gel. These beads could be spread evenly throughout the gel, or a “gradient” of microbead density could be established, allowing impedance testing of different microbead concentrations in one gel sample. The beads themselves could be constructed of alginate, metal, Styrofoam, or polystyrene. Eunji et al. utilized a similar method in creating phantom gels designed to mimic a human organ for the purpose of MRI calibration.1 Although it was found that agar had a tendency to increase the conductivity of the gel, impedance spectroscopy was not performed, opening a window for further study. Another method proposed is soaking agarose gels in an aqueous solution similar to those discussed in the introduction such as PBS. The ions introduced into the gel by this process could have the capability to alter the impedance response of the gel. It is also proposed that yeast could be introduced into the gel during gelation along with a small amount of sugar to provide food for the yeast. When the yeast cells deplete the sugar, they perish. The yeast produce carbon dioxide bubbles, the size of which could be altered by the viscosity of the gel when the yeast are introduced and the amount of sugar introduced into the gel with the yeast because carbon dioxide production will cease when the yeast die. These gas bubbles have the potential to harbor separation of charge. Lastly, further exploration of capacitor design must be conducted. Many different kinds of materials with different dielectric constants are utilized in capacitors, and it is possible that employing such materials in the gel model may alter the impedance response. More research is warranted to discover if any of these methods have an effect on the gel Nyquist plot, and if they do, whether the response is indeed closer to that of in vivo brain tissue.
Fig. 14:
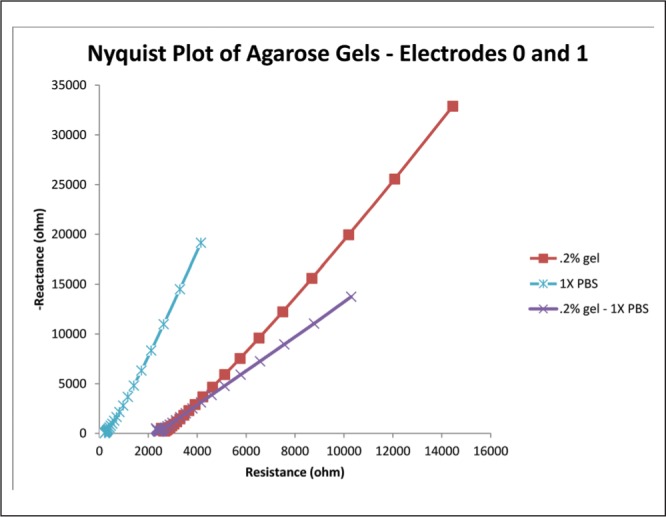
Copy of Figure 8, except the 0.6% concentration curve has been removed and another curve has been added. This curve represents the difference between the PBS and 0.2% concentration curves. This provides a decent approximation of what the “tissue component” of the gel impedance looks like, assuming that the PBS curve accurately represents the “electrode component.”
Fig. 12:
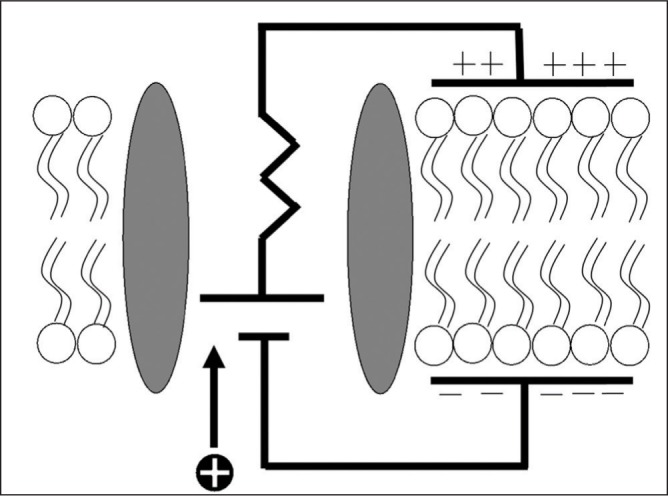
Diagram of the equivalent circuit model of a cell membrane (Jones, 2012). The lipid bilayer functions as a capacitive element, a phenomenon that, if recreated in the agarose gel, is believed to imbue the model with an impedance response similar to that of in vivo tissue. More research is warranted.
After the impedance response of the model has been verified, it then must be ensured that the alterations did not compromise the characteristics of the gel that make it useful for infusion studies. Protocols from Sillay et al. will be repeated to ensure that the results of this study are reproducible with the new comprehensive model.4 Ideally, the final model will have an impedance response similar to that seen in Lempka et al. (2009), infusion parameters as seen in Sillay et al. and a capacitance of about 0.9 microfarads/square centimeter, a value regarded as an approximate “biological constant” for neuronal tissue.20
In the future, it is feasible that such a gel model could expand to include not just the brain, but the entire body. Bioelectrical Impedance Spectroscopy (BIS) is a technique that utilizes the impedance to current flow through body tissues to gain body composition data. Nyquist plots of some such procedures look very similar to the response observed in the brain alone, so if our model is perfected, its uses could expand into this area of research as well.
Conclusion
The objective of this study was two-fold: create a baseline with which to make in vitro agarose gel models that are similar to human brain tissue in both poroelasticity and impedance response, and mathematically relate phase to agarose gel concentration to provide a comparative measure of agarose gel against other materials. Now that a baseline has been established for the impedance response of agarose gel, future work on the creation of a more realistic and comprehensive in vitro model can begin. Such a model could have a profound effect on the applicability of in vitro studies concerning DBS and infusion.
Acknowledgements
The author would like to extend a special thanks to Dr. Karl Sillay, Mr. Michael Nonte, Mr. Tom Richner, Prof. Amit Nimunkar, and Prof. John Puccinelli for providing their guidance, sharing their experience, and offering their knowledge on the subject of impedance phenomena. Thanks to Mr. Jiaquan Yu and Ms. Haili McCulloch for providing assistance with statistical analysis. We thank Dr. Justin Williams, Ms. Anyi Wang, Ms. Angelica Hinchman, Mr. Robert Gruener, and Mr. Alex McAlvay for their helpful reviews of the paper and suggestions for its improvement.
Footnotes
The article complies with International Committee of Medical Journal editor’s uniform requirements for manuscript.
Conflict of Interests: None
Source of funding: None
References
- 1.In E, Naguib HE, Haider M. Fabrication and characterization of polymer gel for MRI phantom with embedded lesion particles. Society of Photo-Optical Instrumentation Engineers (SPIE) Conference Series. 2012:8348. [Google Scholar]
- 2.Chen ZJ, Gillies GT, Broaddus WC et al. A realistic brain tissue phantom for intraparenchymal infusion studies. Journal of Neurosurgery. 2004;101(2):314–22. doi: 10.3171/jns.2004.101.2.0314. [DOI] [PubMed] [Google Scholar]
- 3.Chen ZJ, Broaddus WC, Viswanathan RR et al. Intraparenchymal drug delivery via positive-pressure infusion: Experimental and modeling studies of poroelasticity in brain phantom gels. Ieee Transactions on Biomedical Engineering. 2002;49(2):85–96. doi: 10.1109/10.979348. [DOI] [PubMed] [Google Scholar]
- 4.Sillay K, Schomberg D, Hinchman A et al. Benchmarking the ERG valve tip and MRI Interventions Smart Flow neurocatheter convection-enhanced delivery system’s performance in a gel model of the brain: employing infusion protocols proposed for gene therapy for Parkinson’s disease. Journal of Neural Engineering. 2012;9(2):026009. doi: 10.1088/1741-2560/9/2/026009. [DOI] [PubMed] [Google Scholar]
- 5.Sillay KA, Chen JC, Montgomery EB. Long-Term Measurement of Therapeutic Electrode Impedance in Deep Brain Stimulation. Neuromodulation. 2010;13(3):195–200. doi: 10.1111/j.1525-1403.2010.00275.x. [DOI] [PubMed] [Google Scholar]
- 6.Wei XF, Grill WM. Impedance characteristics of deep brain stimulation electrodes in vitro and in vivo. Journal of Neural Engineering. 2009;6(4):9. doi: 10.1088/1741-2560/6/4/046008. [DOI] [PMC free article] [PubMed] [Google Scholar]
- 7.Mercanzini A, Colin P, Bensadoun JC et al. In Vivo Electrical Impedance Spectroscopy of Tissue Reaction to Microelectrode Arraysl. Ieee Transactions on Biomedical Engineering. 2009;56(7):1909–1918. doi: 10.1109/TBME.2009.2018457. [DOI] [PubMed] [Google Scholar]
- 8.Gimsa J, Habel B, Schreiber U et al. Choosing electrodes for deep brain stimulation experiments - electrochemical considerations. Journal of Neuroscience Methods. 2005;142(2):251–65. doi: 10.1016/j.jneumeth.2004.09.001. [DOI] [PubMed] [Google Scholar]
- 9.Bedard C, Destexhe A. Generalized theory for current-source-density analysis in brain tissue. Physical Review E. 2011;84(4):15. doi: 10.1103/PhysRevE.84.041909. [DOI] [PubMed] [Google Scholar]
- 10.Butson CR, Maks CB, McIntyre CC. Sources and effects of electrode impedance during deep brain stimulation. Clinical Neurophysiology. 2006;117(2):447–54. doi: 10.1016/j.clinph.2005.10.007. [DOI] [PMC free article] [PubMed] [Google Scholar]
- 11.Frampton JP, Hynd MR, Williams JC et al. Three-dimensional hydrogel cultures for modeling changes in tissue impedance around microfabricated neural probes. J Neural Eng. 2007;4:399–409. doi: 10.1088/1741-2560/4/4/006. [DOI] [PubMed] [Google Scholar]
- 12.Williams JC, Hippensteel JA, Dilgen J et al. Complex impedance spectroscopy for monitoring tissue responses to inserted neural implants. Journal of Neural Engineering. 2007;4(4):410–423. doi: 10.1088/1741-2560/4/4/007. [DOI] [PubMed] [Google Scholar]
- 13.Lempka SF, Miocinovic S, Johnson MD et al. In vivo impedance spectroscopy of deep brain stimulation electrodes. Journal of Neural Engineering. 2009;6(4) doi: 10.1088/1741-2560/6/4/046001. [DOI] [PMC free article] [PubMed] [Google Scholar]
- 14.Butson CR, Maks CB, McIntyre CC. Sources and effects of electrode impedance during deep brain stimulation. Clinical Neurophysiology. 2006;117(2):447–54. doi: 10.1016/j.clinph.2005.10.007. [DOI] [PMC free article] [PubMed] [Google Scholar]
- 15.Lenth RV. Java Applets for Power and Sample Size [Computer software]. [Retrieved Nov 30;2012 from]. http://www.stat.uiowa.edu/~rlenth/Power http://www.stat.uiowa.edu/~rlenth/Power
- 16.McAdams ET, Lackermeier A, McLaughlin JA et al. The linear and nonlinear electrical-properties of the electrode-electrolyte interface. Biosensors & Bioelectronics. 1995;10(1-2):67–74. [Google Scholar]
- 17.Abad DG. Development of a capacitive bioimpedance measurement system. 2011:1–93. [Google Scholar]
- 18.Williams JC, Rennaker RL, Kipke D. Long-term Neural Recording Characteristics of Wire Microelectrode Arrays Implanted in Cerebral Cortex. Brain Research Protocols. 1999;(4):303–313. doi: 10.1016/s1385-299x(99)00034-3. [DOI] [PubMed] [Google Scholar]
- 19.Howard MA, Abkes BA, Ollendieck MC et al. Measurement of the force required to move a neurosurgical probe through in vivo human brain tissue. Ieee Transactions on Biomedical Engineering. 1999;46(7):891–4. doi: 10.1109/10.771205. [DOI] [PubMed] [Google Scholar]
- 20.Gentet LJ, Stuart GJ, Clements JD. Direct measurement of specific membrane capacitance in neurons. Biophysical Journal. 2000;79(1):314–20. doi: 10.1016/S0006-3495(00)76293-X. [DOI] [PMC free article] [PubMed] [Google Scholar]


