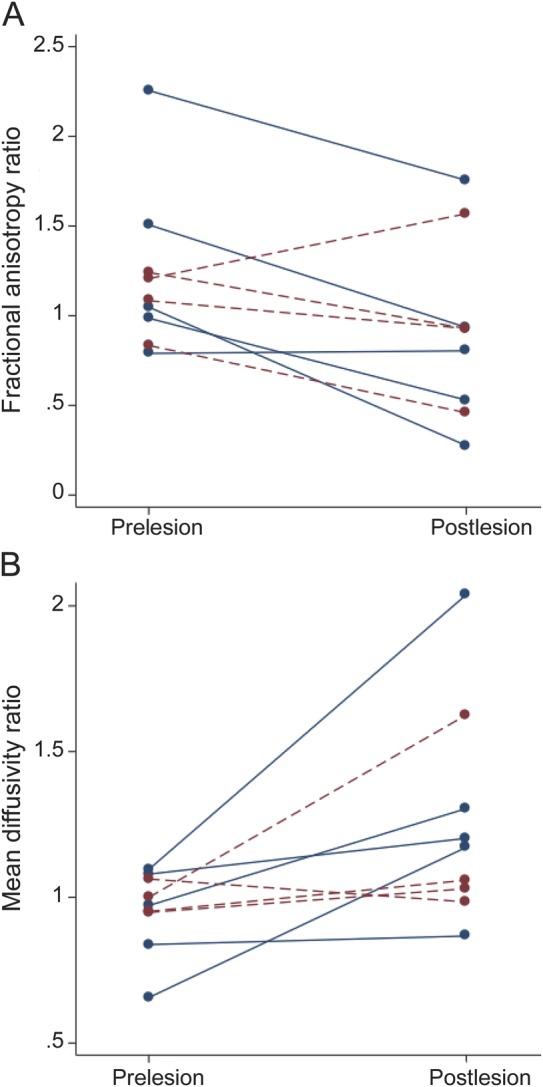
Figure 3. Longitudinal changes of FA (A) and MD (B) ratios from pre- to postlesional scans.

Dashed (red) lines represent the 4 lesions with no visible T1 or FLAIR changes at the lesion sites; solid (blue) lines the 5 lesions with visible T1 or FLAIR changes (see the results section). FA = fractional anisotropy; FLAIR = fluid-attenuated inversion recovery; MD = mean diffusivity.
