Abstract
We developed an in vitro protein expression and interaction analysis platform based on a highly parallel and sensitive microfluidic affinity assay, and used it for 14,792 on-chip experiments, which exhaustively measured the protein-protein interactions of 43 Streptococcus pneumoniae proteins in quadruplicate. The resulting network of 157 interactions was denser than expected based on known networks. Analysis of the network revealed previously undescribed physical interactions among members of some biochemical pathways.
A key question in proteomics is how to measure the large number of interactions in any given proteome. Even a small bacterial genome has a few thousand genes, with millions of potential protein-protein interactions. Many proteins also have multiple roles in the cell. Understanding the multiplicity of interactions is an essential requirement for systems biology and for computational approaches to modeling the cell. However, current methods are challenging enough that only a small number of prokaryotes have been mapped in any depth. In most cases, only a small fraction of the possible interactions have been found1–3. Many human pathogens, such as Streptococcus pneumoniae, have increasing antibiotic resistance and are the source of many hospital infections4. Understanding protein interaction networks in these organisms may aid the design of new antibiotics.
It is difficult to screen for protein-protein interactions. The yeast two-hybrid (Y2H) method detects an interaction between two proteins in the yeast nucleus5 and has been applied to large-scale interaction mapping1–3,6,7. However, this method has disadvantages. It cannot be used for membrane proteins, and the promiscuity of transcription factors poses a great challenge, leading to high false positive rates. In addition, the overlap between the sets of interactions discovered by independent Y2H studies of the same organism’s interactome is negligible, with agreement on the order of 1%7. Moreover, large-scale Y2H assay studies of Saccharomyces cerevisiae and Caenorhabditis elegans found only 5–10% of the expected interactions8. The sensitivities of these large studies are generally not reported, although they are often calibrated by ‘weak’ control interactions (E2F1 binding to Rb) with 3 nM binding constants9. A recent comparison between three ‘high-quality’ yeast proteome studies had concluded that the low overlap between them stems from low sensitivity10.
Methods that combine affinity purification with mass spectrometry can also be used to detect protein complexes. However, to distinguish specific from nonspecific interactions, stringent wash procedures are necessary, which could affect sensitivity. Moreover, effectiveness of the purification tags may vary depending on the organism11–13, and determining interconnectivity within the complex is also difficult. The Y2H and affinity purification methods show little overlap in Escherichia coli or S. cerevisiae protein interaction screens1,6,8,10,14, suggesting that even for a relatively simple bacterial model organism there is still a substantial portion of the proteome that is not being sampled. Microarray-based methods to screen for protein-protein interactions have also been developed15. However, most current methods rely on depositing purified proteins on the array, which hinders the design of a generic screen. Moreover, arrays are also less likely to detect weak or transient interactions owing to stringent wash requirements. An emerging method to detect interacting proteins is the protein complementation assay, but this requires one to be able to genetically manipulate the target organism16.
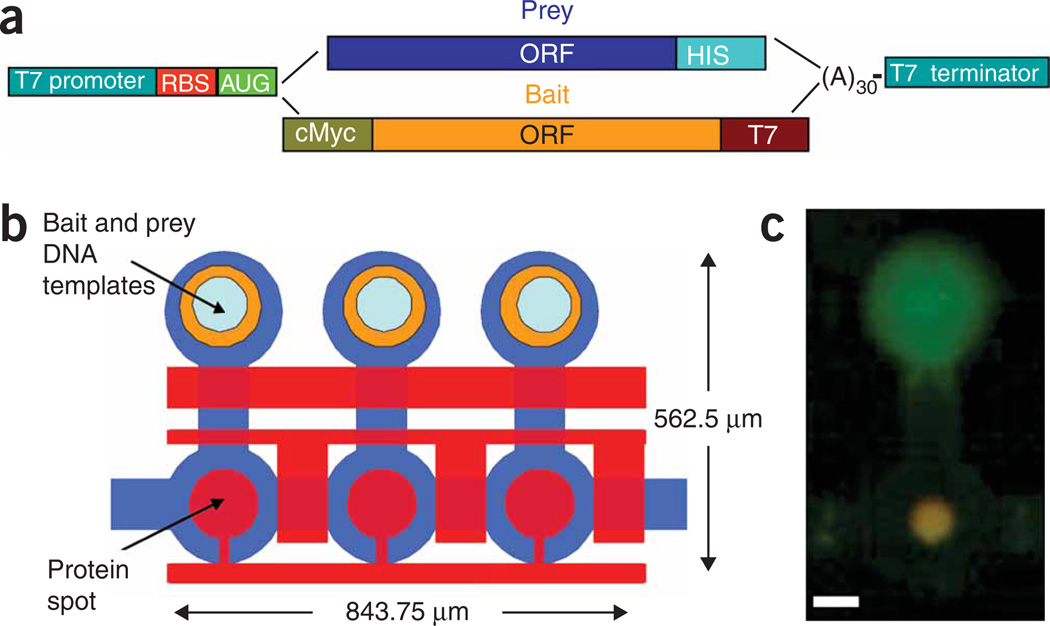
We developed an in vitro microfluidic platform for high-throughput screening of protein interactions, called protein interaction network generator (PING). PING combines on-chip in vitro protein synthesis with an in situ microfluidic affinity assay. PING uses our previously developed mechanical trapping of molecular interactions (MITOMI), which allows one to measure interactions without prey losses owing to washing, and can thus detect weak or transient interactions17. For PING, a co-spotted DNA microarray containing linear template encoding the proteins is aligned and bonded with the microfluidic device (Fig. 1a,b and Supplementary Fig. 1 online). One can therefore easily express thousands of protein combinations (either binary or complex) on a single device without the need for purification or prior knowledge of protein oligomeric state. The experiment consists of three main stages: (i) we use biotinylated BSA and streptavidin to deposit a biotinylated antibody that recognizes the bait protein on a circular area inside each individual chamber; (ii) we express proteins in vitro by filling each chamber with an E. coli extract that allows transcription and translation of the spotted DNA; (iii) the bait is immobilized on the chamber surface, and we measure any interactions between bait and prey using fluorescently labeled antibodies and MITOMI (Supplementary Methods online). In vitro protein expression prevents complications otherwise caused by cell viability or physiology, and PING enables a direct biophysical measurement of interactions for various proteins. Unlike other self-assembling protein array methods, each reaction occurs in its own unit cell, and there are hence no limitations resulting from cross-contamination or diffusion18 (Fig. 1b,c).
Figure 1.
Experimental design. (a) Graphical representation of expression template design. Both bait and prey DNA templates include a T7 promoter, ribosome binding site (RBS), poly(A) and T7 terminator. The bait library includes a c-myc tag for measuring expression and a T7 tag for protein pull-down. The prey library includes a His tag for detecting interactions. (b) Schematic of the device layout. Each unit cell is controlled by three micromechanical valves as well as a ‘button‘ membrane used for surface derivatization and MITOMI. Bait and Prey DNA templates are aligned under the chip’s DNA chambers in which proteins are expressed. Pull-down antibody is deposited under the button valve. Unit cell size is 281.25 mm by 562.5 mm and an area of 158,203 mm2. Average cell height is 10 mm, and average cell volume is less than 1 nl. Unit cell density is 632 cm−2. (c) Image of a typical bait (green) and prey (red) interaction on chip. Interaction is in orange owing to overlay of the two channels. Scale bar, 100 mm.
We used this device to explore interactions in the S. pneumoniae proteome by measuring all possible pairwise interactions in the set of proteins with at least one previously annotated interaction in Swissprot (Supplementary Table 1 online). These proteins include 32 homodimers, six heterodimers and five monomers. To estimate how weak an interaction PING can measure, we engineered an enhanced GFP (eGFP) construct with a 4His tag at its N terminus and measured its binding to an antibody to 5His (anti-5His); anti-5His binding to the 4His tag is known to be weak. Using PING, we found the binding constant to be 884 ± 158 nM (Supplementary Figs. 2 and 3 online), which sets the detection limit of PING as better than 0.9 µM. To further investigate this, we measured the affinity of the yeast transcription factor Pho4p for 256 DNA sequences, for which absolute affinities are known17. Again, we found a lower detection limit for PING near 1 µM, confirming the 4His-eGFP results. The existence of multimeric interactions complicates estimations of affinity of a protein-protein interaction, so the sensitivity of PING depends on the type of interaction (that is, the oligomeric state of the bait and prey) and cannot necessarily be captured in a single measurement. The 1 µM value is a rough estimate of sensitivity.
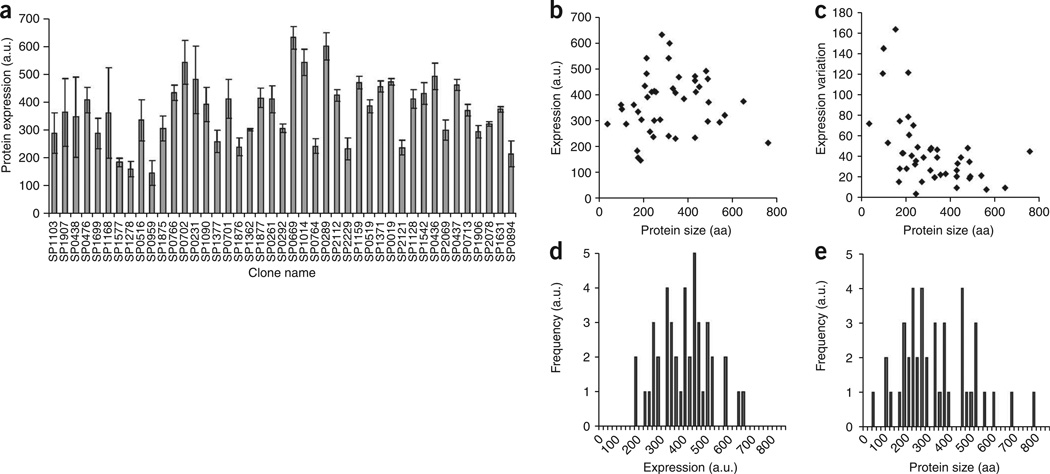
We characterized the on-chip expression profile of the set of 43 S. penumoniae proteins. All 43 proteins were expressed, with about 4 fold difference between lowest and highest expression levels (Fig. 2a). There was no correlation between protein size and expression (Fig. 2b–d). This shows that on-chip expression is not limited by size (within the range of 35–757 amino acids). We also found no correlation between the variation in protein expression (8%) and protein size (Fig. 2e). There were only 4 outlier proteins with large s.d. between experiments. Our dataset contains DNA-binding proteins (for example, SP2112), for which PING detected interactions. Recently, we had also demonstrated that this PING chip could be used to detect membrane protein-nucleic acid interactions19. Taken together, these results highlight the broad spectrum of proteins that can be investigated with PING.
Figure 2.
On-chip protein expression. (a) Protein expression levels (in arbitrary fluorescence units) of 43 different S. pneumoniae proteins were measured with Cy3-labeled antibody to c-myc. Error bars, s.e.m. n = 4. (b) Expression levels as a function of protein size. (c) Variation in expression levels (s.d.) as a function of protein size. (d,e) Distribution histograms of protein expression levels (d) and protein size (e) in the 43-protein set.
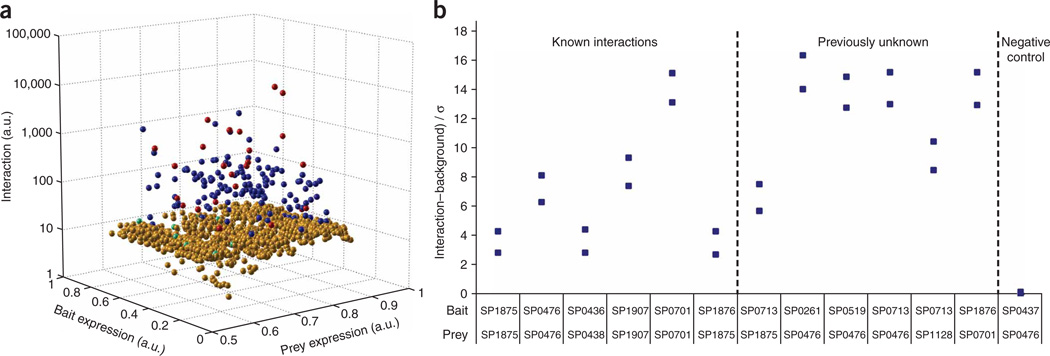
Next, we measured all possible pair-wise interactions between the 43 S. pneumoniae proteins (Supplementary Data 1 online). Bait-only and prey-only wells served as controls for nonspecific signals similar to Y2H or immunoprecipitation experiments. We used strict cutoffs: we considered any signal 2 s.d. above the bait-only average an interaction (prey-only had negligible signals). To reduce false positive interactions, we switched the roles of bait and prey and repeated the experiment. We considered only bidirectional interactions ‘positive’ (157/204 interactions). To confirm the significance of our cutoffs, we compared the negative interactions to the positive control (known) interactions using a nonparametric Mann-Whitney U test. The difference between the two datasets in a two-tailed test was highly significant (P < 2 × 10⁻⁶; Supplementary Table 2 online). We presented the results in a three-dimensional plot of the interaction strength as a function of bait and prey expression (Fig. 3) or as a histogram of the interaction strengths (Supplementary Fig. 4 online) with similar results. We performed a total of 14,792 individual experiments, encompassing all 1,849 possible interactions, with an experiment in each ‘direction’ performed in quadruplicate.
Figure 3.
Analysis of protein-protein interactions. (a) A three-dimensional plot of protein interactions as a function of bait and prey expression. Interactions (in arbitrary fluorescence units) are represented by spheres: specific or bidirectional interactions (blue), nonspecific or unidirectional interactions (gold), ’confirmed interactions‘ from the SwissProt database detected by PING (red) and SwissProt interactions that PING failed to detect (cyan). The cutoff was determined as 2 s.d. above the average signal resulting from anti-HIS binding to the corresponding bait-only expressing cells. (b) Verification of protein interactions by co-immunoprecipitation experiments. Six pairs of known interactors, six pairs of previously unknown interactors and one pair of proteins that do not interact were tested. Bait and prey protein pairs were co-expressed in vitro and then co-immunoprecipitated using Nickel beads. Prey levels were detected with Alexa 647-labeled antibody to the T7 tag. The data were plotted as net signal, in units of s.d. of the background.
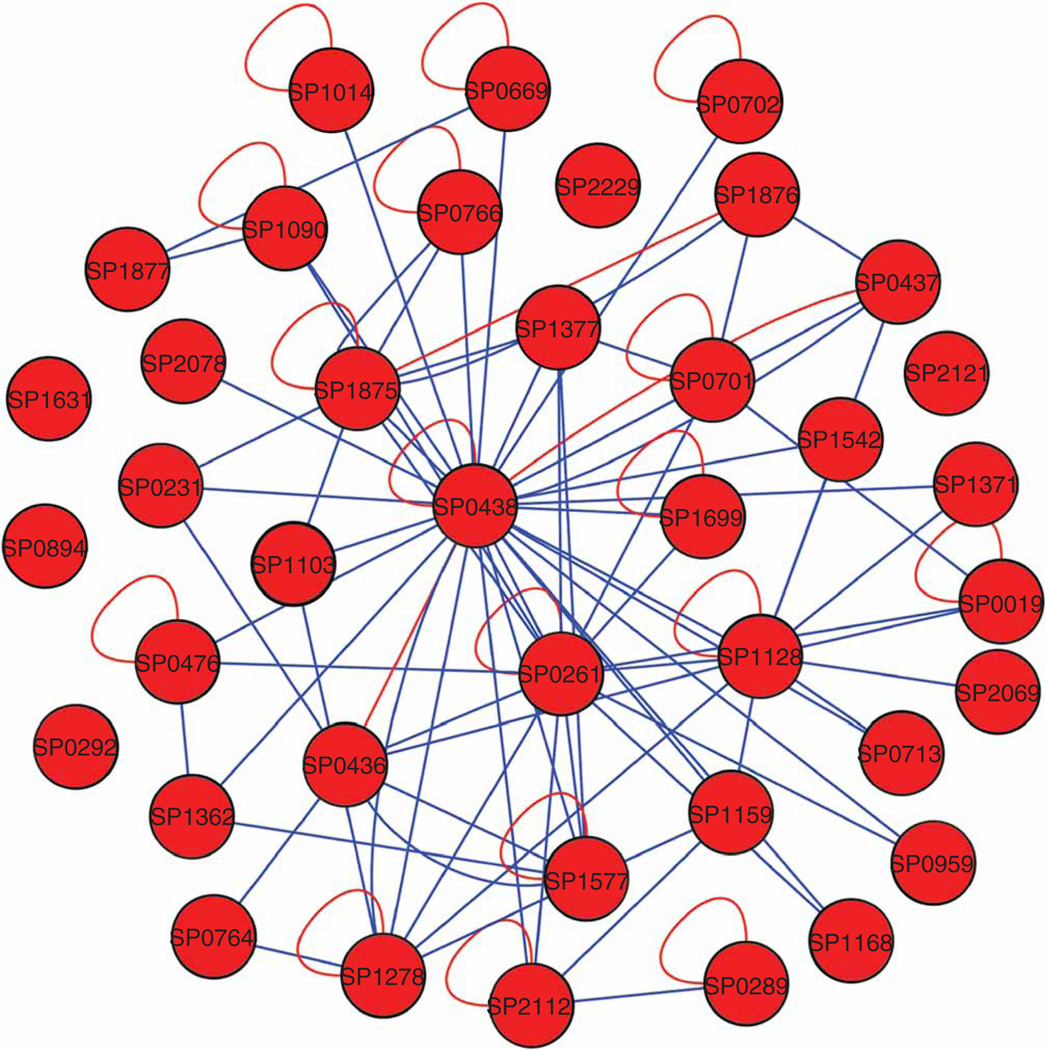
The S. pneumoniae network that we constructed consisted of a total of 43 nodes and 157 edges (Fig. 4 and Supplementary Table 3 online). We confirmed 157 out of 204 edges (77%) in the second scan (bait and prey reversed). The network contained 24/38 (63%) interactions annotated in the Swissprot database. None of the five proteins known to be monomers (negative controls) formed interactions with themselves, although we did discover interactions with other proteins in the set. As expected, the largest nodes were four heat-shock proteins, which were responsible for 61 edges. The largest node belonged to GroEL heat-shock complex, which is notorious for promiscuous binding1. There were 96 specific interactions in the network that did not involve the heat shock proteins. The network had an average of 3.6 interactions per protein. The average number of interactions per protein published in the Database of Interacting Proteins for E. coli is 4.0 (http://dip.doe-mbi.ucla.edu/dip/Stat.cgi/).
Figure 4.
S. pneumoniae interaction network represented by a hairball graph created with Cytoscape 2.4. Blue edges represent interactions found by PING screens. Red edges represent confirmed interactions from the Swissprot database. Heat shock proteins were omitted for clarity.
The false negative rate of PING was 37% (14 false negatives out of a total of 38 known interactions), if we assume the Swissprot annotations to be correct; in Y2H, the false negative rate has been variously estimated as 43%–71%20. To estimate the false positive fraction of PING interactions, we retested a small set of ‘positive’ but previously uncharacterized interactions, using co-immunoprecipitation. We also tested six known interactions as a positive control and used a pair of known noninteracting proteins as negative control (Fig. 3b). All 12 expected ‘positives’ co-immunoprecipitated but the negative control did not. Based on the fact that there were no false positives in the group of six new interactions, we estimated an upper limit of false positive fraction at 40%; the actual number may in fact be much lower. For Y2H, the false positive fraction can range from 47% to 91%20.
If PING was biased toward highly expressed proteins, we would expect fewer interactions for proteins with low expression, whereas highly expressed proteins would have more interactions. To examine such possible bias, we examined ten proteins with low expression and ten proteins with high expression. The average number of interactions for proteins with high expression was 4.2 ± 2.2 and for those with low expression it was 4.2 ± 4.0. In fact, three highly expressing proteins (SP0894, SP2121 and SP2229) had no detectable interactions at all. Therefore, we conclude that PING has no considerable bias toward highly expressed proteins (Supplementary Table 4 online).
Notably, we found some examples of previously undescribed physical interactions between proteins in the same biochemical pathway. For instance, asparagine synthetase (asnS) and tRNA amidotransferase (gatA) are involved in the alanine and aspartate metabolism pathways, and are seen to interact by PING. asnS controls conversion of aspartate to asparagine, and the gatABC complex can create asparagine tRNAs through a secondary pathway21. The AsnS-GatA interaction may be part of a feedback mechanism for the asparagine tRNA synthesis pathway. A second example is the interaction between dihydroorotate dehydrogenase (pyrD), which is involved in pyrimidine metabolism, and pyrimidine operon regulatory protein (pyrR). A potential physical interaction between these proteins also suggests a possible feedback mechanism. There are also interactions that are not as obvious to rationalize based on existing gene annotations. Many of these may well be ‘moonlighting’ proteins, which perform multiple apparently unrelated functions22.
PING begins with a clone library, but all subsequent steps are in vitro. For most common uses, in vitro expression either cannot generate enough protein or is prohibitively expensive. However, the economies of scale achieved with microfluidics allow us to express, purify and concentrate thousands of proteins in parallel. Each experiment begins with 50–100 pg of DNA template and is performed in a 1 nl volume. Taking into account the total volume of lysate used per device, only 2 nl of reagent is consumed per reaction, and costs are low. This approach to protein expression and screening is quite general and may be used in other applications.
In summary, using PING to study a subset of protein-protein interactions in S. pneumonia, we found that despite many years of research on this organism, conventional approaches discovered only a fraction of the interactions in this set of proteins. A surprisingly rich network of interactions exists, and our results suggest hypotheses about feedback within various metabolic pathways and indicate that many proteins may be involved in multiple functions.
Supplementary Material
ACKNOWLEDGMENTS
We thank members of the Stanford microfluidics foundry for help with device fabrication. This work was supported in part by the US National Institutes of Health Director’s Pioneer award (to S.R.Q.) and a Fulbright award (to D.G.).
Footnotes
Note: Supplementary information is available on the Nature Methods website.
COMPETING INTERESTS STATEMENT
The authors declare competing financial interests: details accompany the full-text HTML version of the paper at http://www.nature.com/naturemethods/.
References
- 1.Arifuzzaman M, et al. Genome Res. 2006;16:686–691. doi: 10.1101/gr.4527806. [DOI] [PMC free article] [PubMed] [Google Scholar]
- 2.Parrish JR, et al. Genome Biol. 2007;8:R130. doi: 10.1186/gb-2007-8-7-r130. [DOI] [PMC free article] [PubMed] [Google Scholar]
- 3.Shimoda Y, et al. DNA Res. 2008;15:13–23. doi: 10.1093/dnares/dsm028. [DOI] [PMC free article] [PubMed] [Google Scholar]
- 4.Hyde TB, et al. J. Am. Med. Assoc. 2001;286:1857–1862. [Google Scholar]
- 5.Fields S, Song O. Nature. 1989;340:245–246. doi: 10.1038/340245a0. [DOI] [PubMed] [Google Scholar]
- 6.Aloy P, Russell RB. Trends Biochem. Sci. 2002;27:633–638. doi: 10.1016/s0968-0004(02)02204-1. [DOI] [PubMed] [Google Scholar]
- 7.Parrish JR, Gulyas KD, Finley RL., Jr Curr. Opin. Biotechnol. 2006;17:387–393. doi: 10.1016/j.copbio.2006.06.006. [DOI] [PubMed] [Google Scholar]
- 8.Cusick ME, Klitgord N, Vidal M, Hill DE. Hum. Mol. Genet. 2005;14(Special issue 2):R171–R181. doi: 10.1093/hmg/ddi335. [DOI] [PubMed] [Google Scholar]
- 9.Lee C, Chang JH, Lee HS, Cho Y. Genes Dev. 2002;16:3199–3212. doi: 10.1101/gad.1046102. [DOI] [PMC free article] [PubMed] [Google Scholar]
- 10.Yu H, et al. Science. 2008;322:104–110. doi: 10.1126/science.1158684. [DOI] [PMC free article] [PubMed] [Google Scholar]
- 11.Deshaies RJ, et al. Mol. Cell. Proteomics. 2002;1:3–10. doi: 10.1074/mcp.r100001-mcp200. [DOI] [PubMed] [Google Scholar]
- 12.Rigaut G, et al. Nat. Biotechnol. 1999;17:1030–1032. doi: 10.1038/13732. [DOI] [PubMed] [Google Scholar]
- 13.Ho Y, et al. Nature. 2002;415:180–183. doi: 10.1038/415180a. [DOI] [PubMed] [Google Scholar]
- 14.Butland G, et al. Nature. 2005;433:531–537. doi: 10.1038/nature03239. [DOI] [PubMed] [Google Scholar]
- 15.Zhu H, et al. Science. 2001;293:2101–2105. doi: 10.1126/science.1062191. [DOI] [PubMed] [Google Scholar]
- 16.Tarassov K, et al. Science. 2008;320:1465–1470. doi: 10.1126/science.1153878. [DOI] [PubMed] [Google Scholar]
- 17.Maerkl SJ, Quake SR. Science. 2007;315:233–237. doi: 10.1126/science.1131007. [DOI] [PubMed] [Google Scholar]
- 18.Ramachandran N, et al. Science. 2004;305:86–90. doi: 10.1126/science.1097639. [DOI] [PubMed] [Google Scholar]
- 19.Einav S, et al. Nat. Biotechnol. 2008;26:1019–1027. doi: 10.1038/nbt.1490. [DOI] [PMC free article] [PubMed] [Google Scholar]
- 20.Edwards AM, et al. Trends Genet. 2002;18:529–536. doi: 10.1016/s0168-9525(02)02763-4. [DOI] [PubMed] [Google Scholar]
- 21.Curnow AW, Tumbula DL, Pelaschier JT, Min B, Soll D. Proc. Natl. Acad. Sci. USA. 1998;95:12838–12843. doi: 10.1073/pnas.95.22.12838. [DOI] [PMC free article] [PubMed] [Google Scholar]
- 22.Gancedo C, Flores CL. Microbiol. Mol. Biol. Rev. 2008;72:197–210. doi: 10.1128/MMBR.00036-07. [DOI] [PMC free article] [PubMed] [Google Scholar]
Associated Data
This section collects any data citations, data availability statements, or supplementary materials included in this article.


